Benefits example fact sheet 1
•
0 likes•22 views

Sample of collection tool to manage through data driven management
Recommended

Recommended
More Related Content
What's hot
What's hot (13)
Similar to Benefits example fact sheet 1
Similar to Benefits example fact sheet 1 (20)
Recently uploaded
Recently uploaded (20)
Benefits example fact sheet 1
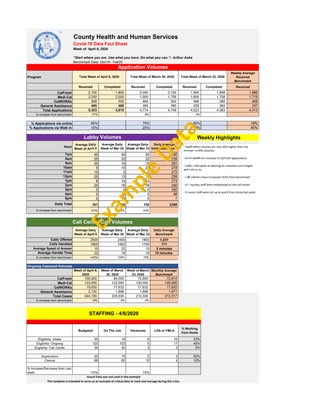
- 1. County Health and Human Services Covid-19 Data Fact Sheet Week of: April 6, 2020 “Start where you are. Use what you have. Do what you can.”– Arthur Ashe Benchmark Data: Dec19 - Feb20 Program Weekly Average Received Benchmark Received Completed Received Completed Received Completed Received CalFresh 2,100 1,800 2,000 2,100 1,900 1,858 1,888 Medi-Cal 2,200 2,000 1,900 1,758 1,800 1,758 1,719 CalWORKs 568 550 489 500 498 385 469 General Assistance 485 465 385 390 325 362 337 Total Applications 5,353 4,815 4,774 4,748 4,523 4,363 4,413 % increase from benchmark 21% 8% 2% % Applications via online 85% 75% 60% 18% % Applications via Walk In 15% 25% 40% 82% Hour Average Daily Week of April 6 Average Daily Week of Mar 30 Average Daily Week of Mar 23 Daily Average Visits Benchmark 7am 40 50 50 80 8am 20 20 20 259 9am 30 10 10 281 10am 5 15 25 278 11am 10 2 2 273 12pm 25 13 13 259 1pm 6 14 14 273 2pm 25 16 16 280 3pm 0 0 0 280 4pm 0 0 0 96 5pm 0 0 0 7 Daily Total 161 140 150 2366 % increase from benchmark -93% -94% -94% Average Daily Week of April 6 Average Daily Week of Mar 30 Average Daily Week of Mar 23 Daily Average Benchmark Calls Offered 2500 2400 1800 1,031 Calls Handled 1800 1900 1700 771 Average Speed of Answer 15 22 10 5 minutes Average Handle Time 22 18 18 15 minutes % increase from benchmark 142% 133% 75% Ongoing Caseload Volumes Week of April 6, 2020 Week of March 30, 2020 Week of March 23, 2020 Monthly Average Benchmark CalFresh 100,000 84,000 72,800 72,814 Medi-Cal 123,000 122,000 120,000 120,000 CalWORKs 19,000 17,632 17,632 17,632 General Assistance 2,100 1,898 1,898 1,871 Total Cases 244,100 225,530 212,330 212,317 % increase from benchmark 15% 6% 0% Budgeted On The Job Vacancies LOA or FMLA % Working from Home Eligibility- Intake 35 19 6 10 33% Eligibility- Ongoing 125 103 5 17 45% Eligibility- Call Center 36 30 3 3 0% Supervisors 20 15 2 3 50% Clerical 96 82 10 4 10% % Increase/Decrease from Last week -15% 15% This template is intended to serve as an example of critical data to track and manage during this crisis. Actual Data was not used in this example STAFFING - 4/6/2020 Weekly Highlights Total Week of April 6, 2020 Application Volumes Total Week of March 23, 2020Total Week of March 30, 2020 Lobby Volumes Call Center Call Volumes - Application volumes are now 20% higher than the average weekly volumes - most significant increase in CalFresh applications - Lobby visits peak at opening as customers are triaged and sent away. - Call volumes have increased 142% from benchmark - 10 Ongoing staff were redeployed to the call center - 10 more staff were set up to work from home last week