Real time data-pipeline from inception to production
Visualizing C2_MLADS_2015
1. Machine Learning, Analytics
& Data Science Conference
Dec 7-8
Redmond
15
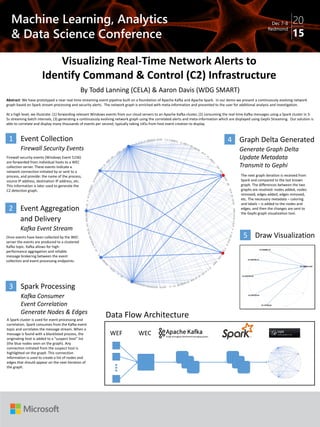
Visualizing Real-Time Network Alerts to
Identify Command & Control (C2) Infrastructure
Abstract: We have prototyped a near real-time streaming event pipeline built on a foundation of Apache Kafka and Apache Spark. In our demo we present a continuously evolving network
graph based on Spark stream processing and security alerts. The network graph is enriched with meta-information and presented to the user for additional analysis and investigation.
At a high level, we illustrate: (1) forwarding relevant Windows events from our cloud servers to an Apache Kafka cluster, (2) consuming the real-time Kafka messages using a Spark cluster in 3-
5s streaming batch intervals, (3) generating a continuously evolving network graph using the correlated alerts and meta-information which are displayed using Gephi Streaming. Our solution is
able to correlate and display many thousands of events per second, typically taking ±45s from host event creation to display.
Firewall security events (Windows Event 5156)
are forwarded from individual hosts to a WEC
collection server. These events indicate a
network connection initiated by or sent to a
process, and provide: the name of the process,
source IP address, destination IP address, etc.
This information is later used to generate the
C2 detection graph.
Once events have been collected by the WEC
server the events are produced to a clustered
Kafka topic. Kafka allows for high-
performance aggregation and reliable
message brokering between the event
collection and event processing endpoints.
The next graph iteration is received from
Spark and compared to the last known
graph. The differences between the two
graphs are resolved: nodes added, nodes
removed, edges added, edges removed,
etc. The necessary metadata – coloring
and labels – is added to the nodes and
edges, and then the changes are sent to
the Gephi graph visualization tool.
A Spark cluster is used for event processing and
correlation. Spark consumes from the Kafka event
topic and correlates the message stream. When a
message is found with a blacklisted process, the
originating host is added to a “suspect host” list
(the blue nodes seen on the graph). Any
connection initiated from the suspect host is
highlighted on the graph. This connection
information is used to create a list of nodes and
edges that should appear on the next iteration of
the graph.
By Todd Lanning (CELA) & Aaron Davis (WDG SMART)
1 Event Collection
Firewall Security Events
Data Flow Architecture
4 Graph Delta Generated
Generate Graph Delta
Update Metadata
Transmit to Gephi
2 Event Aggregation
and Delivery
Kafka Event Stream
3 Spark Processing
Kafka Consumer
Event Correlation
Generate Nodes & Edges
5 Draw Visualization
WEF WEC
![[ScalaByTheBay2016] Implement a scalable statistical aggregation system using...](data:image/gif;base64,R0lGODlhAQABAIAAAAAAAP///yH5BAEAAAAALAAAAAABAAEAAAIBRAA7)