SlideShare a Scribd company logo
1 of 1
Download to read offline
Low Cost Devices for Grain Moisture
Determination
Timothy Tubbs and Dr. Charles Woloshuk
Purdue University, Botany and Plant Pathology Department
Introduction
	 The primary factor responsible for spoilage of stored grain is
high moisture content. Prior to storage, grain is dried to a level
that inhibits the growth of most fungi, including several species that
produce mycotoxins. The typical target moisture for corn storage
is between 14.5 and 15 percent, and if corn is held over the sum-
mer months, 13.5 % moisture is recommended (Hodges et al).
Partofmyresearchfocusesontechnologiesformeasuringgrainmois-
ture. In developed countries, the measurement of grain moisture is
well established, and there are a variety of handheld instruments
used throughout the grain supply chain to monitor grain moisture.
In developing countries where resources are limited, small farmers
and local buyers do not utilize these devices. Often decisions about
grain dryness are determined by biting kernels to access hardness or
by listening to the sound kernels make when shaken in hand (Hodg-
es). Such methods are not ideal resulting in spoilage during storage
and the accumulation of high levels aflatoxin, which is produced by
Aspergillus flavus (Woloshuk et al). The goal of this research is to
find a low cost solution that can help corn producers in developing
countries determine when their grain is safe for storage. To achieve
this we are investigating the use of devices that measure humidity.
This concept is based on the fact that when grain in placed in a closed
container the moisture in the grain will come into equilibrium with
theairinthecontainer. Thekernelmoistureinthisjarisreferredtoas
equilibriummoisturecontent(EMC)andthehumidityinthissystem
is call equilibrium relative humidity (ERH). Knowing the ERH and
the ambient temperature, one can calculate grain moisture content
(Loewer et al). In this study, I am testing the efficacy of using digital
and strip hygrometers. The question being asked is: can these devis-
es measure grain moisture in a reasonable amount of time? We will
develop a decision-making protocol for determining if corn is dry
enough to prevent spoilage and aflatoxin contamination in storage.
Objectives
1.	 Evaluate efficacy of digital and strip hygrometers to measure
grain moisture
2.	 Develop a protocol for using digital and strip hygrometers to
measure grain moisture
Establishment of corn moisture. The moisture content of the corn was deter-
mined by dry weight analysis. The initial corn was 11%. Water was added to
the corn to achieve 13% and 15%.
Objective 1
What is the minimal time for making measurements?
Experiment- For each moisture level, 0.95 L glass jars containing 100 g of corn
were incubated for 2 hr at 22°C, 27°C and 37°C. One digital(Pictue 1) and one
strip hygrometer(Picture 2) were placed in each jar, and relative humidity was
recorded at 0, 15, 30, 60, 120 and 180 minutes. Three jars were tested for each
moisture level. Temperature and humidity data from each time point were fed
into an EMC calculator tool from the University of Arkansas (http://extension.
missouri.edu/webster/documents/presentations/2013-07-30_GrainStorag-
eTour/Equlibrium_Moisture_Content_Calculator-Univ_of_AR.xls). EMC
was also measured with a mini-GAC by Dickey-John(Picture 3).
Results
Objective 1
	 We set our initial moisture contents of
the corn based on oven dry weight method.
EMC values obtained with a Dicky John
moisture meter indicated the EMC of the
11%, 13 % and 15% corn was 13.2%, 14.7%
and 16.8% respectively(Chart 1). We were
able to monitor the humidity change over
time as moisture in the corn approached
equilibrium with the air in the jar. For both
hygrometers,thegraintemperatureaffected
the time it took to reach equilibrium, with
the slowest being at 22C, taking 2 hours to
reach equilibrium(Charts 2, 4, 6). The cal-
culated EMC value was near, within 0.3%
with the exception of 15% within 1.2%, that
of the Dicky-John devices(Chart 1). At the
hotter temperatures (27C and 37C), equi-
librium was reached in 60 min (Charts 2, 4,
6). Humidity measurements with the strip
hygrometer are more subjective because as
humidity rises the color of the indicated
changes from blue to pink (Charts 3, 5, 7).
The data were more variable than the digi-
tal hygrometer, possibly due to adsorption
properties of the dye material. As a result,
the EMC values were not consistent for the
three temperatures tested or with the val-
ues obtained with the Dicky-John or digital
hygrometer.
Acknowledgements
Funding provided by USAID and PICS3
About the Author
First year Master Student in Dr. Charlie Woloshuk’s lab work-
ing on the effects of maize in hermetic storage on Aspergillus
flavus growth and accumulation of aflatoxins in maize.
Discussion
	 Our goal is to develop a protocol to help farmers, especially in the tropical regions of Africa, to determine if their corn is dry enough
for safe storage. Based on our mold development assessment, we believe that an ERH value of 70% is a good threshold indicator for
making this determination. The value also agrees with information in published literature. Ideally 120 min incubation time would
be sufficient to make this determination. However, in the tropical regions where temperatures are above 27 C, it may be possible to
make the determination in 1 hr. Under these conditions, an ERH above 70% would tell the farmer that the corn is in need of further
drying to reach a safe moisture content for storage. With ERH below 70%, the farmer would know it is safe to store the corn.
Results
Objective 2
	 For all four weeks fungal growth was observed on the 15% corn and observed on the 13% corn at 37°C at week three and four.
From the spore suspention 13% and 15% corn needed a higher level of dilution to establish CFU compared to 11%. Preliminary data
indicates that colony-forming units (CFU) are much higher in the samples stored at 15% and 13% in the grain stored at 27˚C -37˚C
(Table 1).
Objective 2
What is safe moisture and corresponding humidity for storage?
Experiment- For each moisture level, three glass jars (0.95 L) containing 400 g
of corn were incubated at 22°C, 27°C and 37°C for one month. Once a week the
grain was examine to assess fungal growth on the grain surface. At the end of
one month, grain dry weight was determined and mold development was deter-
mined by dilution plating. Three samples (30g each) of corn were taken from
each jar. Each sample was placed in a flask with 100 ml of sterile 0.05% Triton
solution and shaken for 2 min. The resulting wash was serially diluted with
0.05% Triton and plated onto malt salt agar medium. The number of colony
forming unit was determined after 5 days of incubation at 27C. Representative
isolates were subcultured for subsequent genus and species determination.
Materials and Methods
CFU/gram of Corn
11% 13% 15%
37˚C 1.74 x 10⁴
2.24 x 10⁵
1.03 x 10⁷
27˚C 2.24 x 10⁴
2.00 x 10⁵
2.00 x 10⁶
22˚C 1.88 x 10⁴
2.67 x 10⁴
3.00 x 10⁶
ReferencesHodges, R., Stathers, T. (2012) Training Manual for Improving Grain Postharvest Handling and Storage (pp.61-62 74). UN World Food Programme.
Loewer, O. J., Bridges, T. C., Bucklin, R. A. (1994) On-Farm Drying and Storage Systems (pp. 49-52, 172). American Society of Agricultural Engineers.
Woloshuk, C., Martinez, E. (2012) Stored Product Protection: Chapter 6 Molds and Mycotoxins in Stored Products (pp.66-67). Kansas State University Agri-
cultural Experiment Station and Cooperative Extension Service.
Picture 1: Digital hygrometer
Picture 2: Strip hygrometer Picture 3: mini-GAC Dickey-John
10.0%
10.5%
11.0%
11.5%
12.0%
12.5%
13.0%
13.5%
15 30 45 60 75 90 105 120 135 150 165 180
EMC(%)
Time(mins)
EMC Over Time with 11% kernel moisture w/Digital Hygrometer
37C 27C 22C
Chart 2: Clustering of EMC for all three temperatures observed starting at 120 minutes.
10.0%
10.5%
11.0%
11.5%
12.0%
12.5%
13.0%
13.5%
14.0%
30 45 60 75 90 105 120 135 150 165 180
EMC(%)
Time(mins)
EMC Over Time with 11% kernel moisture w/Strip Hygrometer
37C 27C 22C
Chart 3: Very lose clustering of EMC for all three temperatures observed starting at 120
minutes but spreads out over the next hour.
11.0%
11.5%
12.0%
12.5%
13.0%
13.5%
14.0%
14.5%
15.0%
15.5%
15 30 45 60 75 90 105 120 135 150 165 180
EMC(%)
Time(mins)
EMC Over Time with 13% kernel moisture w/Digital Hygrometer
37C 27C 22C
Chart 4: Clustering of EMC for all three temperatures observed starting at 120 minutes.
10.0%
11.0%
12.0%
13.0%
14.0%
15.0%
16.0%
17.0%
18.0%
30 45 60 75 90 105 120 135 150 165 180
EMC(%)
Time(mins)
EMC Over Time with 13% kernel moisture w/Strip Hygrometer
37C 27C 22C
Chart 5: Clustering of EMC for 27C and 22C at 60 minutes. At 180 minutes lose clustering
of all three.
11.5%
12.0%
12.5%
13.0%
13.5%
14.0%
14.5%
15.0%
15.5%
16.0%
16.5%
15 30 45 60 75 90 105 120 135 150 165 180
EMC(%)
Time(mins)
EMC Over Time with 15% kernel moisture w/Digital Hygrometer
37C 27C 22C
Chart 6: Clustering of EMC for all three temperatures observed starting at 120 minutes.
10.0%
11.0%
12.0%
13.0%
14.0%
15.0%
16.0%
17.0%
18.0%
19.0%
20.0%
30 45 60 75 90 105 120 135 150 165 180
EMC(%)
Time(mins)
EMC Over Time with 15% kernel moisture w/Strip Hygrometer
37C 27C 22C
Chart 7: Tightest cluster for all three temperatures at 60 minutes but continues to spread out
over the next 2 hours.
12.9%
14.5%
15.6%
13.2%
14.7%
16.8%
10%
11%
12%
13%
14%
15%
16%
17%
11% 13% 15%
EMC(%)
EMC Comparison
Digtial DJ
Chart 1: Comparison of EMC for digital hygrometer and Dickey-John.
Chart 8: For 15% corn by dry weight at all temperatures and 13% by dry wight at 37˚C had ERH above 70%. For 13%
corn at 27˚C the ERH is very close to not a safe level.
Picture 4: From left to right 11% corn by dry weight with 10 fold dilution, 13% corn by dry weight with 100 fold
dilution and 15% corn by dry weight with 1000 dilution. Kernel moisture had direct effect of CFU.
Table 1: CFU for all kernel moistures at all tempertures. As the kernel moisture increases so does the CFU.
40%
45%
50%
55%
60%
65%
70%
75%
80%
85%
37C 27C 22C
ERH(%)
Threshold for Safe Corn Storage
13%
13%
13%
15%
15%
15%
11%
11%
11%
Safe ERH for corn

More Related Content

Similar to Low-Cost Grain Moisture Devices

Survival of Groundnut Seeds under Different Storage Conditions
Survival of Groundnut Seeds under Different Storage ConditionsSurvival of Groundnut Seeds under Different Storage Conditions
Survival of Groundnut Seeds under Different Storage ConditionsSeeds
 
Moisture content determination and equilibrium moisture content
Moisture content determination and equilibrium moisture contentMoisture content determination and equilibrium moisture content
Moisture content determination and equilibrium moisture contentAjay Singh Lodhi
 
IRJET- Moisture Adsorption Isotherm of Commercial Wheat Flour in Côte d’Ivoire
IRJET- Moisture Adsorption Isotherm of Commercial Wheat Flour in Côte d’IvoireIRJET- Moisture Adsorption Isotherm of Commercial Wheat Flour in Côte d’Ivoire
IRJET- Moisture Adsorption Isotherm of Commercial Wheat Flour in Côte d’IvoireIRJET Journal
 
Influence of Storage Conditions on Seed Quality and Longevity of Four Vegetab...
Influence of Storage Conditions on Seed Quality and Longevity of Four Vegetab...Influence of Storage Conditions on Seed Quality and Longevity of Four Vegetab...
Influence of Storage Conditions on Seed Quality and Longevity of Four Vegetab...Seeds
 
Seed Moisture Content, Germination and Seed Dormancy
Seed Moisture Content, Germination and Seed DormancySeed Moisture Content, Germination and Seed Dormancy
Seed Moisture Content, Germination and Seed DormancyDhaval Bhanderi
 
Effect of ultrafine powderization on enzymatic hydrolysis of wheat flour (1)
Effect of ultrafine powderization on enzymatic hydrolysis of wheat flour (1)Effect of ultrafine powderization on enzymatic hydrolysis of wheat flour (1)
Effect of ultrafine powderization on enzymatic hydrolysis of wheat flour (1)luisfiq1987
 
Analyses of moisture deficit grain yield loss in drought tolerant maize (Zea ...
Analyses of moisture deficit grain yield loss in drought tolerant maize (Zea ...Analyses of moisture deficit grain yield loss in drought tolerant maize (Zea ...
Analyses of moisture deficit grain yield loss in drought tolerant maize (Zea ...Professor Bashir Omolaran Bello
 
Effect of Spacing and Topping on the Performance of Hydroponically Grown Toma...
Effect of Spacing and Topping on the Performance of Hydroponically Grown Toma...Effect of Spacing and Topping on the Performance of Hydroponically Grown Toma...
Effect of Spacing and Topping on the Performance of Hydroponically Grown Toma...Journal of Agriculture and Crops
 
Comparison of major peanut allergens Ara h 1, Ara h 2 and Ara h 3 between pea...
Comparison of major peanut allergens Ara h 1, Ara h 2 and Ara h 3 between pea...Comparison of major peanut allergens Ara h 1, Ara h 2 and Ara h 3 between pea...
Comparison of major peanut allergens Ara h 1, Ara h 2 and Ara h 3 between pea...IOSRJPBS
 
Effective Moisture Diffusivity and Activation Energy of Tomato in Thin Layer ...
Effective Moisture Diffusivity and Activation Energy of Tomato in Thin Layer ...Effective Moisture Diffusivity and Activation Energy of Tomato in Thin Layer ...
Effective Moisture Diffusivity and Activation Energy of Tomato in Thin Layer ...drboon
 
Vermicomposting of Spent Mushroom Compost Using Perionyxexkavatus and Artific...
Vermicomposting of Spent Mushroom Compost Using Perionyxexkavatus and Artific...Vermicomposting of Spent Mushroom Compost Using Perionyxexkavatus and Artific...
Vermicomposting of Spent Mushroom Compost Using Perionyxexkavatus and Artific...Agriculture Journal IJOEAR
 
PSYCHROMETRY AND DRYING POST HARVEST TECHNOLOGY UNIT 2.pptx
PSYCHROMETRY AND DRYING POST HARVEST TECHNOLOGY UNIT 2.pptxPSYCHROMETRY AND DRYING POST HARVEST TECHNOLOGY UNIT 2.pptx
PSYCHROMETRY AND DRYING POST HARVEST TECHNOLOGY UNIT 2.pptxARUL S
 
Drying of agricultural products using forced convection indirect solar dryer
Drying of agricultural products using forced convection indirect solar dryerDrying of agricultural products using forced convection indirect solar dryer
Drying of agricultural products using forced convection indirect solar dryerIRJESJOURNAL
 
Influence of Mannitol Priming on Maize Seeds Under Induced Water Stress
Influence of Mannitol Priming on Maize Seeds Under Induced Water StressInfluence of Mannitol Priming on Maize Seeds Under Induced Water Stress
Influence of Mannitol Priming on Maize Seeds Under Induced Water StressJournal of Agriculture and Crops
 
Theme 3: Effect of dormancy-breaking methods on seed tuber sprouting and subs...
Theme 3: Effect of dormancy-breaking methods on seed tuber sprouting and subs...Theme 3: Effect of dormancy-breaking methods on seed tuber sprouting and subs...
Theme 3: Effect of dormancy-breaking methods on seed tuber sprouting and subs...African Potato Association (APA)
 

Similar to Low-Cost Grain Moisture Devices (20)

Survival of Groundnut Seeds under Different Storage Conditions
Survival of Groundnut Seeds under Different Storage ConditionsSurvival of Groundnut Seeds under Different Storage Conditions
Survival of Groundnut Seeds under Different Storage Conditions
 
Moisture content determination and equilibrium moisture content
Moisture content determination and equilibrium moisture contentMoisture content determination and equilibrium moisture content
Moisture content determination and equilibrium moisture content
 
IRJET- Moisture Adsorption Isotherm of Commercial Wheat Flour in Côte d’Ivoire
IRJET- Moisture Adsorption Isotherm of Commercial Wheat Flour in Côte d’IvoireIRJET- Moisture Adsorption Isotherm of Commercial Wheat Flour in Côte d’Ivoire
IRJET- Moisture Adsorption Isotherm of Commercial Wheat Flour in Côte d’Ivoire
 
Influence of Storage Conditions on Seed Quality and Longevity of Four Vegetab...
Influence of Storage Conditions on Seed Quality and Longevity of Four Vegetab...Influence of Storage Conditions on Seed Quality and Longevity of Four Vegetab...
Influence of Storage Conditions on Seed Quality and Longevity of Four Vegetab...
 
Influence of Storage Conditions on Seed Quality and Longevity of Four Vegetab...
Influence of Storage Conditions on Seed Quality and Longevity of Four Vegetab...Influence of Storage Conditions on Seed Quality and Longevity of Four Vegetab...
Influence of Storage Conditions on Seed Quality and Longevity of Four Vegetab...
 
Seed Moisture Content, Germination and Seed Dormancy
Seed Moisture Content, Germination and Seed DormancySeed Moisture Content, Germination and Seed Dormancy
Seed Moisture Content, Germination and Seed Dormancy
 
Effect of ultrafine powderization on enzymatic hydrolysis of wheat flour (1)
Effect of ultrafine powderization on enzymatic hydrolysis of wheat flour (1)Effect of ultrafine powderization on enzymatic hydrolysis of wheat flour (1)
Effect of ultrafine powderization on enzymatic hydrolysis of wheat flour (1)
 
Analyses of moisture deficit grain yield loss in drought tolerant maize (Zea ...
Analyses of moisture deficit grain yield loss in drought tolerant maize (Zea ...Analyses of moisture deficit grain yield loss in drought tolerant maize (Zea ...
Analyses of moisture deficit grain yield loss in drought tolerant maize (Zea ...
 
Moisture content determination Methods by Hema Gavit
Moisture content determination Methods by Hema GavitMoisture content determination Methods by Hema Gavit
Moisture content determination Methods by Hema Gavit
 
L41037176
L41037176L41037176
L41037176
 
Effect of Spacing and Topping on the Performance of Hydroponically Grown Toma...
Effect of Spacing and Topping on the Performance of Hydroponically Grown Toma...Effect of Spacing and Topping on the Performance of Hydroponically Grown Toma...
Effect of Spacing and Topping on the Performance of Hydroponically Grown Toma...
 
Comparison of major peanut allergens Ara h 1, Ara h 2 and Ara h 3 between pea...
Comparison of major peanut allergens Ara h 1, Ara h 2 and Ara h 3 between pea...Comparison of major peanut allergens Ara h 1, Ara h 2 and Ara h 3 between pea...
Comparison of major peanut allergens Ara h 1, Ara h 2 and Ara h 3 between pea...
 
Effective Moisture Diffusivity and Activation Energy of Tomato in Thin Layer ...
Effective Moisture Diffusivity and Activation Energy of Tomato in Thin Layer ...Effective Moisture Diffusivity and Activation Energy of Tomato in Thin Layer ...
Effective Moisture Diffusivity and Activation Energy of Tomato in Thin Layer ...
 
Vermicomposting of Spent Mushroom Compost Using Perionyxexkavatus and Artific...
Vermicomposting of Spent Mushroom Compost Using Perionyxexkavatus and Artific...Vermicomposting of Spent Mushroom Compost Using Perionyxexkavatus and Artific...
Vermicomposting of Spent Mushroom Compost Using Perionyxexkavatus and Artific...
 
PSYCHROMETRY AND DRYING POST HARVEST TECHNOLOGY UNIT 2.pptx
PSYCHROMETRY AND DRYING POST HARVEST TECHNOLOGY UNIT 2.pptxPSYCHROMETRY AND DRYING POST HARVEST TECHNOLOGY UNIT 2.pptx
PSYCHROMETRY AND DRYING POST HARVEST TECHNOLOGY UNIT 2.pptx
 
Drying of agricultural products using forced convection indirect solar dryer
Drying of agricultural products using forced convection indirect solar dryerDrying of agricultural products using forced convection indirect solar dryer
Drying of agricultural products using forced convection indirect solar dryer
 
FFR COPY
FFR  COPYFFR  COPY
FFR COPY
 
Influence of Mannitol Priming on Maize Seeds Under Induced Water Stress
Influence of Mannitol Priming on Maize Seeds Under Induced Water StressInfluence of Mannitol Priming on Maize Seeds Under Induced Water Stress
Influence of Mannitol Priming on Maize Seeds Under Induced Water Stress
 
Monday theme 3 1645 1700 room 2 soboka
Monday theme 3 1645 1700 room 2 sobokaMonday theme 3 1645 1700 room 2 soboka
Monday theme 3 1645 1700 room 2 soboka
 
Theme 3: Effect of dormancy-breaking methods on seed tuber sprouting and subs...
Theme 3: Effect of dormancy-breaking methods on seed tuber sprouting and subs...Theme 3: Effect of dormancy-breaking methods on seed tuber sprouting and subs...
Theme 3: Effect of dormancy-breaking methods on seed tuber sprouting and subs...
 

Low-Cost Grain Moisture Devices

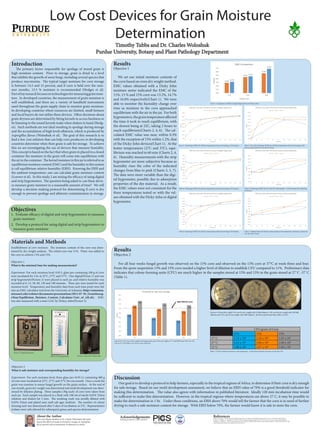
  • 1. Low Cost Devices for Grain Moisture Determination Timothy Tubbs and Dr. Charles Woloshuk Purdue University, Botany and Plant Pathology Department Introduction The primary factor responsible for spoilage of stored grain is high moisture content. Prior to storage, grain is dried to a level that inhibits the growth of most fungi, including several species that produce mycotoxins. The typical target moisture for corn storage is between 14.5 and 15 percent, and if corn is held over the sum- mer months, 13.5 % moisture is recommended (Hodges et al). Partofmyresearchfocusesontechnologiesformeasuringgrainmois- ture. In developed countries, the measurement of grain moisture is well established, and there are a variety of handheld instruments used throughout the grain supply chain to monitor grain moisture. In developing countries where resources are limited, small farmers and local buyers do not utilize these devices. Often decisions about grain dryness are determined by biting kernels to access hardness or by listening to the sound kernels make when shaken in hand (Hodg- es). Such methods are not ideal resulting in spoilage during storage and the accumulation of high levels aflatoxin, which is produced by Aspergillus flavus (Woloshuk et al). The goal of this research is to find a low cost solution that can help corn producers in developing countries determine when their grain is safe for storage. To achieve this we are investigating the use of devices that measure humidity. This concept is based on the fact that when grain in placed in a closed container the moisture in the grain will come into equilibrium with theairinthecontainer. Thekernelmoistureinthisjarisreferredtoas equilibriummoisturecontent(EMC)andthehumidityinthissystem is call equilibrium relative humidity (ERH). Knowing the ERH and the ambient temperature, one can calculate grain moisture content (Loewer et al). In this study, I am testing the efficacy of using digital and strip hygrometers. The question being asked is: can these devis- es measure grain moisture in a reasonable amount of time? We will develop a decision-making protocol for determining if corn is dry enough to prevent spoilage and aflatoxin contamination in storage. Objectives 1. Evaluate efficacy of digital and strip hygrometers to measure grain moisture 2. Develop a protocol for using digital and strip hygrometers to measure grain moisture Establishment of corn moisture. The moisture content of the corn was deter- mined by dry weight analysis. The initial corn was 11%. Water was added to the corn to achieve 13% and 15%. Objective 1 What is the minimal time for making measurements? Experiment- For each moisture level, 0.95 L glass jars containing 100 g of corn were incubated for 2 hr at 22°C, 27°C and 37°C. One digital(Pictue 1) and one strip hygrometer(Picture 2) were placed in each jar, and relative humidity was recorded at 0, 15, 30, 60, 120 and 180 minutes. Three jars were tested for each moisture level. Temperature and humidity data from each time point were fed into an EMC calculator tool from the University of Arkansas (http://extension. missouri.edu/webster/documents/presentations/2013-07-30_GrainStorag- eTour/Equlibrium_Moisture_Content_Calculator-Univ_of_AR.xls). EMC was also measured with a mini-GAC by Dickey-John(Picture 3). Results Objective 1 We set our initial moisture contents of the corn based on oven dry weight method. EMC values obtained with a Dicky John moisture meter indicated the EMC of the 11%, 13 % and 15% corn was 13.2%, 14.7% and 16.8% respectively(Chart 1). We were able to monitor the humidity change over time as moisture in the corn approached equilibrium with the air in the jar. For both hygrometers,thegraintemperatureaffected the time it took to reach equilibrium, with the slowest being at 22C, taking 2 hours to reach equilibrium(Charts 2, 4, 6). The cal- culated EMC value was near, within 0.3% with the exception of 15% within 1.2%, that of the Dicky-John devices(Chart 1). At the hotter temperatures (27C and 37C), equi- librium was reached in 60 min (Charts 2, 4, 6). Humidity measurements with the strip hygrometer are more subjective because as humidity rises the color of the indicated changes from blue to pink (Charts 3, 5, 7). The data were more variable than the digi- tal hygrometer, possibly due to adsorption properties of the dye material. As a result, the EMC values were not consistent for the three temperatures tested or with the val- ues obtained with the Dicky-John or digital hygrometer. Acknowledgements Funding provided by USAID and PICS3 About the Author First year Master Student in Dr. Charlie Woloshuk’s lab work- ing on the effects of maize in hermetic storage on Aspergillus flavus growth and accumulation of aflatoxins in maize. Discussion Our goal is to develop a protocol to help farmers, especially in the tropical regions of Africa, to determine if their corn is dry enough for safe storage. Based on our mold development assessment, we believe that an ERH value of 70% is a good threshold indicator for making this determination. The value also agrees with information in published literature. Ideally 120 min incubation time would be sufficient to make this determination. However, in the tropical regions where temperatures are above 27 C, it may be possible to make the determination in 1 hr. Under these conditions, an ERH above 70% would tell the farmer that the corn is in need of further drying to reach a safe moisture content for storage. With ERH below 70%, the farmer would know it is safe to store the corn. Results Objective 2 For all four weeks fungal growth was observed on the 15% corn and observed on the 13% corn at 37°C at week three and four. From the spore suspention 13% and 15% corn needed a higher level of dilution to establish CFU compared to 11%. Preliminary data indicates that colony-forming units (CFU) are much higher in the samples stored at 15% and 13% in the grain stored at 27˚C -37˚C (Table 1). Objective 2 What is safe moisture and corresponding humidity for storage? Experiment- For each moisture level, three glass jars (0.95 L) containing 400 g of corn were incubated at 22°C, 27°C and 37°C for one month. Once a week the grain was examine to assess fungal growth on the grain surface. At the end of one month, grain dry weight was determined and mold development was deter- mined by dilution plating. Three samples (30g each) of corn were taken from each jar. Each sample was placed in a flask with 100 ml of sterile 0.05% Triton solution and shaken for 2 min. The resulting wash was serially diluted with 0.05% Triton and plated onto malt salt agar medium. The number of colony forming unit was determined after 5 days of incubation at 27C. Representative isolates were subcultured for subsequent genus and species determination. Materials and Methods CFU/gram of Corn 11% 13% 15% 37˚C 1.74 x 10⁴ 2.24 x 10⁵ 1.03 x 10⁷ 27˚C 2.24 x 10⁴ 2.00 x 10⁵ 2.00 x 10⁶ 22˚C 1.88 x 10⁴ 2.67 x 10⁴ 3.00 x 10⁶ ReferencesHodges, R., Stathers, T. (2012) Training Manual for Improving Grain Postharvest Handling and Storage (pp.61-62 74). UN World Food Programme. Loewer, O. J., Bridges, T. C., Bucklin, R. A. (1994) On-Farm Drying and Storage Systems (pp. 49-52, 172). American Society of Agricultural Engineers. Woloshuk, C., Martinez, E. (2012) Stored Product Protection: Chapter 6 Molds and Mycotoxins in Stored Products (pp.66-67). Kansas State University Agri- cultural Experiment Station and Cooperative Extension Service. Picture 1: Digital hygrometer Picture 2: Strip hygrometer Picture 3: mini-GAC Dickey-John 10.0% 10.5% 11.0% 11.5% 12.0% 12.5% 13.0% 13.5% 15 30 45 60 75 90 105 120 135 150 165 180 EMC(%) Time(mins) EMC Over Time with 11% kernel moisture w/Digital Hygrometer 37C 27C 22C Chart 2: Clustering of EMC for all three temperatures observed starting at 120 minutes. 10.0% 10.5% 11.0% 11.5% 12.0% 12.5% 13.0% 13.5% 14.0% 30 45 60 75 90 105 120 135 150 165 180 EMC(%) Time(mins) EMC Over Time with 11% kernel moisture w/Strip Hygrometer 37C 27C 22C Chart 3: Very lose clustering of EMC for all three temperatures observed starting at 120 minutes but spreads out over the next hour. 11.0% 11.5% 12.0% 12.5% 13.0% 13.5% 14.0% 14.5% 15.0% 15.5% 15 30 45 60 75 90 105 120 135 150 165 180 EMC(%) Time(mins) EMC Over Time with 13% kernel moisture w/Digital Hygrometer 37C 27C 22C Chart 4: Clustering of EMC for all three temperatures observed starting at 120 minutes. 10.0% 11.0% 12.0% 13.0% 14.0% 15.0% 16.0% 17.0% 18.0% 30 45 60 75 90 105 120 135 150 165 180 EMC(%) Time(mins) EMC Over Time with 13% kernel moisture w/Strip Hygrometer 37C 27C 22C Chart 5: Clustering of EMC for 27C and 22C at 60 minutes. At 180 minutes lose clustering of all three. 11.5% 12.0% 12.5% 13.0% 13.5% 14.0% 14.5% 15.0% 15.5% 16.0% 16.5% 15 30 45 60 75 90 105 120 135 150 165 180 EMC(%) Time(mins) EMC Over Time with 15% kernel moisture w/Digital Hygrometer 37C 27C 22C Chart 6: Clustering of EMC for all three temperatures observed starting at 120 minutes. 10.0% 11.0% 12.0% 13.0% 14.0% 15.0% 16.0% 17.0% 18.0% 19.0% 20.0% 30 45 60 75 90 105 120 135 150 165 180 EMC(%) Time(mins) EMC Over Time with 15% kernel moisture w/Strip Hygrometer 37C 27C 22C Chart 7: Tightest cluster for all three temperatures at 60 minutes but continues to spread out over the next 2 hours. 12.9% 14.5% 15.6% 13.2% 14.7% 16.8% 10% 11% 12% 13% 14% 15% 16% 17% 11% 13% 15% EMC(%) EMC Comparison Digtial DJ Chart 1: Comparison of EMC for digital hygrometer and Dickey-John. Chart 8: For 15% corn by dry weight at all temperatures and 13% by dry wight at 37˚C had ERH above 70%. For 13% corn at 27˚C the ERH is very close to not a safe level. Picture 4: From left to right 11% corn by dry weight with 10 fold dilution, 13% corn by dry weight with 100 fold dilution and 15% corn by dry weight with 1000 dilution. Kernel moisture had direct effect of CFU. Table 1: CFU for all kernel moistures at all tempertures. As the kernel moisture increases so does the CFU. 40% 45% 50% 55% 60% 65% 70% 75% 80% 85% 37C 27C 22C ERH(%) Threshold for Safe Corn Storage 13% 13% 13% 15% 15% 15% 11% 11% 11% Safe ERH for corn