SlideShare a Scribd company logo
1 of 23
Download to read offline
www.theijbmt.com 20|Page
The International Journal of Business Management and Technology, Volume 2 Issue 6 November-December 2018
ISSN: 2581-3889
Research Article Open Access
Kier Group Plc: business and financial performance
analysis and evaluation
Paul Eisenberg*1
1
The University of Portsmouth Business School, Portland St, Portsmouth PO1 3DE, United Kingdom
Abstract
The subject matter of this paper is the analysis and evaluation of the business and financial performance of the Kier
Group Plc over the three year period 2012–2014. The company is analysed against the comparator undertaking Balfour
Beatty Plc and the average numbers of the UK and international construction industry.
The financial analysis is performed over the range of financial ratios commonly applied in undergraduate and graduate
business studies. For the purposes of the business analysis, the SWOT Model and the PESTEL Framework are used.
The research reveals that due to diversified divisions and a high market share the Kier Group Plc is able to generate
growing revenues, albeit at the high administrative costs and with an extending operating cycle. Further, revenue
growth is not accompanied by improved liquidity. The growing social diversification among residential customers, the
steady technological change and the increasing demand for sustainable construction place additional challenges to the
Group.
The results obtained are of interest for the construction industry researchers, financial analysts and financial and
business analysis students.
Keywords: Financial Ratio Analysis, SWOT Model, PESTEL Framework
I. INTRODUCTION
The Kier Group Plc (in the following: Kier) engages in construction work, ranging from residential buildings over
commercial and public sector constructing to infrastructural projects, and provides related services (Kier, 2014). The
business is essential for the fundamental human demand for housing and for commercial and public real estate. After
the construction work is completed, new jobs are created in the communities involved, as is the case with Derby, UK,
where Kier builds a business park in place of a closed hospital (Johnson, 2014). Hence, the far-reaching impact on its
environment makes the analysis of this company worthwhile.
Kier was founded in 1928 (Jones, 2006) and since has grown consistently to form a FTSE250 group. It is widely
diversified across competencies, customers and regions (Cho, 2011). Its client base includes defence and education,
power and transportation and other industries. The UK, the Caribbean area, the Middle East and Hong Kong are the
main regions of its operations (Kier, 2014). With 60 out of the UK’s 350 local authorities it has an impressive record of
governmental contracting. The 60 communities account for over 17% of the local public market (Kier, 2014). In terms of
sales, Kier takes 23rd place amongst European constructing companies (Deloitte, 2013) and fourth place in the UK (BIS,
2013), which makes it one of the leading players in the field (Datamonitor, 2011). Currently, the group employs over
15,000 persons around the globe (Kier, 2014).
With Kier being a listed company, the comparator chosen is also an entity listed in the FTSE250 index to enhance
comparability. The FTSE250 is composed of companies in terms of market capitalisation (Bioy, 2014). The same financial
reporting and auditing standards are applied to the companies (LSE, 2010). Furthermore, the listing on the same stock
exchange makes the transition of numbers to a single currency unnecessary. Besides Kier there are only two companies
in FTSE250 sector Construction & Materials, namely Balfour Beatty Plc (in the following: BBY) and Keller Group Plc (in
the following: Keller) (LSE, 2015a). Keller engages in ground work / piling systems (Keller, 2015) which is different to
the business of Kier. By contrast, BBY operates in building and infrastructure markets (BBY, 2015), as does Kier.
Furthermore, Kier and BBY entered a refurbishing and constructing joint venture (JV) in 2013 (Kier, 2013). Hence, BBY is
chosen as a comparator company.
www.theijbmt.com 21|Page
Kier Group Plc: business and financial performance analysis and evaluation
Founded in 1909, BBY has engaged in overseas constructing operations since 1924, starting with Nairobi and Kenia
(BBY, 2009), with now more than 39,000 workers currently employed in building and engineering, utility services and
infrastructural projects in over 80 countries (BBY, 2015). The Hong Kong Airport development (BBY, 2009) and the
facilities services for the Olympic Park, London (BBY, 2013) give an impression of its world-class scale of operations
(BBY, 2009). BBY is the seventh strongest European constructing company (Deloitte, 2013) and the strongest in the UK in
terms of sales (BIS, 2013).
This paper aims to meet the following objectives:
(1) To scrutiny the financial performance of Kier over the three year period of 2012–2014 in comparison to BBY and the
UK construction industry using ratio analysis.
(2) To evaluate the internal and external factors impacting on Kier’s business performance through the SWOT Model
and the PESTEL Framework.
(3) To provide the conclusion about the financial position and the commercial progress of Kier.
The research questions (RQ) it seeks to answer are:
RQ1. What is the financial standing of Kier according to its financial reports compared to BBY?
RQ2. Which micro and macro aspects affect Kier’s business performance?
RQ3. What can be done by Kier to improve its financial standing and to secure further business growth?
II. METHODOLOGY
To answer the first research question, the financial statements for the three consecutive years 2012–2014 of Kier and
its comparator are analysed. Profitability and efficiency, liquidity and investment ratios are calculated and commented.
Graphs are used to visualize the trends and changes over the period. The analytical instruments SWOT and PESTEL are
used to investigate the factors which shape Kier’s business performance and to answer the second research question.
Finally, on the basis of the results obtained, conclusions are made to answer the third research question. These tasks are
completed with reference to the media, the academic and construction industry literature.
To make this article an impartial piece of academic work, it has to be based on verifiable data. Such data can be of
secondary or primary origin. Secondary data has been originally gathered for purposes other than that of the research it
is utilised for (ACCA, 2011a). Because of this, it has to be selected after a thorough reflection to avoid the inclusion of
manipulative numbers or statements taken out of context. To the contrary, primary data is obtained by the researcher
himself, for example via interviews or questionnaires (ACCA, 2011b). The approach of this paper does not call for
primary data.
The figures used to calculate financial accounting ratios represent secondary data obtained from the financial
reports. Listed companies are obliged to publish additional announcements on major transactions or events (LSE 2010),
which offer additional insight into the company’s affairs. Industry data is obtained from online publications of public
institutions like the Department for Business, Innovation and Skills (BIS) or private sources like the Confederation of
British Industry (CBI).
Financial ratio analysis is useful to assess the quantitative characteristics of the company over time or to compare it
with another company (ACCA, 2012a). An arithmetic relationship is created between numbers in the financial
statements, giving a ratio (Okoye, & Ubaka, 2005). Financial statements provide a flood of numbers, therefore this work
concentrates on the following ratios, which have experienced a dramatic change over the period and show particular
trends:
The Return On Capital Employed (ROCE) comprises the Net Profit Margin (NPM, i.e. Profit Before Interest and Tax
(PBIT) compared to sales) and the Asset Turnover, which shows how much revenue is generated in terms of value of
capital employed, say total assets minus current liabilities (ACCA, 2012b). The Gross Profit Margin (GPM) compares
gross profit (revenue minus cost of sales, CoS) to revenue (ACCA, 2012a). The Inventory Turnover Period (ITP) shows
how long it takes to turn inventory into sales (ACCA, 2012a). The Accounts Receivable Collection Period (ARCP) gives
the number of days the company needs to cash its receivables, whereas Accounts Payable Payment Period (APPP)
enumerates the days taken to pay trade debts (Okoye, & Ubaka, 2005). Short-term liquidity is assessed through the
coverage of current liabilities by current assets, shown by the Current Ratio, respectively the Quick Ratio that excludes
inventory (Delaney, 2003). Long-term liquidity is measured by the Interest Cover, i.e. PBIT available to account for
financial costs (Delaney, 2003). The Price-Earnings Ratio (P/E) shows how much investors are ready to pay for a share to
participate in future earnings distributions (Pyke, 2007). Historical book earnings are used here instead of forecast
earnings (Barker, & Imam, 2005)and the share price at the respective financial year end. Above this, the performance of
both the companies is assessed against the following construction industry ratios. The Capital Expenditure Per
Employee (CEPE) measures the capital input undertaken by the company to increase the productivity of its workforce
(Ive, Gruneberg, Meikle, & Crosthwaite, 2004). The productivity is measured by the Value Added Per Employee
(VAPE), whereas the gross profit is used as a proxy for the value added (Ive et al., 2004). The ratio of foreign to total
sales evaluates the company’s International Diversification (Delaney, 2003).
www.theijbmt.com 22|Page
Kier Group Plc: business and financial performance analysis and evaluation
To enhance the informative value of the analysis the qualitative instruments SWOT and PESTEL are applied. The
SWOT Model shows on which strengths the company has to build on, which weaknesses it has to overcome (internal
factors) as well as which opportunities there exist and which threats there are to guard against (external factors)
(Houben, Lenie, & Vanhoof, 1999). Corporate strategy can be built upon the results obtained to cope with the SWOT
findings (Lu, 2010), for example by matching strengths with opportunities; the entity can also try to convert weaknesses
into strengths and threats into opportunities (ACCA, 2012b).The PESTEL Framework looks upon the entity’s broader
environment. Political, economic, social, technological, environmental and legal backgrounds are analysed and tied to
the company (Gillespie, 2007). Similar to SWOT, it identifies opportunities and threats, albeit on (supra-) national or
industry level (Gupta, 2013). This helps to assess the company’s competitiveness and to locate it in the market
(Isoherannen, 2012). Furthermore, trends in the environmental change can be identified and used in scenario drawing so
that the company can develops different strategic options (Faulkner, & Bowman, 1995).
III. LIMITATIONS
The reliability of accounting data can be limited if the accounts are not audited by a statutory auditor. For the years
concerned Kier and BBY both obtained an unqualified auditor opinion on their financial statements of giving a true and
fair view and being properly prepared in accordance with the IRFS, the UK Accounting Standards and the Companies
Act 2006.
Nevertheless, further limitations arise in several aspects. BBY is larger than Kier (e.g. for 2014 revenue: £8.793m vs.
£2.985,2m, total assets: £5.244m vs. £1.769,5m, employees 39.000 vs. 15.000 etc.). However, the analysis focuses on ratios,
not on absolute numbers. Finally, the financial year end of Kier is on the 30th June, whereas that of BBY is on the 31st
December. To mitigate this issue, the article addresses the significant events between the financial year ends in the
analytical part of the paper.
Financial ratio analysis is subject to several constraints (ACCA, 2012b). These are the lack of comparability due to
different accounting policies used by the reporting entities and the ratios being calculated from outdated financial
statements. The reliance on pre-calculated ratios is dangerous as no general standard of ratio constructing exists.
Moreover, ratios do not provide any ultimate instruction for decision making as there may be other reasons why a
company performs the way it does. Financial statements can be susceptible to earnings management, i.e. the
presentation of purposefully prepared accounts and narratives capable of misleading the addressees (Young, 2005). The
manipulation can take place by false cut-off procedures (Amor, & Warner, 2003), one-time transactions (Schilit, 2010) or
the application of doubtful estimates (Mulford, & Comiskey, 2002) and valuations (Ketz, 2003). Audited financial
statements provide reasonable assurance that the numbers are free from material misstatements (ACCA, 2012c).
The following limitations of the SWOT Model should be noted. It does not provide guidance how to handle the
issues identified (Lu, 2010). Managerial judgement is required to interpret the findings and to assess priorities and
weights, which is highly susceptible to human error or plain subjectivity (Kessler, 2013). Factors identified can change
their position towards the organisation if not addressed properly: opportunities can become threats if not timely
adopted, but used by competitors; strengths can turn into weaknesses if regarded as simply given without further
efforts to maintain them (Kessler, 2013).
The PESTEL Framework is also not free from limitations. Similar to the SWOT Model, the PESTEL framework does
not provide a true path for the development of a business strategy, instead this work still has to be performed by
management (Ho, 2014). It provides a general picture that has to be supplemented by a more detailed analysis of the
entity to be able to gain and maintain a competitive advantage (Gupta, 2013). Moreover, the same PESTEL factors can
belong to more than one category. So interest rates can be policy driven but clearly have economic implications
(Gillespie, 2007). This can cause an unnecessary duplication of efforts when setting up a PESTEL Framework for the
organisation. Due to the fast changing nature of the environment the analysis has to be carried out regularly to stay
reliable (Ho, 2014).
The combination of the ratio analysis with the two analytical models mitigates these limitations by comprising
quantitative with qualitative information and the internal with the external factors.
www.theijbmt.com 23|Page
Kier Group Plc: business and financial performance analysis and evaluation
IV. DISCUSSION AND ANALYSIS
4.1 Return On Capital Employed
Figure 1: Return On Capital Employed (ROCE)
Kier’s ROCE drops by 77,01% from 2012 to 2014, albeit Kier widely outperforms its comparator BBY whose ROCE
crashes by the horrible 268,90%. The decline of Kier’s ROCE is partly caused by the falling NPM (-64,31%) and asset
turnover (-35,59%). All this is taking place against the background of the total sales rising by +45,50%.
4.2 Gross Profit Margin
Figure 2: Revenue & Cost of Sales (CoS)
22.02
9.81
5.066.09
-1.20
-10.29
-15.00
-10.00
-5.00
0.00
5.00
10.00
15.00
20.00
25.00
2012 2013 2014
%
Years
ROCE
Kier
BBY
0
1,000
2,000
3,000
4,000
5,000
6,000
7,000
8,000
9,000
2012 2013 2014
£m
Years
Revenue & CoS
Kier Revenue Kier CoS BBY Revenue BBY CoS
www.theijbmt.com 24|Page
Kier Group Plc: business and financial performance analysis and evaluation
Figure 3: Gross Profit Margin (GPM)
Despite growing sales Kier’s gross profit declines, because Cost of sales (CoS) grow faster than revenue (+48,66% vs
+45,50%) due to higher prices charged by suppliers, sub-contractors, contract write-downs (InsightBee, 2014) and higher
labor costs (Sharman, 2014), which are part of CoS (Kier, 2014). Above this, the increase in revenue of £923,8m in 2012-
2014 is mainly owed to the growth of the service division (+£659,20m), which traces back to the acquisition of May
Gurney in 2013 (Fisenec, 2013). The provision of services is not as input-intensive as construction (Rogers, n.d.). Hence
the falling GPM means that the other two divisions of Kier – construction and property – are operating at rising CoS.
While Kier increases revenue through diversified divisions, BBY derives 78% of its revenue from construction (BBY,
2015). However, sales are from the UK market are still under its pre-crisis value and even continuing to fall in 2013 (BBC
News, 2013). Sales also fall as key building projects are cancelled in Australia following a new crisis in the mining
industry (Wembridge, 2013). The CoS (-6,96%) at BBY do not fall as fast as revenue (-16,08%), indicating that BBY faces
the same input-price increases as Kier does (White, 2013a).
4.3 Net Profit Margin
Figure 4: Net Profit Margin (NPM)
10.45
9.97 8.5111.43
5.81
1.80
0.00
2.00
4.00
6.00
8.00
10.00
12.00
14.00
2012 2013 2014
%
Years
GPM
Kier BBY
3.32
1.81
1.18
1.78
-0.44
-3.87
-5.00
-4.00
-3.00
-2.00
-1.00
0.00
1.00
2.00
3.00
4.00
2012 2013 2014
%
Years
NPM
Kier
BBY
www.theijbmt.com 25|Page
Kier Group Plc: business and financial performance analysis and evaluation
The net profit comes under pressure not only because of the falling gross profit, but also because of the increase in
administrative expenses that are reconciled in Table 1 (Kier, 2012, 2014).
Administrative expenses as of 2012 £152,80m
Restructuring costs £37,70m
Increase of unrecovered overhead costs £5,70m
Adoption of IAS 19 £13,60m
Construction workers compensation scheme £4,50m
Increase of amortisation of intangible assets £7,40m
Balancing figure: further costs (own calculation) £2,30m
Administrative expenses as of 2014 £224,00m
Table 1: Reconciliation of administrative expenses
The costs of £2,30m are partly caused by price increases which hit the construction sector (InsightBee, 2014). This
and the unrecovered overhead costs show that Kier is not able to benefit from economies of scale (i.e. cost reduction per
unit through increased operations, ACCA, 2012b) as publicly claimed after the acquisition of May Gurney (Latchem,
2013). A falling NPM reduces ROCE.
At BBY additional costs occur through penalties and delay expenses as the company has not been able to fulfill its
contractual obligations (Roland, 2014). Over the years, BBY has been bidding for the UK contracts using too optimistic
forecasts, poor cost and project control and has failed to collect its receivables (Quinn, & Magrath, 2015). As a result,
NPM collapses by 317,43%.
4.4 Asset Turnover
Figure 5: Asset Turnover
Kier’s sales growth of +45,50% cannot keep up with the increase in the amount of assets (+53,02%). Kier cannot
effectively use these assets to generate enough sales with the Asset Turnover falling by 35,59%.
The assets partly increase by the goodwill recognized at the acquisition of May Gurney of £194,70m. Kier paid
£222,3m (Pitt, 2014) although May Gurney issued a profit warning in 2012 and was severely criticized by stock analysts
for operative mismanagement (Macalister, 2012). Its FY2013 ended with an operative loss of £51,00m due to unprofitable
environmental contracts (Pitt, 2014). Arguably, Kier has paid too much, so that the post-acquisition revenue cannot
offset the increase in assets.
BBY’s management fails to preserve sales from falling or to access new sources of revenue. So the company
generates less revenue than Kier whose Asset Turnover ranges between 4,27–6,63.
6.63 5.43
4.27
3.42
2.72 2.66
0.00
1.00
2.00
3.00
4.00
5.00
6.00
7.00
2012 2013 2014
%
Years
Asset turnover
Kier
BBY
www.theijbmt.com 26|Page
Kier Group Plc: business and financial performance analysis and evaluation
4.5 Inventory Turnover Period and Accounts Receivable Collection Period
Figure 6: Inventory Turnover Period (ITP)
Figure 7: Accounts Receivable Collection Period (ARCP)
Kier’s total assets also grow up as inventories (+£75,70m) and trade receivables (+£78,20m) increase. Despite of this
increase, ITP and ARCP shorten by 19,83% and 12,09%, respectively. Obviously, Kier successfully speeds up its
production runs and selling schemes (Kier, 2014). This helps to reduce inventory storage and maintenance costs as well
as debt collection costs, improving NPM (ACCA, 2012a). But this positive picture darkens again when accounts payable
are looked at in the following sub-chapter.
4.6 Accounts Payable Payment Period
79 83
64
8 7 9
0
10
20
30
40
50
60
70
80
90
2012 2013 2014
Days
Years
ITP
Kier
BBY
50
44 44
36 40
29
0
10
20
30
40
50
60
2012 2013 2014
Days
Years
ARCP
Kier
BBY
www.theijbmt.com 27|Page
Kier Group Plc: business and financial performance analysis and evaluation
Figure 8: Accounts Payable Payment Period (APPP)
Kier’s Accounts Payable Payment Period (APPP) shorten considerably by 57,91%. Generally, this reduction helps to
avoid costly payment enforcement by suppliers and evidences the usage of early payment discounts, improving
profitability (Retallack, 2014). However, the reduction of APPP can also indicate loss of an important source of short-
term finance, that a supplier’s credit actually is (Miwa, & Ramseyer, 2005).
The proportion of infrastructural projects within the construction division that accounts for 53,84% of total 2014
sales rises to 25%. Infrastructural jobs are paid upon certification of completion. They are not pre-paid, thus causing a
cash shortage during construction (Kier, 2014). Under such circumstances the tightening up of APPP is not a desirable
achievement. Moreover, the overall effect on the operating cycle is negative, as is shown in the next sub-chapter.
4.7 Operating Cycle
Due to the reduction of APPP Kier’s Operating Cycle more than triples from only 20 days in FY2012 to 62 days in
FY2014. This puts Kier under pressure to work more efficiently, i.e. to produce faster, hence reducing the inventory and
its turnover period, though not at cost of quality, and to cash receivables sooner, hence decreasing trade receivables and
freeing up cash (Garcia, 2011).
A glance at BBY shows its ITP growing by 6,24%, which proves that BBY faces troubles to sell (Tovey, & Roland,
2015). However, for BBY it takes 7-9 days to sell, whereas Kier needs 63-84 days. Moreover, BYY needs 29-40 days to
collect, with ARCP shortening by 18,36%, while Kier collects over a period of 44–50 days.
A slight increase of BYY’s APPP of 8,08% to 46 days aligns it to that of Kier. Regarding its overall challenges a
longer APPP provides BBY with cash much needed – the company even cancels its final dividend for FY2014
(Monaghan, 2015).
The overall analysis shows, that high CoS (falling GPM) and administrative expenses (falling NPM) along with
inefficiently managed assets (falling asset turnover and worsening operating cycle) are causative for Kier’s overall
breakdown of ROCE despite the growing sales (KPMG, 2014).
4.8 Current Ratio
109
39
4643 44
46
0
20
40
60
80
100
120
2012 2013 2014
Days
Years
APPP
Kier
BBY
www.theijbmt.com 28|Page
Kier Group Plc: business and financial performance analysis and evaluation
Figure 9: Current Ratio
Whereas total assets at Kier increase, it does not benefit short-term liquidity. The proportion of current liabilities in
relation to current assets grows, thus increasing the risk of running out of cash necessary for the day-to-day operations
(Ronen, 2005). As a consequence, Kier’s Current Ratio deteriorates by 6,32% from 2013 to 2014.
4.9 Quick ratio
,
Figure 10: Quick Ratio
The Quick Ratio of 0,66 remains equal over the period and is a sign that Kier constantly experiences a high need for
cash and equivalents to meet its current liabilities (Company Watch puts warnings, 2014). The ratio is far below 1, the
value accepted for companies with slow moving inventory (ACCA, 2011b).
The Current Ratio and Quick Ratio of BBY grow by 25,09% and 24,86% to 0,99 and 0,92, respectively, and show that
BBY is on the right track to improve its operations (Morby, 2015). It becomes evident that there is much room for
rationalisation at Kier.
4.10 Interest Cover Ratio
1.12 1.18 1.10
0.79
0.95
0.99
0.00
0.20
0.40
0.60
0.80
1.00
1.20
1.40
2012 2013 2014
Times
Years
Current ratio
Kier
BBY
0.66 0.66 0.66
0.74 0.90 0.93
0.00
0.20
0.40
0.60
0.80
1.00
2012 2013 2014
Times
Years
Quick ratio
Kier
BBY
www.theijbmt.com 29|Page
Kier Group Plc: business and financial performance analysis and evaluation
Figure 11: Interest Cover Ratio
Kier’s long-term liquidity is also at risk. Its Interest Cover Ratio collapses by 83,77% from 9,63 to 1,56, with
approximately 2/3 of 2014 PBIT to be spent on financial charges. Everything else being equal, a further decline of PBIT
by 48,07% as occurred 2012-2014 would not leave enough earnings to meet debt contract obligations (Okoye, & Ubaka,
2005) turning a profit into a loss. The fall is caused mainly by interests payable on bank overdrafts and loans that
increased by 125%, on borrowings (+290%) and on finance leases (+2.600%) (Kier, 2012, 2014). The bank overdraft
charges correspond with the findings that the shortened APPP along with increased inventories and receivables place a
burden on Kier. Increased financial lease commitments show that Kier actively manages its monetary resources.
Contrary to bank borrowings leasing often pre-funds 100% of the asset’s price, the upfront payment asked for by banks
can thus be utilized otherwise (Beedkar, 2006). Leasing contracts may contain no covenants and constraints on the
lessee’s future financing obligations, as is often the case with bank loans, which thus may limit the borrower’s operating
flexibility (Nevitt, & Fabozzi, 2000).
Nevertheless, the adverse interest cover can make it difficult for Kier to obtain new debt finance. Instead, it could
rely on retained earnings or issue equity - there are no interests payable on ordinary shares and dividend payments are
subject to annual decision making with regard to the amount or even cancelation of a dividend payment for a particular
year (Lynch, 2009). Therefore, equity finance can prevent interest cover from further deterioration (Parrott, 2011). This
explains why Kier is going to finance its acquisition of Mouchel that has been agreed upon in April 2015 entirely by new
equity (Whitelaw, 2015). But this solution has its cost to Kier: dividend payments are not tax-deductible, whereas
interests are. Because of the tax advantage forgone, equity is regarded an expensive source of capital (Lynch, 2009).
The interest cover of BBY crashes by 224,72% as the company operates at loss since FY2013 letting no earnings
available to account for finance costs (Monaghan, 2015).
4.11 Price-Earnings Ratio
Figure 12: Price - Earnings Ratio
9.63
3.05
1.562.23
-0.42
-3.23
-4.00
-2.00
0.00
2.00
4.00
6.00
8.00
10.00
12.00
2012 2013 2013
Times
Years
Interest Cover
Kier
BBY
8.98
23.35
97.53
53.63
-56.25
-24.24
-80.00
-60.00
-40.00
-20.00
0.00
20.00
40.00
60.00
80.00
100.00
120.00
2012 2013 2014
%
Years
P/E
Kier
BBY
www.theijbmt.com 30|Page
Kier Group Plc: business and financial performance analysis and evaluation
The ratio’s denominator (earnings per share) reduces due to diminishing returns and dilution. The number of
shares grows by 14.7m in 2013 to finance the acquisition of May Gurney and to account for scrip dividends (Kier, 2012,
2013, 2014). The nominator becomes higher given the increase of the year end share price by 41,73% 2012–2014 (LSE,
2015c). Consequently, P/E explodes by 985,79%. It starts with modest 8,98 that can be considered appropriate given the
falling returns (Frecka, 2005). But towards the end of FY2014 it raised to 97,53. This P/E means that investors would
wait over 97 years to get their share price back – clearly not a sound investment decision. P/E is 69,00 if calculated with
2012 number of shares, statistically still a very high value (Shen, 2000). The explanation for such a high P/E are strong
expectations of future earnings that are priced into the market (ACCA, 2012b). Given Kier’s order book of £6,2bn
(Telford, 2014) the investment community regards future earnings growth as low risk, that in turn may justify such a
high P/E (Damodaran, 2004).
BBY ends up with P/E of -24,24 being negative due to its loss per share. Nevertheless, its share price has been
growing since year end 2014, enlarging P/E (LSE, 2015b). This means that investors regard the cost cutting and contract
control efforts undertaken by the management (Dakers, & Tovey, 2015), along with BBY’s order books of £12,7bn (BBY,
2015) and the reference project of the UK-wide construction contract worth £2,9bn (Rubin, 2015) as a reliable and
therefore low risk source of future prosperity (Damodaran, 2004). This makes them undertake further investments in
BBY shares, pushing the share price and P/E upwards.
4.12 Capital Expenditure Per Employee
Figure 13: Capital Expenditure Per Employee (CEPE)
CEPE declines from 2012 to 2013 by 32,30%, as Kier spends money on the acquisition of May Gurney. It improves
by 21,73% in 2014 to £3.143. The ratio depends on the managerial decision on whether to hire sub-contractors that use
their own equipment or to acquire additional capital assets by itself (Barber, & Strack, 2005). Moreover, it does not
consider Kier’s new finance lease obligations, which increases by 911,63% to £87m (Kier, 2012, 2014). If recalculated, the
ratio grows to £5.673,30, almost 1,5 times the UK average of £3.900 (Ive et al., 2004). The comparison can be distorted by
the allocation of assets as finance or operating leasing (Ive et al., 2004). Finance lease expenditure is capitalised, whereas
operating lease costs are charged to the income statement (Lease – operating or finance, 2015). BBY hardly relies on
leasing with finance lease obligations falling by 85,72% (BBY, 2013, 2015). Thus it misses the opportunities provided by
this form of financing.
4.13 Value Added Per Employee
3,814
2,582
3,143
797 964
1,233
0
500
1,000
1,500
2,000
2,500
3,000
3,500
4,000
4,500
2012 2013 2014
£
Years
CEPE
Kier
BBY
www.theijbmt.com 31|Page
Kier Group Plc: business and financial performance analysis and evaluation
Figure 14: Value Added Per Employee (VAPE)
Kier’s productivity ratio VAPE deteriorates by 16,77% to £16.387. It is no surprise given its falling gross profit and
the number of employees growing by 42,29%. Kier is also considerably below market average of £63.800 (UK Industry,
2014). Low workforce productivity is considered a major hindrance of the construction industry (Rojas, &
Aramvaarekul, 2003). This in turn is traced back to low qualification levels (Abdel-Wahab, Dainty, Ison, Bowen,
&Huzlehorst, 2008). This is recognized by Kier that invests in training and employee development programmes to close
the skill gap (Kitching, 2013). The 1.649 employees participating in 2014 (Kier, 2014) represent 10,75% of its total
workforce – almost double the UK average (Abdel-Wahab et al., 2008).
BBY performes worse. Although it started slightly better at £19.770, its VAPE drops by 83,28% to £3.296 in 2014, a
discouraging development as BBY reduces its global employees by 20,77% (BBY, 2013, 2015). BBY tries to enhance its
productivity through labour training, but with only 780 participants in 2014 on a much lesser scale, than Kier (BBY,
2015).
4.14 International Diversification
Figure 15: International Diversification
In foreign markets companies face severe price competition from rivals established there, lack of reliable supply
chains and co-financing sub-contractors, let alone complexities of an alien legal area and troubles with receivables
collection (There’s work abroad, 2012). This makes it difficult to meet the client’s requirements for high quality and safe
construction, completed on time and on budget (Chan, & Chan, 2004). These disadvantages have prevented Kier from
much overseas business, as indicated by its small ratio (2013:2,57; 2014:1,69). However, improvement is to come thanks
to new contracts in the Middle East (Barnard, 2014) and the acquisition of Mouchel that can provide Kier with this
company’s share of Australian highway maintenance business (Paton, 2015). The purchase of market participants can
mitigate the difficulties in entering and mastering foreign markets (Smyth, 1985) as the acquirees are already established
and possess country specific knowledge, networks, supply and distribution channels (Pradhan, &Alakshendra, 2006).
19,690 18,537
16,387
19,711
8,738
3,296
0
5,000
10,000
15,000
20,000
25,000
2012 2013 2014
£
Years
VAPE
Kier
BBY
2.57
1.69
46.37
45.73
97.43
98.31
53.63
54.27
0.00 20.00 40.00 60.00 80.00 100.00
Kier 2013
Kier 2014
Years
BBY 2013
BBY 2014
%
International diversification
Foreign Revenue Domestic revenue
www.theijbmt.com 32|Page
Kier Group Plc: business and financial performance analysis and evaluation
Foreign sales of BBY account for 43,73% of total sales in 2012 due to its long-established role as a global player
(Fickling, 2009).
4.15 SWOT Model
4.15.1 Strengths
4.15.1.1 Diversification
Kier derives competitive advantage through diversification (Porter, 1998). It is diversified among three divisions
(construction, property, residential), whereas each division relies on heterogeneous customers from industrials, military
and aviation (Kier, 2014). Diversification mitigates the overdependence on one or few sources of income (Johnson, &
Scholes 2002), for example the governmental budget on infrastructure that can be subject to spending constraints
(Deloitte, 2013).
4.15.1.2 Strong market share
Kier’s market share of 65 out of 350 British local authorities (18,57%) is a strong basis to build on (White, 2013b). It
shows to other contracting authorities that Kier possesses the necessary experience and knowledge to be awarded with
new projects, as has happened in FY2015 in Staffordshire (£400m) and Northamptonshire (£200m) (O’Beirne, 2014).
4.15.1.3 Specialisation
While diversifying, Kier is also able to focus: it creates “Kier Living” brand for affordable housing pooling its
residential building activities (Morby, 2015). Focussing can be regarded as a genuine strategy by itself to outperform
rivals by specialisation (Betts, & Ofori, 1992). But it also provides Kier with the advantages of the cost leadership
strategy (Warszawski, 1996) as tenure building demands less capital and is of lower risk compared to commercial
building (Kier, 2014).
4.15.1.4 Investment in technology
The company’s CEPE adjusted for finance leasing is strongly above UK average with Kier going to invest further
£30m in IT and back-office infrastructure (Kier, 2014). New technology can help to operate more efficiently and be ahead
of competitors as there is a technology backlog among UK construction industry (Madigan, 1997).
4.15.1.5 Investment in people
Its above-average investment in employee training is key for further productivity growth (Harris, McCaffer, &
Edum-Fotwe, 2013).
4.15.2 Weaknesses
4.15.2.1 Rising input costs
Kier is subject to raising input-prices and labor costs, diminishing its margins (Sharman, 2014). It has to improve its
cost controls (Madigan, 1997) and pay more attention to its supply chain to reduce costs (Harris et al., 2013). It could be
difficult for Kier to preserve the margins through price increases given the harsh competition in the construction market
(KPMG, 2014).
4.15.2.2 Restructuring costs
The acquisition of May Gurney caused significant restructuring expenses. With the acquisition of Mouchel similar
expenses are to be expected. According to the learning curve theory (ACCA, 2011b) Kier should reduce restructuring
costs by learning from experience gained from former acquisitions. Management couching can support the learning
processes (Johnson, & Scholes, 2002).
4.15.2.3 Financial risks
Falling margins and growing finance charges reduce the interest cover to 1,56 with Kier being at risk not to meet its
interest payment obligations. With the lending community heavily relying on this solvency ratio (Jayaram, 2013) Kier
may face difficulties to obtain fresh finance for further growth. The company can mitigate this risk through issuance of
new equity (Marlow, 2014). But (prospective) shareholders can recognise that they are just substituting debt finance that
cannot be obtained elsewhere due to poor performance. Hence, the prospective equity providers may lose confidence
and refrain from acquiring shares (ACCA, 2012d), thus making it more difficult for Kier to find new funds.
4.15.2.4 Overseas operations
Kier derives less than 2% of its turnover from overseas operations. Thus, the company misses opportunity to
participate in new emerging markets and to gain expertise in foreign business, binding itself to the prosperity of its
home UK market (Hillebrandt, & Cannon, 1990).
www.theijbmt.com 33|Page
Kier Group Plc: business and financial performance analysis and evaluation
4.15.3 Opportunities
4.15.3.1 International diversification
Kier can overcome its weakness of low international presence by gaining new overseas contracts and the acquisition
of Mouchel. Especially in infrastructure there is a high demand in developing countries (Fox, & Skitmore, 2002).
4.15.3.2 UK-market recovery
With UK being its main geographical business area the major opportunity for Kier lies in the recovery of the UK
market. Governmental investments in infrastructure improve in 2014, as does the private housing market (Rhodes,
2014).
4.15.3.3 Sustainable construction
Environment protection plays an important role in the construction industry (Ding, 2008). Kier pays attention to
this development through implementing Government’s Corporate Assessment of Environmental, Social and Economic
Responsibility Reporting (CEASER) and disclosing its greenhouse gas emissions (Kier, 2014). Kier could try to cope with
the government’s ambitious Construction 2025 programme to reduce costs, time and emissions that all have an
environmental impact (Rhodes, 2014). The marketing of these achievements would make Kier a preferable constructor
for public projects (DEFRA, 2006) and attract demand by environmentally conscious private customers.
4.15.4 Threats
4.15.4.1 Substitutes
A threat of substitute arises from the increased use of IT as a means of sending information, simplifying private and
business correspondence or holding virtual meetings, thus reducing the need for conventional infrastructure (Madigan,
1997). Diversification into other activities and regions can help to reduce this threat (Hillebrandt, & Cannon, 1990).
4.15.4.2 Slow market recovery
Despite growing investments in infrastructure and private housing the construction sector is still 5,9% below its
pre-crisis value of 2007 (Rhodes, 2014). Such a slow recovery can endanger the company’s growth targets.
4.15.4.3 International Competition
A further threat is increased competition through international construction companies entering the UK market like
the Indian Lodha Group, which is going to invest £3bn in the London real-estate (Mark, 2014). Kier can mitigate this risk
by strengthening its local supply chain (Xiao, & Proverbs, 2003), thus exploiting location-based advantages, which my
be difficult to obtain by a foreign company during its first years in the UK (Porter, 2004).
4.15.4.4 Health & Safety
Construction and related services are labor intensive and involve machines, vehicles and other instruments. Danger
of accidents and human harm arise (Harris et al., 2013). Any non-compliance with health and safety regulations or even
fatal accidents as happened to Kier twice in FY2014 (Kier, 2014) and once in FY2015 (Davis, 2014) can lead to substantial
penalties and other legal charges (IIRSM, 2010). Reputational damage can follow negative publicity resulting in loss of
customers (Beauchamp, n.d.). Kier should adopt human safety as an absolute standard for its further development
(Butcher, & Sheehan, 2009).
4.16 PESTEL Framework
4.16.1 Political factors
4.16.1.1 Public funding
UK politics support the construction industry through governmental funding via numerous infrastructural
programmes in which Kier participates (Kier, 2014). Consumer spending is stimulated through supportive measures like
the Affordable Housing Grant Programme (Kier, 2014). The receivers of grants are the target group of Kier’s “Kier
Living” brand. However, this program has been subject to budget cuts resulting in half the funding per house in 2013-
2015 compared to 2008-2011 (Frontier Economics, 2014). When formulating its strategy for further growth, Kier should
stress the importance of participating in governmental programmes. Even if its funding reduces, the political interest in
infrastructural and housing development is a significant environmental force and source of contracts (Johnson, &
Scholes 2002).
4.16.1.2 Social diversity
Socially diversified neighbourhoods have been a stated goal of UK politics for the long time. The idea is to avoid
social clustering and infrastructural downturn of poorer quarters (Fonseca Feitosa, & Wissmann, 2006). With “Kier
Living” targeting a social mix of tenants Kier adopts this policy. This is a sound strategic move as “Kier Living” projects
will be undertaken in partnership with local political units, say local councils (Kier launches new housing division,
2014).
www.theijbmt.com 34|Page
Kier Group Plc: business and financial performance analysis and evaluation
4.16.2 Economic factors
4.16.2.1 Mortgage interests
Mortgage interest are historically low starting with fix rates at 1,09 p.a. (Jones, 2015). This makes private house
consumption affordable (Carver, 2011). This corresponds with Kier’s focus on residential living through the creation of
“Kier Living” brand.
4.16.2.2 Unemployment
Unemployment being the lowest for seven years can lead to intense competition for qualified staff and increasing
labor costs (Elliott, 2015). Kier has already to deal with cost pressure and a skill gap. Its profit targets and human
resource strategy should consider that these problems could intensify.
4.16.2.3 Exchange rates
The strong British pound that could diminish overseas revenues does not affect Kier due its minor overseas
turnover (Kier, 2014). This could change as Kier works hard to acquire contracts in foreign markets. Its expansion
strategy should consider that in the short term transferring earnings from overseas will go ahead with currency losses
(Duncan, 2015) if not properly hedged against (ACCA, 2012d). On the other hand, construction hardly depends on
importing inputs (8% in contrast to 28% in manufacturing) (LEK, 2009). Thus Kier cannot gain much advantage from
favourable exchange rates, when importing materials to the UK.
4.16.3 Social factors
4.16.3.1 Ageing population
Demography influences constructing and infrastructure in several ways. By 2025, the share of people over 65 in the
UK will be grown by 38% (CBI, 2013), increasing the demand for hospitals, care homes or distinctive housing (BIS, 2013).
Kier should accumulate expertise in offering special accommodation for the elderly (Gillespie, 2007).
4.16.3.2 Migration
Due to estimated annual net migration of 200.000 the UK population will increase, especially in urban areas, thus
creating a pressing demand for housing and transportation, energy supply facilities and public infrastructure (Barrett,
2014). This will present urban planning authorities with new challenges. Furthermore, given its strong focus on tenure
Kier should be able to manage tenancies from different cultural, ethnical and religious background.
4.16.4 Technological factors
4.16.4.1 Research & Development
As a developed European country, the UK has an advanced technological infrastructure. However, technology
usage strongly differ among industries. Construction industry annually invests approximately £22m in relevant
Research & Development (R&D) on a declining scale, whereas other sectors spent £500m on average and undertake
further innovative efforts (BIS, 2013).
4.16.4.2 Soft-Technology
On that background a construction company investing in innovation and technological improvement could bypass
its competitors through the technological leadership strategy (Barney, 2007). It may be argued that innovation in
construction is rather supplier-dominated with construction companies largely depending on the technological progress
on part of the producer of machinery and tools (Johnson, & Scholes 2002). But if technology is not understood as
hardware only, paying attention to soft-technology like managerial processes, operational controls and company culture
(Barney, 2007) than there is room for improvement at the construction sector itself.
4.16.5 Environmental factors
4.16.5.1 Sustainable procurement
The UK experiences a growing demand for environment-friendly facilities (LEK, 2009). This trend is strongly
supported by governmental initiatives and target settings. Furthermore, public services follow sustainable procurement
guidelines thus creating a market for companies able to fulfil the requirements (DEFRA, 2006). Adoption of these
guidelines is key for Kier to secure further governmental contracts.
www.theijbmt.com 35|Page
Kier Group Plc: business and financial performance analysis and evaluation
4.16.5.2 Climate change
The sector faces climate changes (Gillespie, 2007). Infrastructure, energy supply and transportation are all at risk of
whether anomalies (Harvey, 2014). Scenario drawing is therefore important for Kier (Goodie, Austin, & Guthrie, 2009) to
be prepared to increased demand for constructional safety or new requirements for materials used.
4.16.6 Legal factors
4.16.6.1 Legal environment
The British construction industry is regulated by several acts like the Local Democracy, Economic Development and
Construction Act 2011, the UK Health and Safety at Work Act 1974 and the Construction (Design and Management)
Regulations 2007. The legal system offers a great contractual flexibility to the parties to best reflect the economic
relationship chosen (Harris et al., 2013). Legal protection of parties harmed by the breach of contract (Ismail, 2012) can
be obtained through a functioning court system.
4.16.6.2 Legal control
Poor legal project control and non-enforcement of contractual rights can plunge a company into a loss-making
situation, as can be seen from the negative example of BBY. Tough legal control is necessary in the highly fragmented
UK construction industry where about 70 sub-contractors per £25m-project are involved (BIS, 2013). Therefore it is
crucial for Kier’s future strategy not only to create value, but also to ensure that it can benefit from this value through
the enforcement of its contractual rights.
V. CONCLUSION
5.1 Answer to RQ1
Kier is able to generate revenue on a growing scale through acquisition of new businesses and through
diversification, thus differing from its comparator. However, it is challenged by increasing costs that diminish its
margins. Compared to BBY, Kier is slower in turning inventory into sales and collecting its receivables. Therefore, there
is potential to improve the efficiency of operations, especially to utilise its assets in a more efficient way. Kier
experiences a steady shortage of liquidity. This can constitute a financial risk and undermine the cooperation with
lending institutions, thus hindering Kier to acquire fresh capital for new projects. Therefore the company relies on
equity providers believing in its growing revenue and strong order books.
5.2 Answer to RQ2
Kier’s performance is built on its diversified divisions and high market share in public procurement. It invests in
people and IT, thus preparing for the recovery of UK construction market. But tough cost control is needed to master the
strong competition with thin margins. Kier is influenced by the economic environment and the political commitment to
support the construction industry. Its assets and operations are subject to steady technological change and increasing
demand for sustainable construction. Kier faces a growing social diversification among residential customers and has to
be prepared to far-reaching climatic changes effecting its infrastructural engagement.
5.3 Answer to RQ3
Kier should intensify and improve its cost control to safe its margins from deteriorating. It has to use its assets more
efficiently and become more creditworthy for debt capital providers.
The company should strengthen its overseas operations to diversify not only among business fields, but also
geographically. Further investments in technology and human resources are needed to outperform domestic and
international competitors.
References
[1] Abdel-Wahab, M. S., Dainty, A. R. J., Ison, S. G., Bowen, P., & Huzlehorst, G. (2008). Trends of skills and
productivity in the UK construction industry. Engineering, Construction and Architectural Management, 15 (4), pp.
372-382.
[2] Association of Chartered Certified Accountants - ACCA (2011a). Accountant in business. Berkshire: Kaplan
Publishing UK.
www.theijbmt.com 36|Page
Kier Group Plc: business and financial performance analysis and evaluation
[3] Association of Chartered Certified Accountants - ACCA (2011b). Performance management (5th ed.). London: BPP
Learning Media Ltd.
[4] Association of Chartered Certified Accountants - ACCA (2012a). Financial reporting (International and UK stream)
(6th ed.). London: BPP Learning Media Ltd.
[5] Association of Chartered Certified Accountants - ACCA (2012b). Business analysis (6th ed.). London: BPP Learning
Media Ltd.
[6] Association of Chartered Certified Accountants - ACCA (2012c). Audit and assurance (United Kingdom) (6th ed.).
London: BPP Learning Media Ltd.
[7] Association of Chartered Certified Accountants - ACCA (2012d). Financial management (6th ed.). London: BPP
Learning Media Ltd.
[8] Amor, K., & Warner, A. (2003). Uncovering creative accounting. Harlow: Pearson Education Ltd.
[9] Balfour Beatty Plc (2009). 100 years of Balfour Beatty. Retrieved from:
http://www.balfourbeatty.com/files/publications/2008/100_years.pdf
[10] Balfour Beatty Plc (2013). Annual report and accounts 2012. Retrieved from:
http://www.balfourbeatty.com/files/reports/2012/ar2012/ar2012_interactive.pdf
[11] Balfour Beatty Plc (2014). Annual report and accounts 2013. Retrieved from:
http://www.balfourbeatty.com/files/reports/2013/ar2013/ar2013_interactive.pdf
[12] Balfour Beatty Plc (2015). Annual report and accounts 2014. Retrieved from:
http://www.balfourbeatty.com/files/reports/2014/ar2014/ar2014.pdf
[13] Barber, F., & Struck, R. (2005). The surprising economics of a “People Business”. Harvard Business Review.
Retrieved from: https://hbr.org/2005/06/the-surprising-economics-of-a-people-business
[14] Barker, R., & Imam, S. (2005). Earning, dividends and valuation. In: Clubb, C. (ed.) Accounting. The Blackwell
encyclopedia of management (2nd ed.). Oxford: Blackwell Publishing Ltd., pp. 158-161.
[15] Barnard, L. (2014, September 18). UK builder Kier lands £192m in Abu Dhabi contracts. The National. Retrieved
from: http://www.thenational.ae/business/property/20140918/uk-builder-kier-lands-192m-in-abu-dhabi-
contracts
[16] Barney, J. B. (2007). Gaining and sustaining competitive advantage (3rd ed.). New Jersey: Pearson Prentice Hall.
[17] Barrett, D. (2014, February 27). Net migration soars over 200,000 despite David Cameron's pledge. The Daily
Telegraph. Retrieved from: http://www.telegraph.co.uk/news/uknews/immigration/10664667/Net-migration-
soars-over-200000-despite-David-Camerons-pledge.html
[18] BBC News (2013). Balfour Beatty shares fall after profit warning. Retrieved from:
http://www.bbc.com/news/business-22335053
[19] Beauchamp, M. (n. d.). The disadvantages of bad publicity. Retrieved from:
http://yourbusiness.azcentral.com/disadvantages-bad-publicity-3495.html
[20] Beedkar, R. V. (2006). Equipment leasing: Analysis of industry practices emphasizing lessors' risks and returns. Senior
Honors Thesis Eastern Michigan University. Retrieved from:
http://commons.emich.edu/cgi/viewcontent.cgi?article=1062&context=honors
[21] Betts, M., & Ofori, G. (1992). Strategic planning for competitive advantage in construction. Construction
Management and Economics, 10, pp. 511-532.
[22] Bioy, H. (2014). Tracking the FTSE 250: do you know what you're buying?Retrieved from:
http://www.morningstar.co.uk/uk/news/124130/tracking-the-ftse-250-do-you-know-what-youre-buyi ng.aspx
www.theijbmt.com 37|Page
Kier Group Plc: business and financial performance analysis and evaluation
[23] Butcher, D. C. A., & Sheehan, M. J. (2009). Excellent contractor performance in the UK construction industry.
Engineering, Construction and Architectural Management, 17 (1), pp. 35-45.
[24] Carver, R. (2011). Construction shortfall and government intervention in the UK private sector housing market. Working
Paper. Retrieved from: http://papers.ssrn.com/sol3/papers.cfm?abstract_id=1952672
[25] Chan, A. P. C., & Chan, A. P. L. (2004). Key performance indicators for measuring construction success.
Benchmarking: An International Journal, 11 (2), pp. 203-221.
[26] Cho, Y. (2011). The UK housebuilding: an analysis of post-barker structural responses. Working Paper Oxford Brookes
University. Retrieved from: http://oisd.brookes.ac.uk/resources/OISDworkingpaper2Sept2011.pdf
[27] Company Watch puts health warnings on Kier and Galliford Try (2014). Retrieved from:
http://www.theconstructionindex.co.uk/news/view/company-watch-puts-health-warning-on-kier-and-
galliford-try
[28] Confederation of British Industry (CBI) (2013). Building Britain’s future. Retrieved from:
http://www.cbi.org.uk/media/2118883/building_britains_future.pdf
[29] Dakers, M., & Tovey, A. (2015, March 25). Balfour Beatty scraps its dividend for a year after falling into the red.
The Daily Telegraph. Retrieved from:
http://www.telegraph.co.uk/finance/newsbysector/constructionandproperty/11493591/Balfour-Beatty-scraps-
its-dividend-for-a-year-after-falling-into-the-red.html
[30] Damodaran, A. (2004). Investment Fables. New Jersey: Financial Times Prentice Hall.
[31] Datamonitor (2011). Construction and engineering in United Kingdom. Retrieved
from:http://79.170.44.97/cleantechcivils.com/wp-content/uploads/2012/06/Industry-Profile-Civil-
Engineering.pdf
[32] Davis, B. (2014, September 11). Rubbish collections disrupted in Waltham Forest following fatal crash. The
Guardian. Retrieved from: http://www.guardian-
series.co.uk/news/11466577.Rubbish_collections_disrupted_following_fatal_crash/
[33] Delaney, F. (2003). Effectiveness of mergers and acquisitions and corporate financial performance in construction. PhD
Thesis Edinburgh Napier University. Retrieved from:
http://researchrepository.napier.ac.uk/2750/1/DelPhD272595.pdf
[34] Deloitte (2013). EPoC 2012 European Powers of Construction. Retrieved from:
http://www2.deloitte.com/content/dam/Deloitte/de/Documents/real-estate/RE-European-Powers-of-
Construction-2012.pdf
[35] Department for Business, Innovation and Skills (BIS) (2013). UK construction. An economic analysis of the sector.
Retrieved from:
https://www.gov.uk/government/uploads/system/uploads/attachment_data/file/210060/bis-13-958-uk-
construction-an-economic-analysis-of-sector.pdf
[36] Department for Environment, Food and Rural Affairs (DEFRA) (2006). Procuring in the future. Retrieved from:
https://www.gov.uk/government/uploads/system/uploads/attachment_data/file/69417/pb11710-procuring-
the-future-060607.pdf
[37] Ding, G. K. C. (2008). Sustainable construction - the role of environmental assessment tools. Journal of
Environmental Management, 86, pp. 451–464.
[38] Duncan, H. (2015, March 11). Pound's seven-year high against the euro: Families look set for cheaper continental
trips at Easter after Sterling passes 1.40. The Daily Mail. Retrieved from:
http://www.thisismoney.co.uk/money/comment/article-2893696/HUGO-DUNCAN-Roller-coaster-ride-
ahead-sterling-2015-turbulent-two-years-pound-suffer-no-party-wins-majority-general-election.html
[39] Elliot, L. (2015, May 13). UK unemployment falls to seven-year low, but Bank is right to be cautious. The
Guardian. Retrieved from: http://www.theguardian.com/business/2015/may/13/uk-unemployment-falls-
seven-year-low-bank-right-to-be-cautious
www.theijbmt.com 38|Page
Kier Group Plc: business and financial performance analysis and evaluation
[40] Faulkner, D., & Bowman, C. (1995). The essence of competitive strategy. Hemel Hempstead: Prentice Hall
International (UK) Ltd.
[41] Feitosa Fonseca, F. D., & Wissmann, A. (2006). Social-mix policy approaches to urban segregation in Europe and the
United States. Term Paper University of Bonn. Retrieved from:
http://www.zef.de/fileadmin/downloads/forum/docprog/Termpapers/2006_3_Wissmann_Fonseca.pdf
[42] Fickling, D. (2009, August 13). Balfour Beatty aiming for return to global presence. Financial Times. Retrieved
from: http://www.ft.com/intl/cms/s/0/7a098fee-87a0-11de-9280-00144feabdc0.html#axzz3aQneT2J8
[43] Fisenec, J. (2013, September 13). Questor share tip: Construction outlook improves for Kier. The Daily Telegraph.
Retrieved from: http://www.telegraph.co.uk/finance/markets/questor/10305427/Questor-share-tip-
Construction-outlook-improves-for-Kier.html
[44] Fox, P., & Skitmore, M. R. (2002). Key Factors in the Future Development of the Construction Industry. In:
Proceedings Creating a sustainable construction industry in developing countries, Proceedings of the 1st International
Conference of The International Council for Building Research Studies and Documentation (CIB) Working Commission
W107: Construction in Developing Co. Queensland University of Technology, 11-13 November, Stellenbosch, South
Africa, pp. 543-554. Retrieved from: http://eprints.qut.edu.au/4518/1/4518.pdf
[45] Frecka, T. J. (2005). Earnings per share. In: Clubb, C. (ed.) Accounting. The Blackwell encyclopedia of management (2nd
ed.). Oxford: Blackwell Publishing Ltd., pp. 170-173.
[46] Frontier Economics Ltd. (2014). Assessing the social and economic impact of affordable housing investment. Retrieved
from: http://www.frontier-economics.com/documents/2014/09/rpt-affordable-housing-report-2.pdf
[47] Garcia, J. F. L. (2011). The impact of working capital management upon companies’ profitability: evidence from European
companies. Working Paper Porto University. Retrieved from:
http://papers.ssrn.com/sol3/papers.cfm?abstract_id=2165210
[48] Gillespie, A. (2014). Foundations of Economics 3e - additional chapter on business strategy. Oxford: Oxford University
Press. Retrieved from:
http://fdslive.oup.com/www.oup.com/orc/resources/busecon/economics/gillespie_econ3e/student/chapter
/gillespie3e_chapter_businessstrategy.pdf
[49] Goodier, C., Austin, S., & Guthrie, W. (2009), Future scenarios for the European construction industry. In: Dainty,
A. (ed.). Procs 25th Annual ARCOM Conference, Association of Researchers in Construction Management, 7-9
September, Nottingham, UK, pp.1121-1129. Retrieved from: http://www.arcom.ac.uk/-
docs/proceedings/ar2009-1121-1129_Goodier_Austin_and_Guthrie.pdf
[50] Gupta, A. (2013). Environment & PEST analysis: an approach to external business environment. International
Journal of Modern Social Sciences, 2 (1), pp. 34-43. Retrieved from:
http://modernscientificpress.com/Journals/ViewArticle.aspx?YTDXIp8pwb35qABc+2BV/1WJUQnMuLGNSj0
NcUX/H4nrYH2pOUyBFV904kXBzuJV
[51] Harris, F., McCaffer, R., & Edum-Fotwe, F. (2013). Modern construction management (7th ed.). Chichester: John
Wiley & Sons, Ltd.
[52] Harvey, F. (2014, June 1). UK summer flash floods to become more frequent, study shows. The Guardian.
Retrieved from: http://www.theguardian.com/environment/2014/jun/01/uk-summer-flash-floods-climate-
change-study
[53] Hillebrandt, P. M., & Cannon, J. (1990). The modern construction firm. Basingstoke: The Macmillan Press Ltd.
[54] Ho, J. K.-K. (2013). Formulation of a systemic PEST analysis for strategic analysis. European Academic Research, 2
(5), pp. 6478-6492. Retrieved from: http://euacademic.org/UploadArticle/831.pdf
[55] Houben, G., Lenie, K., & Vanhoof, K. (1999). A knowledge-based SWOT-analysis system as an instrument for
strategic planning in small and medium sized enterprises. Decision Support Systems, 26, pp. 125-135. Retrieved
from:
http://intra.tesaf.unipd.it/pettenella/Corsi/ReaserchMethodology/Documents/SWOT_Analysis_Houben_et_a
l.pdf
www.theijbmt.com 39|Page
Kier Group Plc: business and financial performance analysis and evaluation
[56] InsightBee (2014). Kier Group Plc In-depth company report.Retrieved from:
https://www.insightbee.com/norev/sample_reports/company/package/generic/In-
depth%20Company%20Profile.pdf
[57] International Institute for Risk and Safety Management (IIRSM) (2010). £200k penalty for fatal fall at Everton FC.
Retrieved from: http://www.iirsm.org/Resources/IIRSM/Documents/PDF/November%202010.pdf
[58] Ismail, B. (2012). An evaluation of the implementation of Total Quality Management (TQM) within the construction sector
in the United Kingdom and Jordan. PhD Thesis University of Huddersfield. Retrieved from:
http://eprints.hud.ac.uk/14055/1/0666332-LoiyBaniIsmail_FinalThesis.pdf
[59] Isoherannen, V. (2012). Strategy analysis frameworks for strategy orientation and focus. PhD Thesis University of
Oulu. Retrieved from: http://herkules.oulu.fi/isbn9789514297885/isbn9789514297885.pdf
[60] Ive, G., Gruneberg, S., Meikle, J., & Crosthwaite D. (2004). Measuring the competitiveness of the UK construction
industry. Retrieved from: http://discovery.ucl.ac.uk/13153/1/13153.pdf
[61] Jayaram, A. (2013, July 6). Debt traps India Inc as profits fail to cover interest outgo. The Hindu Business Line.
Retrieved from: http://www.thehindubusinessline.com/companies/debt-traps-india-inc-as-profits-fail-to-cover-
interest-outgo/article4889184.ece
[62] Jones, P. (2006). Ove Arup. Masterbuilder of the twentieth century. New Haven: Yale University Press.
[63] Jones, R. (2015, May 1). Fix rate mortgages hit record low as Co-op Bank deal of 1.09% goes on sale. The
Guardian. Retrieved from: http://www.theguardian.com/money/2015/may/01/fixed-rate-mortages-record-
low-co-op-bank-1-09-two-year
[64] Johnson, G., & Scholes, K. (2002). Exploring corporate strategy (6th ed). Harlow: Financial Times Prentice Hall.
[65] Johnson, R. (2014, October 3 ). 700 homes planned for site of two former Derby hospitals in £100m scheme. Derby
Telegraph. Retrieved from: http://www.derbytelegraph.co.uk/700-homes-planned-site-Derby-hospitals-pound-
100m/story-23038118-detail/story.html
[66] Keller Group Plc (2015). Annual report and accounts 2014. Retrieved from:
http://www.keller.co.uk/~/media/Files/K/Keller-V2/storage/pdfs/2014/keller-ara14-130315.pdf
[67] Kessler, E. H. (2013). SWOT analysis framework. In: Kessler, E. H. (ed.). Encyclopedia of management theory.
Thousand Oaks: SAGE Publications, Inc. pp. 813-816. Retrieved from:
http://www.uk.sagepub.com/gray3e/study/chapter3/Encyclopaedia%20entries/SWOT_Analysis_Framework.
pdf
[68] Ketz, J. E. (2003). Hidden Financial Risk. Hoboken: John Wiley & Sons. Inc.
[69] Kier Group Plc (2012). Annual report & accounts 2012. Retrieved from:
http://www.kier.co.uk/~/media/Files/K/Kier/documents/investor-relation/reports-and-presentaions/kier-
annual-report-2012.pdf
[70] Kier Group Plc (2013). Annual report & accounts 2013. Retrieved from:
http://www.kier.co.uk/~/media/Files/K/Kier/documents/investor-relation/reports-and-
presentaions/FINAL%20Kier_2013_Annual%20Report%20updated%2021-10-14.pdf
[71] Kier Group Plc (2014). Annual report 2014. Retrieved from:
http://www.kier.co.uk/~/media/Files/K/Kier/documents/investor-relation/reports-and-presentaions/ar-
2014a/ar2014.pdf
[72] Kier Group Plc (2014). Kier launches new housing division. Retrieved from: http://www.kier.co.uk/press-
office/press-release/2014/14-07-2014a.aspx
[73] Kitching, R. (2013). Construction news awards training initiative of the year. Retrieved from:
http://www.cnplus.co.uk/home/awards/construction-news-awards/construction-news-awards-training-
initiative-of-the-year/8649994.article#.VVk9n0Z5mmU
www.theijbmt.com 40|Page
Kier Group Plc: business and financial performance analysis and evaluation
[74] KPMG (2014). Construction barometer: Recovery in sight? Retrieved from:
http://kpmg.co.uk/creategraphics/09_2014/Construction_Barometer/files/assets/common/downloads/publi
cation.pdf
[75] LEK (2009). Construction in the UK Economy. Retrieved from:
http://www.nasc.org.uk/NASC/files/ea/eabc21b4-91d3-4e44-8f0f-ab27a7a0a4b1.pdf
[76] Latchem, R. (2013). Construction giant Kier takes over May Gurney. Retrieved from:
http://www.mrw.co.uk/news/may-gurney-takeover-by-kier-completed/8650447.article
[77] Lease – operating or finance? (2015). Retrieved from: http://www.accaglobal.com/vn/en/student/exam-
support-resources/fundamentals-exams-study-resources/f7/technical-articles/lease.html
[78] London Stock Exchange (LSE) (2010). A guide to listing on the London Stock Exchange. London: White Page Ltd.
Retrieved from: http://www.londonstockexchange.com/home/guide-to-listing.pdf
[79] London Stock Exchange (2015a). FTSE 250 – Share prices Industry Sector Construction & Materials. Retrieved
from: http://www.londonstockexchange.com/exchange/prices-and-markets/stocks/indices/constituents-
indices.html?index=MCX&industrySector=2350&page=1
[80] London Stock Exchange (2015b). Balfour Beatty Plc – Interactive chart. Retrieved from:
http://www.londonstockexchange.com/exchange/prices-and-markets/stocks/summary/company-summary-
chart.html?fourWayKey=GB0000961622GBGBXSTMM
[81] London Stock Exchange (2015c). Kier Group Plc – Interactive chart. Retrieved from:
http://www.londonstockexchange.com/exchange/prices-and-markets/stocks/summary/company-summary-
chart.html?fourWayKey=GB0004915632GBGBXSTMM
[82] Lu, W. (2010). Improved SWOT approach for conducting strategic planning in the construction industry. Journal
of Construction Engineering and Management, 136 (12), pp. 1317–1328. Retrieved from:
http://www.bre.polyu.edu.hk/BRE_workshop/pdf/COENG-470%20-
%20An%20Improved%20SWOT%20analysis.pdf
[83] Lynch, P. (2009). Optimum capital. Student Accountant, pp. 78-84. Retrieved from:
http://www.accaglobal.com/content/dam/acca/global/PDF-students/2012s/sa_junjul09_lynch.pdf
[84] Macalister, T. (2012, September 6). May Gurney issues profit warning as chief executive departs. The Guardian.
Retrieved from: http://www.theguardian.com/business/2012/sep/06/may-gurney-issues-profit-warning
[85] Madigan, D. (1997). A SWOT analysis of the UK civil engineering industry. Working Paper University of Bath.
Retrieved from: http://www.bath.ac.uk/management/larg_agile/publications/pdf/public/96.014.300.pdf
[86] Mark, L. (2014, September 22). Indian developer sets sights on London with £3bn war chest. Architects Journal.
Retrieved from: http://www.architectsjournal.co.uk/news/indian-developer-sets-sights-on-london-with-3bn-
war-chest/8669962.article
[87] Marlow, B. (2014, December 20). Private equity in bid for Mouchel. The Daily Telegraph. Retrieved from:
http://www.telegraph.co.uk/finance/newsbysector/supportservices/11306077/Private-equity-in-bid-for-
Mouchel.html
[88] Miwa, Y., & Ramseyer, J. M. (2005). Trade credit, bank loan and monitoring: evidence from Japan. Discussion
Paper Harvard University. Retrieved from: http://www.law.harvard.edu/faculty/ramseyer/wptrade.pdf
[89] Monaghan, A. (2015, March 25). Balfour Beatty reports £304m loss and cancels final dividend. The Guardian.
Retrieved from: http://www.theguardian.com/business/2015/mar/25/balfour-beatty-304-million-pound-loss
[90] Morby, A. (2015). Balfour Beatty probe exposes new £70m black hole. Retrieved from:
http://www.constructionenquirer.com/2015/01/22/balfour-beatty-probe-exposes-new-70m-black-hole/
[91] Morby, A. (2015). Kier saves jobs as Southdale Homes collapses. Retrieved from:
http://www.constructionenquirer.com/2015/04/30/kier-saves-jobs-as-southdale-homes-collapses/
www.theijbmt.com 41|Page
Kier Group Plc: business and financial performance analysis and evaluation
[92] Mulford, C. W., & Comiskey, E. E. (2002). The financial numbers game: detecting creative accounting practices.
New York: John Wiley & Sons. Inc.
[93] Nevitt, P. K., & Fabozzi, F. J. (2000). Equipment Leasing (4th ed.). New Hoper: John Wiley & Sons. Inc.
[94] O’Beirne, S. (2014). Kier lands two local authority deals worth £600m. Facilities management Journal. Retrieved
from: http://www.fmj.co.uk/kier-lands-two-local-authority-deals-worth-600m/
[95] Okoye, E., & Ubaka, C. E. (2005). Ratio analysis: a sine qua non for managerial decision. The Nigerian
Accountant, 38 (3), pp. 23-29. Retrieved from: http://papers.ssrn.com/sol3/papers.cfm?abstract_id=1804215
[96] Paton, E. (2015, April 28). Kier confirms Mouchel takeover. Financial Times. Retrieved from:
http://www.ft.com/intl/cms/s/0/c9da10bc-ed6f-11e4-987e-00144feab7de.html#axzz3aQneT2J8
[97] Parrott, W. (2011). Analysing the suitability of financing alternatives. Student Accountant Retrieved
from:http://www.accaglobal.com/content/dam/acca/global/PDF-students/2012s/sa_june11_alternatives.pdf
[98] Pitt, V. (2014). Kier knocks £45m off May Gurney assets. Retrieved from: http://www.building.co.uk/kier-
knocks-%C2%A345m-off-may-gurney-assets/5066871.article
[99] Porter, M. E. (1998). Competitive strategy (1st export ed.). New York: Free Press.
[100] Porter, M. E. (2004). Competitive advantage (1st export ed.). New York: Free Press.
[101] Pradhan, J. P., & Alakshendra, A. (2006). Overseas acquisition versus greenfield foreign investment: Which
internationalization strategy is better for Indian pharmaceutical enterprises? Working Paper Institute for Studies
in Industrial Development. Retrieved from: http://mpra.ub.uni-
muenchen.de/12339/1/MPRA_paper_12339.pdf
[102] Pyke, C. (2007). Interpreting financial statements. Student Accountant, pp. 40-43. Retrieved from:
http://www.accaglobal.com/content/dam/acca/global/PDF-students/2012t/pyke0207.pdf
[103] Quinn, L., & Magrath, D. (2015). KPMG Review, Valuation of Investments Portfolio and Trading Update.
Retrieved from:
http://www.balfourbeatty.com/files/results/2015/trading_update_jan15_presentation.pdf
[104] Retallack, B. (2014). Performance appraisal. Retrieved from: http://www.accaglobal.com/za/en/student/exam-
support-resources/fundamentals-exams-study-resources/f7/technical-articles/performance-appraisal.html
[105] Rhodes, C. (2014). The construction industry: statistics and policy. House of Commons. Retrieved from:
http://researchbriefings.parliament.uk/ResearchBriefing/Summary/SN01432#fullreport
[106] Rogers, K. (n.d.). Direct and indirect COGS in a service industry. Retrieved from:
http://smallbusiness.chron.com/direct-indirect-cogs-service-industry-75032.html
[107] Rojas, E. M., & Aramvareekul, P. (2003). Labor productivity drivers and opportunities
in the construction industry. Journal of Management and Engineering, 19 (2), pp. 78-82.
[108] Roland, D. (2014, March 6). UK troubles batter Balfour Beatty profits. The Daily Telegraph. Retrieved from:
http://www.telegraph.co.uk/finance/newsbysector/supportservices/10680868/UK-troubles-batter-Balfour-
Beatty-profits.html
[109] Ronen, J. (2005). Financial accounting theory and research. In: Clubb, C. (ed.) Accounting. The Blackwell
encyclopedia of management (2nd ed.). Oxford: Blackwell Publishing Ltd., pp. 183-188.
[110] Rubin, D. K. (2015). Balfour Beatty moves on critical review of UK unit bidding and risk management. Retrieved
from: http://enr.construction.com/business_management/companies/2015/0202-balfour-beatty-hires-new-cfo-
as-it-moves-to-reboot.asp
[111] Sharman, A. (2014, September 18). Kier offers hope for UK construction industry as profits rise. Financial Times.
Retrieved from: http://www.ft.com/intl/cms/s/0/bb8c6868-3f08-11e4-a861-00144feabdc0.html#axzz3aQneT2J8
www.theijbmt.com 42|Page
Kier Group Plc: business and financial performance analysis and evaluation
[112] Shen, P. (2000). The P/E ratio and stock market performance. Federal Reserve Bank of Kansas City Economic
Review, pp. 23-36. Retrieved from: https://www.kansascityfed.org/Publicat/econrev/pdf/4q00shen.pdf
[113] Schilit, H. M. (2010). Financial shenanigans: how to detect accounting gimmicks & fraud in financial reports (3rd
ed.). New York: McGraw-Hill.
[114] Smyth, H. (1985). Property companies and the construction industry in Britain. Cambridge: Cambridge
University Press.
[115] Telford, W. (2014, September 24). Plymouth's Kier Group sees profits hit £88m. Plymouth Herald. Retrieved
from: http://www.plymouthherald.co.uk/Plymouth-s-Kier-Group-sees-profits-hit-pound-88m/story-22971555-
detail/story.html
[116] There’s work abroad: What are you waiting for? (2012). Construction Manager. Retrieved from:
http://www.construction-manager.co.uk/agenda/what-are-you-waiting/
[117] Tovey, A., & Roland, D. (2015, January 22). Balfour Beatty unveils further £70m profit shortfall following KPMG
review. The Daily Telegraph. Retrieved from:
http://www.telegraph.co.uk/finance/newsbysector/constructionandproperty/11361882/Balfour-Beatty-
unveils-further-70m-profit-shortfall-following-KPMG-review.html
[118] UK Industry Performance Report 2014 (2014). The Institute of Clerks of Works and Construction Inspectorate of
GB Inc. Retrieved from: http://www.icwgb.org/_files/Documents/F8B059896BE15C816313FBD9FBA2C72C.pdf
[119] Warszawski, A. (1996). Strategic planning in construction companies. Journal of Construction Engineering and
Management, pp. 133-140.
[120] Wembridge, M. (2013, August 14). Balfour Beatty suffers as economic gloom hits construction. Financial Times.
Retrieved from: http://www.ft.com/intl/cms/s/0/96966402-04ce-11e3-9e71-00144feab7de.html#axzz3aQneT2J8
[121] White, G. (2013a, May 1). Questor share tip: Balfour Beatty warning prompts dividend concerns. The Daily
Telegraph. Retrieved from: http://www.telegraph.co.uk/finance/markets/questor/10028639/Questor-share-
tip-Balfour-Beatty-warning-prompts-dividend-concerns.html
[122] White, G. (2013b, July 9). Questor share tip: Kier Group soars as 2014 revenues looks secure. The Daily Telegraph.
Retrieved from: http://www.telegraph.co.uk/finance/markets/questor/10169602/Questor-share-tip-Kier-
Group-soars-as-2014-revenues-looks-secure.html
[123] Whitelaw, J. (2015). Kier to buy Mouchel for £265M cash. Retrieved from: http://www.infrastructure-
intelligence.com/article/apr-2015/kier-buy-mouchel-%C2%A3265m-cash
[124] Xiao, H., & Proverbs, D. (2003). Factors influencing corporate performance: An international investigation.
Engineering, Construction and Architectural Management, 10 (5), pp. 322-332.
[125] Young, S. (2005). Earnings management and corporate governance. In: Clubb, C. (ed.). Accounting. The Blackwell
encyclopedia of management (2nd ed.). Oxford: Blackwell Publishing Ltd., pp. 166-170.

More Related Content

What's hot

DevOps maturity models Knowit and DASA
DevOps maturity models Knowit and DASADevOps maturity models Knowit and DASA
DevOps maturity models Knowit and DASAKari Kakkonen
 
なぜ人は必死でjQueryを捨てようとしているのか
なぜ人は必死でjQueryを捨てようとしているのかなぜ人は必死でjQueryを捨てようとしているのか
なぜ人は必死でjQueryを捨てようとしているのかYoichi Toyota
 
GoとDDDでモバイルオーダープラットフォームを 型安全に作り直した話
GoとDDDでモバイルオーダープラットフォームを 型安全に作り直した話GoとDDDでモバイルオーダープラットフォームを 型安全に作り直した話
GoとDDDでモバイルオーダープラットフォームを 型安全に作り直した話Takuya Kikuchi
 
Python 3のWebシステムでDDDに入門してみた
Python 3のWebシステムでDDDに入門してみたPython 3のWebシステムでDDDに入門してみた
Python 3のWebシステムでDDDに入門してみたHiromu Yakura
 
はじめてのリーンスタートアップ
はじめてのリーンスタートアップはじめてのリーンスタートアップ
はじめてのリーンスタートアップLean Startup Japan LLC
 
大企業アジャイルの勘所(ver1.1) #アジャイルマネジメントセミナー
大企業アジャイルの勘所(ver1.1) #アジャイルマネジメントセミナー大企業アジャイルの勘所(ver1.1) #アジャイルマネジメントセミナー
大企業アジャイルの勘所(ver1.1) #アジャイルマネジメントセミナーItsuki Kuroda
 
プロジェクトマネジメントとは何か
プロジェクトマネジメントとは何かプロジェクトマネジメントとは何か
プロジェクトマネジメントとは何かAya Kaino
 
Introduction To DevOps | Devops Tutorial For Beginners | DevOps Training For ...
Introduction To DevOps | Devops Tutorial For Beginners | DevOps Training For ...Introduction To DevOps | Devops Tutorial For Beginners | DevOps Training For ...
Introduction To DevOps | Devops Tutorial For Beginners | DevOps Training For ...Simplilearn
 
Agile Software Development I: Software crisis (Arabic)
Agile Software Development I: Software crisis (Arabic)Agile Software Development I: Software crisis (Arabic)
Agile Software Development I: Software crisis (Arabic)Sameh Deabes
 
スクラムナイト#4 良いチームとは何か ~チームについて考えてみる夕べ~
スクラムナイト#4 良いチームとは何か ~チームについて考えてみる夕べ~スクラムナイト#4 良いチームとは何か ~チームについて考えてみる夕べ~
スクラムナイト#4 良いチームとは何か ~チームについて考えてみる夕べ~Takahiro Kaihara
 
Node-REDと出会って4年でようやくわかったSwitchノードの重要性
Node-REDと出会って4年でようやくわかったSwitchノードの重要性Node-REDと出会って4年でようやくわかったSwitchノードの重要性
Node-REDと出会って4年でようやくわかったSwitchノードの重要性SmartLight
 
Iocコンテナについて
IocコンテナについてIocコンテナについて
IocコンテナについてAkio Terayama
 
テストコードの DRY と DAMP
テストコードの DRY と DAMPテストコードの DRY と DAMP
テストコードの DRY と DAMPYusuke Kagata
 
第3回Twitter API勉強会 - ストリーミングAPI #twtr_hack
第3回Twitter API勉強会 - ストリーミングAPI #twtr_hack第3回Twitter API勉強会 - ストリーミングAPI #twtr_hack
第3回Twitter API勉強会 - ストリーミングAPI #twtr_hackYusuke Yamamoto
 
Les 8 Meilleures citations autour de la Transformation Digitale
Les 8 Meilleures citations autour de la Transformation DigitaleLes 8 Meilleures citations autour de la Transformation Digitale
Les 8 Meilleures citations autour de la Transformation DigitaleSahar Fekih
 
Dockerの事例紹介
Dockerの事例紹介Dockerの事例紹介
Dockerの事例紹介Hiroki Endo
 
ドローンのフライトコントローラをPythonで制御してみた話
ドローンのフライトコントローラをPythonで制御してみた話ドローンのフライトコントローラをPythonで制御してみた話
ドローンのフライトコントローラをPythonで制御してみた話Lina Katayose
 
「ベンチャー企業のステージ別人事戦略とは?」
「ベンチャー企業のステージ別人事戦略とは?」「ベンチャー企業のステージ別人事戦略とは?」
「ベンチャー企業のステージ別人事戦略とは?」EnFlow株式会社
 

What's hot (20)

DevOps maturity models Knowit and DASA
DevOps maturity models Knowit and DASADevOps maturity models Knowit and DASA
DevOps maturity models Knowit and DASA
 
なぜ人は必死でjQueryを捨てようとしているのか
なぜ人は必死でjQueryを捨てようとしているのかなぜ人は必死でjQueryを捨てようとしているのか
なぜ人は必死でjQueryを捨てようとしているのか
 
GoとDDDでモバイルオーダープラットフォームを 型安全に作り直した話
GoとDDDでモバイルオーダープラットフォームを 型安全に作り直した話GoとDDDでモバイルオーダープラットフォームを 型安全に作り直した話
GoとDDDでモバイルオーダープラットフォームを 型安全に作り直した話
 
Python 3のWebシステムでDDDに入門してみた
Python 3のWebシステムでDDDに入門してみたPython 3のWebシステムでDDDに入門してみた
Python 3のWebシステムでDDDに入門してみた
 
はじめてのリーンスタートアップ
はじめてのリーンスタートアップはじめてのリーンスタートアップ
はじめてのリーンスタートアップ
 
MVVM+Router with Swift
MVVM+Router with SwiftMVVM+Router with Swift
MVVM+Router with Swift
 
大企業アジャイルの勘所(ver1.1) #アジャイルマネジメントセミナー
大企業アジャイルの勘所(ver1.1) #アジャイルマネジメントセミナー大企業アジャイルの勘所(ver1.1) #アジャイルマネジメントセミナー
大企業アジャイルの勘所(ver1.1) #アジャイルマネジメントセミナー
 
プロジェクトマネジメントとは何か
プロジェクトマネジメントとは何かプロジェクトマネジメントとは何か
プロジェクトマネジメントとは何か
 
Introduction to DevOps
Introduction to DevOpsIntroduction to DevOps
Introduction to DevOps
 
Introduction To DevOps | Devops Tutorial For Beginners | DevOps Training For ...
Introduction To DevOps | Devops Tutorial For Beginners | DevOps Training For ...Introduction To DevOps | Devops Tutorial For Beginners | DevOps Training For ...
Introduction To DevOps | Devops Tutorial For Beginners | DevOps Training For ...
 
Agile Software Development I: Software crisis (Arabic)
Agile Software Development I: Software crisis (Arabic)Agile Software Development I: Software crisis (Arabic)
Agile Software Development I: Software crisis (Arabic)
 
スクラムナイト#4 良いチームとは何か ~チームについて考えてみる夕べ~
スクラムナイト#4 良いチームとは何か ~チームについて考えてみる夕べ~スクラムナイト#4 良いチームとは何か ~チームについて考えてみる夕べ~
スクラムナイト#4 良いチームとは何か ~チームについて考えてみる夕べ~
 
Node-REDと出会って4年でようやくわかったSwitchノードの重要性
Node-REDと出会って4年でようやくわかったSwitchノードの重要性Node-REDと出会って4年でようやくわかったSwitchノードの重要性
Node-REDと出会って4年でようやくわかったSwitchノードの重要性
 
Iocコンテナについて
IocコンテナについてIocコンテナについて
Iocコンテナについて
 
テストコードの DRY と DAMP
テストコードの DRY と DAMPテストコードの DRY と DAMP
テストコードの DRY と DAMP
 
第3回Twitter API勉強会 - ストリーミングAPI #twtr_hack
第3回Twitter API勉強会 - ストリーミングAPI #twtr_hack第3回Twitter API勉強会 - ストリーミングAPI #twtr_hack
第3回Twitter API勉強会 - ストリーミングAPI #twtr_hack
 
Les 8 Meilleures citations autour de la Transformation Digitale
Les 8 Meilleures citations autour de la Transformation DigitaleLes 8 Meilleures citations autour de la Transformation Digitale
Les 8 Meilleures citations autour de la Transformation Digitale
 
Dockerの事例紹介
Dockerの事例紹介Dockerの事例紹介
Dockerの事例紹介
 
ドローンのフライトコントローラをPythonで制御してみた話
ドローンのフライトコントローラをPythonで制御してみた話ドローンのフライトコントローラをPythonで制御してみた話
ドローンのフライトコントローラをPythonで制御してみた話
 
「ベンチャー企業のステージ別人事戦略とは?」
「ベンチャー企業のステージ別人事戦略とは?」「ベンチャー企業のステージ別人事戦略とは?」
「ベンチャー企業のステージ別人事戦略とは?」
 

Similar to Kier Group financial analysis

Corporate Reporting Analysis: Cable & Wireless / UK Fixed line
Corporate Reporting Analysis: Cable & Wireless / UK Fixed lineCorporate Reporting Analysis: Cable & Wireless / UK Fixed line
Corporate Reporting Analysis: Cable & Wireless / UK Fixed lineChris Corbishley
 
The Main Costs And Benefits Of The Financial Sector Of Uk
The Main Costs And Benefits Of The Financial Sector Of UkThe Main Costs And Benefits Of The Financial Sector Of Uk
The Main Costs And Benefits Of The Financial Sector Of UkCandice Him
 
Running head FINANCIAL STATEMENT INFORMATION .docx
Running head FINANCIAL STATEMENT INFORMATION                     .docxRunning head FINANCIAL STATEMENT INFORMATION                     .docx
Running head FINANCIAL STATEMENT INFORMATION .docxwlynn1
 
Running head FINANCIAL STATEMENT INFORMATION .docx
Running head FINANCIAL STATEMENT INFORMATION                     .docxRunning head FINANCIAL STATEMENT INFORMATION                     .docx
Running head FINANCIAL STATEMENT INFORMATION .docxjeanettehully
 
2010 Global Location Trends Report
2010 Global Location Trends Report2010 Global Location Trends Report
2010 Global Location Trends Reportvpopovici
 
Assessing the effect of liquidity on profitability of commercial banks in kenya
Assessing the effect of liquidity on profitability of commercial banks in kenyaAssessing the effect of liquidity on profitability of commercial banks in kenya
Assessing the effect of liquidity on profitability of commercial banks in kenyaAlexander Decker
 
Capture Your Share of $14.4 Trillion Embrace the Internet of Everything
Capture Your Share of $14.4 Trillion Embrace the Internet of EverythingCapture Your Share of $14.4 Trillion Embrace the Internet of Everything
Capture Your Share of $14.4 Trillion Embrace the Internet of EverythingJoseph M Bradley
 
Do Initial Public Offerings impact Capital Structure [cm716]
Do Initial Public Offerings impact Capital Structure [cm716]Do Initial Public Offerings impact Capital Structure [cm716]
Do Initial Public Offerings impact Capital Structure [cm716]Charmaine Marimba
 
Microsoft Company Analysis
Microsoft Company AnalysisMicrosoft Company Analysis
Microsoft Company AnalysisJulian Naiken
 
Deloitte, global aerospace industry
Deloitte, global aerospace industryDeloitte, global aerospace industry
Deloitte, global aerospace industryStudsPlanet.com
 
Q4 & FY'09-10 Annual Results
Q4 & FY'09-10 Annual ResultsQ4 & FY'09-10 Annual Results
Q4 & FY'09-10 Annual ResultsInfosys
 
Effect of operating, financial and total leverage on expected stock return an...
Effect of operating, financial and total leverage on expected stock return an...Effect of operating, financial and total leverage on expected stock return an...
Effect of operating, financial and total leverage on expected stock return an...Shoaib Lalani
 
Final LEG project copy
Final LEG project copyFinal LEG project copy
Final LEG project copyEric Nielsen
 
Ratio analysis at il&fs invest smart mba project finance
Ratio analysis at il&fs invest smart mba project financeRatio analysis at il&fs invest smart mba project finance
Ratio analysis at il&fs invest smart mba project financeBabasab Patil
 

Similar to Kier Group financial analysis (20)

Corporate Reporting Analysis: Cable & Wireless / UK Fixed line
Corporate Reporting Analysis: Cable & Wireless / UK Fixed lineCorporate Reporting Analysis: Cable & Wireless / UK Fixed line
Corporate Reporting Analysis: Cable & Wireless / UK Fixed line
 
The Main Costs And Benefits Of The Financial Sector Of Uk
The Main Costs And Benefits Of The Financial Sector Of UkThe Main Costs And Benefits Of The Financial Sector Of Uk
The Main Costs And Benefits Of The Financial Sector Of Uk
 
firm analysis
firm analysisfirm analysis
firm analysis
 
Running head FINANCIAL STATEMENT INFORMATION .docx
Running head FINANCIAL STATEMENT INFORMATION                     .docxRunning head FINANCIAL STATEMENT INFORMATION                     .docx
Running head FINANCIAL STATEMENT INFORMATION .docx
 
Running head FINANCIAL STATEMENT INFORMATION .docx
Running head FINANCIAL STATEMENT INFORMATION                     .docxRunning head FINANCIAL STATEMENT INFORMATION                     .docx
Running head FINANCIAL STATEMENT INFORMATION .docx
 
2010 Global Location Trends Report
2010 Global Location Trends Report2010 Global Location Trends Report
2010 Global Location Trends Report
 
20320140503041
2032014050304120320140503041
20320140503041
 
Key Findings: The Future of Corporate Governance in Capital Markets Following...
Key Findings: The Future of Corporate Governance in Capital Markets Following...Key Findings: The Future of Corporate Governance in Capital Markets Following...
Key Findings: The Future of Corporate Governance in Capital Markets Following...
 
ROTH Fall Conference
ROTH Fall ConferenceROTH Fall Conference
ROTH Fall Conference
 
Corporate responsibility reporting 2011 trends
Corporate responsibility reporting 2011 trendsCorporate responsibility reporting 2011 trends
Corporate responsibility reporting 2011 trends
 
Assessing the effect of liquidity on profitability of commercial banks in kenya
Assessing the effect of liquidity on profitability of commercial banks in kenyaAssessing the effect of liquidity on profitability of commercial banks in kenya
Assessing the effect of liquidity on profitability of commercial banks in kenya
 
Assessing the effect of liquidity on profitability of commercial banks in kenya
Assessing the effect of liquidity on profitability of commercial banks in kenyaAssessing the effect of liquidity on profitability of commercial banks in kenya
Assessing the effect of liquidity on profitability of commercial banks in kenya
 
Capture Your Share of $14.4 Trillion Embrace the Internet of Everything
Capture Your Share of $14.4 Trillion Embrace the Internet of EverythingCapture Your Share of $14.4 Trillion Embrace the Internet of Everything
Capture Your Share of $14.4 Trillion Embrace the Internet of Everything
 
Do Initial Public Offerings impact Capital Structure [cm716]
Do Initial Public Offerings impact Capital Structure [cm716]Do Initial Public Offerings impact Capital Structure [cm716]
Do Initial Public Offerings impact Capital Structure [cm716]
 
Microsoft Company Analysis
Microsoft Company AnalysisMicrosoft Company Analysis
Microsoft Company Analysis
 
Deloitte, global aerospace industry
Deloitte, global aerospace industryDeloitte, global aerospace industry
Deloitte, global aerospace industry
 
Q4 & FY'09-10 Annual Results
Q4 & FY'09-10 Annual ResultsQ4 & FY'09-10 Annual Results
Q4 & FY'09-10 Annual Results
 
Effect of operating, financial and total leverage on expected stock return an...
Effect of operating, financial and total leverage on expected stock return an...Effect of operating, financial and total leverage on expected stock return an...
Effect of operating, financial and total leverage on expected stock return an...
 
Final LEG project copy
Final LEG project copyFinal LEG project copy
Final LEG project copy
 
Ratio analysis at il&fs invest smart mba project finance
Ratio analysis at il&fs invest smart mba project financeRatio analysis at il&fs invest smart mba project finance
Ratio analysis at il&fs invest smart mba project finance
 

More from The International Journal of Business Management and Technology

More from The International Journal of Business Management and Technology (20)

Analysis of Fraud Triangle, Fraud Diamond and Fraud Pentagon Theory to Detect...
Analysis of Fraud Triangle, Fraud Diamond and Fraud Pentagon Theory to Detect...Analysis of Fraud Triangle, Fraud Diamond and Fraud Pentagon Theory to Detect...
Analysis of Fraud Triangle, Fraud Diamond and Fraud Pentagon Theory to Detect...
 
Determining Factors for Staple Food Products Prices in Indonesia Traditional ...
Determining Factors for Staple Food Products Prices in Indonesia Traditional ...Determining Factors for Staple Food Products Prices in Indonesia Traditional ...
Determining Factors for Staple Food Products Prices in Indonesia Traditional ...
 
Airport enterprises management performance evaluation towards innovation and ...
Airport enterprises management performance evaluation towards innovation and ...Airport enterprises management performance evaluation towards innovation and ...
Airport enterprises management performance evaluation towards innovation and ...
 
What is the Intelligence Level Can Increase Employee Performance PT. PLN?
What is the Intelligence Level Can Increase Employee Performance PT. PLN?What is the Intelligence Level Can Increase Employee Performance PT. PLN?
What is the Intelligence Level Can Increase Employee Performance PT. PLN?
 
Effect of Organizational Commitment, Job Satisfaction and Work Insecurity on ...
Effect of Organizational Commitment, Job Satisfaction and Work Insecurity on ...Effect of Organizational Commitment, Job Satisfaction and Work Insecurity on ...
Effect of Organizational Commitment, Job Satisfaction and Work Insecurity on ...
 
Determinant of Organization Effectiveness: Study in Government Organization o...
Determinant of Organization Effectiveness: Study in Government Organization o...Determinant of Organization Effectiveness: Study in Government Organization o...
Determinant of Organization Effectiveness: Study in Government Organization o...
 
Machine Impact in Supply Chain Management
Machine Impact in Supply Chain ManagementMachine Impact in Supply Chain Management
Machine Impact in Supply Chain Management
 
Decomposing Differences in Quantile Portfolio Returns betweenNorth America an...
Decomposing Differences in Quantile Portfolio Returns betweenNorth America an...Decomposing Differences in Quantile Portfolio Returns betweenNorth America an...
Decomposing Differences in Quantile Portfolio Returns betweenNorth America an...
 
An Assessment of theEffectiveness of Monitoring and Evaluation Methods on the...
An Assessment of theEffectiveness of Monitoring and Evaluation Methods on the...An Assessment of theEffectiveness of Monitoring and Evaluation Methods on the...
An Assessment of theEffectiveness of Monitoring and Evaluation Methods on the...
 
Building Trust in Business – A Study of Nigerian IGBO businessman
Building Trust in Business – A Study of Nigerian IGBO businessmanBuilding Trust in Business – A Study of Nigerian IGBO businessman
Building Trust in Business – A Study of Nigerian IGBO businessman
 
The Role of Government Treasurer in State Universities in Tax Compliance
The Role of Government Treasurer in State Universities in Tax ComplianceThe Role of Government Treasurer in State Universities in Tax Compliance
The Role of Government Treasurer in State Universities in Tax Compliance
 
Corporate Governance: A Review of Theoretical and Practical Implications
Corporate Governance: A Review of Theoretical and Practical ImplicationsCorporate Governance: A Review of Theoretical and Practical Implications
Corporate Governance: A Review of Theoretical and Practical Implications
 
Effect of Management Support and Information Technology on Employee’s Empower...
Effect of Management Support and Information Technology on Employee’s Empower...Effect of Management Support and Information Technology on Employee’s Empower...
Effect of Management Support and Information Technology on Employee’s Empower...
 
Projectification of economy in a smaller country: A case from Croatia
Projectification of economy in a smaller country: A case from CroatiaProjectification of economy in a smaller country: A case from Croatia
Projectification of economy in a smaller country: A case from Croatia
 
How Integrated Production Planning and Cross Employee Planning Increases Prod...
How Integrated Production Planning and Cross Employee Planning Increases Prod...How Integrated Production Planning and Cross Employee Planning Increases Prod...
How Integrated Production Planning and Cross Employee Planning Increases Prod...
 
Factors Affecting Customer Satisfaction on Transjakarta Commuter System
Factors Affecting Customer Satisfaction on Transjakarta Commuter SystemFactors Affecting Customer Satisfaction on Transjakarta Commuter System
Factors Affecting Customer Satisfaction on Transjakarta Commuter System
 
Antecedent of Consumer Attitudes Toward Online Shopping in Indonesia
Antecedent of Consumer Attitudes Toward Online Shopping in IndonesiaAntecedent of Consumer Attitudes Toward Online Shopping in Indonesia
Antecedent of Consumer Attitudes Toward Online Shopping in Indonesia
 
Review on the Challenges and Opportunities of Dairy Value Chain Development i...
Review on the Challenges and Opportunities of Dairy Value Chain Development i...Review on the Challenges and Opportunities of Dairy Value Chain Development i...
Review on the Challenges and Opportunities of Dairy Value Chain Development i...
 
Effect of Delivery Service on University Student’s Satisfaction & Reorder Int...
Effect of Delivery Service on University Student’s Satisfaction & Reorder Int...Effect of Delivery Service on University Student’s Satisfaction & Reorder Int...
Effect of Delivery Service on University Student’s Satisfaction & Reorder Int...
 
Internet Use and Academic Performance of the Students
Internet Use and Academic Performance of the StudentsInternet Use and Academic Performance of the Students
Internet Use and Academic Performance of the Students
 

Recently uploaded

Instant Issue Debit Cards - School Designs
Instant Issue Debit Cards - School DesignsInstant Issue Debit Cards - School Designs
Instant Issue Debit Cards - School Designsegoetzinger
 
Log your LOA pain with Pension Lab's brilliant campaign
Log your LOA pain with Pension Lab's brilliant campaignLog your LOA pain with Pension Lab's brilliant campaign
Log your LOA pain with Pension Lab's brilliant campaignHenry Tapper
 
Stock Market Brief Deck for 4/24/24 .pdf
Stock Market Brief Deck for 4/24/24 .pdfStock Market Brief Deck for 4/24/24 .pdf
Stock Market Brief Deck for 4/24/24 .pdfMichael Silva
 
VIP Call Girls Service Begumpet Hyderabad Call +91-8250192130
VIP Call Girls Service Begumpet Hyderabad Call +91-8250192130VIP Call Girls Service Begumpet Hyderabad Call +91-8250192130
VIP Call Girls Service Begumpet Hyderabad Call +91-8250192130Suhani Kapoor
 
call girls in Nand Nagri (DELHI) 🔝 >༒9953330565🔝 genuine Escort Service 🔝✔️✔️
call girls in  Nand Nagri (DELHI) 🔝 >༒9953330565🔝 genuine Escort Service 🔝✔️✔️call girls in  Nand Nagri (DELHI) 🔝 >༒9953330565🔝 genuine Escort Service 🔝✔️✔️
call girls in Nand Nagri (DELHI) 🔝 >༒9953330565🔝 genuine Escort Service 🔝✔️✔️9953056974 Low Rate Call Girls In Saket, Delhi NCR
 
Chapter 2.ppt of macroeconomics by mankiw 9th edition
Chapter 2.ppt of macroeconomics by mankiw 9th editionChapter 2.ppt of macroeconomics by mankiw 9th edition
Chapter 2.ppt of macroeconomics by mankiw 9th editionMuhammadHusnain82237
 
Q3 2024 Earnings Conference Call and Webcast Slides
Q3 2024 Earnings Conference Call and Webcast SlidesQ3 2024 Earnings Conference Call and Webcast Slides
Q3 2024 Earnings Conference Call and Webcast SlidesMarketing847413
 
High Class Call Girls Nashik Maya 7001305949 Independent Escort Service Nashik
High Class Call Girls Nashik Maya 7001305949 Independent Escort Service NashikHigh Class Call Girls Nashik Maya 7001305949 Independent Escort Service Nashik
High Class Call Girls Nashik Maya 7001305949 Independent Escort Service NashikCall Girls in Nagpur High Profile
 
(DIYA) Bhumkar Chowk Call Girls Just Call 7001035870 [ Cash on Delivery ] Pun...
(DIYA) Bhumkar Chowk Call Girls Just Call 7001035870 [ Cash on Delivery ] Pun...(DIYA) Bhumkar Chowk Call Girls Just Call 7001035870 [ Cash on Delivery ] Pun...
(DIYA) Bhumkar Chowk Call Girls Just Call 7001035870 [ Cash on Delivery ] Pun...ranjana rawat
 
How Automation is Driving Efficiency Through the Last Mile of Reporting
How Automation is Driving Efficiency Through the Last Mile of ReportingHow Automation is Driving Efficiency Through the Last Mile of Reporting
How Automation is Driving Efficiency Through the Last Mile of ReportingAggregage
 
letter-from-the-chair-to-the-fca-relating-to-british-steel-pensions-scheme-15...
letter-from-the-chair-to-the-fca-relating-to-british-steel-pensions-scheme-15...letter-from-the-chair-to-the-fca-relating-to-british-steel-pensions-scheme-15...
letter-from-the-chair-to-the-fca-relating-to-british-steel-pensions-scheme-15...Henry Tapper
 
High Class Call Girls Nagpur Grishma Call 7001035870 Meet With Nagpur Escorts
High Class Call Girls Nagpur Grishma Call 7001035870 Meet With Nagpur EscortsHigh Class Call Girls Nagpur Grishma Call 7001035870 Meet With Nagpur Escorts
High Class Call Girls Nagpur Grishma Call 7001035870 Meet With Nagpur Escortsranjana rawat
 
VIP Call Girls Service Dilsukhnagar Hyderabad Call +91-8250192130
VIP Call Girls Service Dilsukhnagar Hyderabad Call +91-8250192130VIP Call Girls Service Dilsukhnagar Hyderabad Call +91-8250192130
VIP Call Girls Service Dilsukhnagar Hyderabad Call +91-8250192130Suhani Kapoor
 
VIP High Class Call Girls Saharanpur Anushka 8250192130 Independent Escort Se...
VIP High Class Call Girls Saharanpur Anushka 8250192130 Independent Escort Se...VIP High Class Call Girls Saharanpur Anushka 8250192130 Independent Escort Se...
VIP High Class Call Girls Saharanpur Anushka 8250192130 Independent Escort Se...Suhani Kapoor
 
Unveiling the Top Chartered Accountants in India and Their Staggering Net Worth
Unveiling the Top Chartered Accountants in India and Their Staggering Net WorthUnveiling the Top Chartered Accountants in India and Their Staggering Net Worth
Unveiling the Top Chartered Accountants in India and Their Staggering Net WorthShaheen Kumar
 
Russian Call Girls In Gtb Nagar (Delhi) 9711199012 💋✔💕😘 Naughty Call Girls Se...
Russian Call Girls In Gtb Nagar (Delhi) 9711199012 💋✔💕😘 Naughty Call Girls Se...Russian Call Girls In Gtb Nagar (Delhi) 9711199012 💋✔💕😘 Naughty Call Girls Se...
Russian Call Girls In Gtb Nagar (Delhi) 9711199012 💋✔💕😘 Naughty Call Girls Se...shivangimorya083
 
BPPG response - Options for Defined Benefit schemes - 19Apr24.pdf
BPPG response - Options for Defined Benefit schemes - 19Apr24.pdfBPPG response - Options for Defined Benefit schemes - 19Apr24.pdf
BPPG response - Options for Defined Benefit schemes - 19Apr24.pdfHenry Tapper
 
Bladex Earnings Call Presentation 1Q2024
Bladex Earnings Call Presentation 1Q2024Bladex Earnings Call Presentation 1Q2024
Bladex Earnings Call Presentation 1Q2024Bladex
 
OAT_RI_Ep19 WeighingTheRisks_Apr24_TheYellowMetal.pptx
OAT_RI_Ep19 WeighingTheRisks_Apr24_TheYellowMetal.pptxOAT_RI_Ep19 WeighingTheRisks_Apr24_TheYellowMetal.pptx
OAT_RI_Ep19 WeighingTheRisks_Apr24_TheYellowMetal.pptxhiddenlevers
 

Recently uploaded (20)

Instant Issue Debit Cards - School Designs
Instant Issue Debit Cards - School DesignsInstant Issue Debit Cards - School Designs
Instant Issue Debit Cards - School Designs
 
Log your LOA pain with Pension Lab's brilliant campaign
Log your LOA pain with Pension Lab's brilliant campaignLog your LOA pain with Pension Lab's brilliant campaign
Log your LOA pain with Pension Lab's brilliant campaign
 
Stock Market Brief Deck for 4/24/24 .pdf
Stock Market Brief Deck for 4/24/24 .pdfStock Market Brief Deck for 4/24/24 .pdf
Stock Market Brief Deck for 4/24/24 .pdf
 
VIP Call Girls Service Begumpet Hyderabad Call +91-8250192130
VIP Call Girls Service Begumpet Hyderabad Call +91-8250192130VIP Call Girls Service Begumpet Hyderabad Call +91-8250192130
VIP Call Girls Service Begumpet Hyderabad Call +91-8250192130
 
call girls in Nand Nagri (DELHI) 🔝 >༒9953330565🔝 genuine Escort Service 🔝✔️✔️
call girls in  Nand Nagri (DELHI) 🔝 >༒9953330565🔝 genuine Escort Service 🔝✔️✔️call girls in  Nand Nagri (DELHI) 🔝 >༒9953330565🔝 genuine Escort Service 🔝✔️✔️
call girls in Nand Nagri (DELHI) 🔝 >༒9953330565🔝 genuine Escort Service 🔝✔️✔️
 
Chapter 2.ppt of macroeconomics by mankiw 9th edition
Chapter 2.ppt of macroeconomics by mankiw 9th editionChapter 2.ppt of macroeconomics by mankiw 9th edition
Chapter 2.ppt of macroeconomics by mankiw 9th edition
 
Q3 2024 Earnings Conference Call and Webcast Slides
Q3 2024 Earnings Conference Call and Webcast SlidesQ3 2024 Earnings Conference Call and Webcast Slides
Q3 2024 Earnings Conference Call and Webcast Slides
 
High Class Call Girls Nashik Maya 7001305949 Independent Escort Service Nashik
High Class Call Girls Nashik Maya 7001305949 Independent Escort Service NashikHigh Class Call Girls Nashik Maya 7001305949 Independent Escort Service Nashik
High Class Call Girls Nashik Maya 7001305949 Independent Escort Service Nashik
 
(DIYA) Bhumkar Chowk Call Girls Just Call 7001035870 [ Cash on Delivery ] Pun...
(DIYA) Bhumkar Chowk Call Girls Just Call 7001035870 [ Cash on Delivery ] Pun...(DIYA) Bhumkar Chowk Call Girls Just Call 7001035870 [ Cash on Delivery ] Pun...
(DIYA) Bhumkar Chowk Call Girls Just Call 7001035870 [ Cash on Delivery ] Pun...
 
How Automation is Driving Efficiency Through the Last Mile of Reporting
How Automation is Driving Efficiency Through the Last Mile of ReportingHow Automation is Driving Efficiency Through the Last Mile of Reporting
How Automation is Driving Efficiency Through the Last Mile of Reporting
 
letter-from-the-chair-to-the-fca-relating-to-british-steel-pensions-scheme-15...
letter-from-the-chair-to-the-fca-relating-to-british-steel-pensions-scheme-15...letter-from-the-chair-to-the-fca-relating-to-british-steel-pensions-scheme-15...
letter-from-the-chair-to-the-fca-relating-to-british-steel-pensions-scheme-15...
 
High Class Call Girls Nagpur Grishma Call 7001035870 Meet With Nagpur Escorts
High Class Call Girls Nagpur Grishma Call 7001035870 Meet With Nagpur EscortsHigh Class Call Girls Nagpur Grishma Call 7001035870 Meet With Nagpur Escorts
High Class Call Girls Nagpur Grishma Call 7001035870 Meet With Nagpur Escorts
 
VIP Call Girls Service Dilsukhnagar Hyderabad Call +91-8250192130
VIP Call Girls Service Dilsukhnagar Hyderabad Call +91-8250192130VIP Call Girls Service Dilsukhnagar Hyderabad Call +91-8250192130
VIP Call Girls Service Dilsukhnagar Hyderabad Call +91-8250192130
 
VIP High Class Call Girls Saharanpur Anushka 8250192130 Independent Escort Se...
VIP High Class Call Girls Saharanpur Anushka 8250192130 Independent Escort Se...VIP High Class Call Girls Saharanpur Anushka 8250192130 Independent Escort Se...
VIP High Class Call Girls Saharanpur Anushka 8250192130 Independent Escort Se...
 
Commercial Bank Economic Capsule - April 2024
Commercial Bank Economic Capsule - April 2024Commercial Bank Economic Capsule - April 2024
Commercial Bank Economic Capsule - April 2024
 
Unveiling the Top Chartered Accountants in India and Their Staggering Net Worth
Unveiling the Top Chartered Accountants in India and Their Staggering Net WorthUnveiling the Top Chartered Accountants in India and Their Staggering Net Worth
Unveiling the Top Chartered Accountants in India and Their Staggering Net Worth
 
Russian Call Girls In Gtb Nagar (Delhi) 9711199012 💋✔💕😘 Naughty Call Girls Se...
Russian Call Girls In Gtb Nagar (Delhi) 9711199012 💋✔💕😘 Naughty Call Girls Se...Russian Call Girls In Gtb Nagar (Delhi) 9711199012 💋✔💕😘 Naughty Call Girls Se...
Russian Call Girls In Gtb Nagar (Delhi) 9711199012 💋✔💕😘 Naughty Call Girls Se...
 
BPPG response - Options for Defined Benefit schemes - 19Apr24.pdf
BPPG response - Options for Defined Benefit schemes - 19Apr24.pdfBPPG response - Options for Defined Benefit schemes - 19Apr24.pdf
BPPG response - Options for Defined Benefit schemes - 19Apr24.pdf
 
Bladex Earnings Call Presentation 1Q2024
Bladex Earnings Call Presentation 1Q2024Bladex Earnings Call Presentation 1Q2024
Bladex Earnings Call Presentation 1Q2024
 
OAT_RI_Ep19 WeighingTheRisks_Apr24_TheYellowMetal.pptx
OAT_RI_Ep19 WeighingTheRisks_Apr24_TheYellowMetal.pptxOAT_RI_Ep19 WeighingTheRisks_Apr24_TheYellowMetal.pptx
OAT_RI_Ep19 WeighingTheRisks_Apr24_TheYellowMetal.pptx
 

Kier Group financial analysis

  • 1. www.theijbmt.com 20|Page The International Journal of Business Management and Technology, Volume 2 Issue 6 November-December 2018 ISSN: 2581-3889 Research Article Open Access Kier Group Plc: business and financial performance analysis and evaluation Paul Eisenberg*1 1 The University of Portsmouth Business School, Portland St, Portsmouth PO1 3DE, United Kingdom Abstract The subject matter of this paper is the analysis and evaluation of the business and financial performance of the Kier Group Plc over the three year period 2012–2014. The company is analysed against the comparator undertaking Balfour Beatty Plc and the average numbers of the UK and international construction industry. The financial analysis is performed over the range of financial ratios commonly applied in undergraduate and graduate business studies. For the purposes of the business analysis, the SWOT Model and the PESTEL Framework are used. The research reveals that due to diversified divisions and a high market share the Kier Group Plc is able to generate growing revenues, albeit at the high administrative costs and with an extending operating cycle. Further, revenue growth is not accompanied by improved liquidity. The growing social diversification among residential customers, the steady technological change and the increasing demand for sustainable construction place additional challenges to the Group. The results obtained are of interest for the construction industry researchers, financial analysts and financial and business analysis students. Keywords: Financial Ratio Analysis, SWOT Model, PESTEL Framework I. INTRODUCTION The Kier Group Plc (in the following: Kier) engages in construction work, ranging from residential buildings over commercial and public sector constructing to infrastructural projects, and provides related services (Kier, 2014). The business is essential for the fundamental human demand for housing and for commercial and public real estate. After the construction work is completed, new jobs are created in the communities involved, as is the case with Derby, UK, where Kier builds a business park in place of a closed hospital (Johnson, 2014). Hence, the far-reaching impact on its environment makes the analysis of this company worthwhile. Kier was founded in 1928 (Jones, 2006) and since has grown consistently to form a FTSE250 group. It is widely diversified across competencies, customers and regions (Cho, 2011). Its client base includes defence and education, power and transportation and other industries. The UK, the Caribbean area, the Middle East and Hong Kong are the main regions of its operations (Kier, 2014). With 60 out of the UK’s 350 local authorities it has an impressive record of governmental contracting. The 60 communities account for over 17% of the local public market (Kier, 2014). In terms of sales, Kier takes 23rd place amongst European constructing companies (Deloitte, 2013) and fourth place in the UK (BIS, 2013), which makes it one of the leading players in the field (Datamonitor, 2011). Currently, the group employs over 15,000 persons around the globe (Kier, 2014). With Kier being a listed company, the comparator chosen is also an entity listed in the FTSE250 index to enhance comparability. The FTSE250 is composed of companies in terms of market capitalisation (Bioy, 2014). The same financial reporting and auditing standards are applied to the companies (LSE, 2010). Furthermore, the listing on the same stock exchange makes the transition of numbers to a single currency unnecessary. Besides Kier there are only two companies in FTSE250 sector Construction & Materials, namely Balfour Beatty Plc (in the following: BBY) and Keller Group Plc (in the following: Keller) (LSE, 2015a). Keller engages in ground work / piling systems (Keller, 2015) which is different to the business of Kier. By contrast, BBY operates in building and infrastructure markets (BBY, 2015), as does Kier. Furthermore, Kier and BBY entered a refurbishing and constructing joint venture (JV) in 2013 (Kier, 2013). Hence, BBY is chosen as a comparator company.
  • 2. www.theijbmt.com 21|Page Kier Group Plc: business and financial performance analysis and evaluation Founded in 1909, BBY has engaged in overseas constructing operations since 1924, starting with Nairobi and Kenia (BBY, 2009), with now more than 39,000 workers currently employed in building and engineering, utility services and infrastructural projects in over 80 countries (BBY, 2015). The Hong Kong Airport development (BBY, 2009) and the facilities services for the Olympic Park, London (BBY, 2013) give an impression of its world-class scale of operations (BBY, 2009). BBY is the seventh strongest European constructing company (Deloitte, 2013) and the strongest in the UK in terms of sales (BIS, 2013). This paper aims to meet the following objectives: (1) To scrutiny the financial performance of Kier over the three year period of 2012–2014 in comparison to BBY and the UK construction industry using ratio analysis. (2) To evaluate the internal and external factors impacting on Kier’s business performance through the SWOT Model and the PESTEL Framework. (3) To provide the conclusion about the financial position and the commercial progress of Kier. The research questions (RQ) it seeks to answer are: RQ1. What is the financial standing of Kier according to its financial reports compared to BBY? RQ2. Which micro and macro aspects affect Kier’s business performance? RQ3. What can be done by Kier to improve its financial standing and to secure further business growth? II. METHODOLOGY To answer the first research question, the financial statements for the three consecutive years 2012–2014 of Kier and its comparator are analysed. Profitability and efficiency, liquidity and investment ratios are calculated and commented. Graphs are used to visualize the trends and changes over the period. The analytical instruments SWOT and PESTEL are used to investigate the factors which shape Kier’s business performance and to answer the second research question. Finally, on the basis of the results obtained, conclusions are made to answer the third research question. These tasks are completed with reference to the media, the academic and construction industry literature. To make this article an impartial piece of academic work, it has to be based on verifiable data. Such data can be of secondary or primary origin. Secondary data has been originally gathered for purposes other than that of the research it is utilised for (ACCA, 2011a). Because of this, it has to be selected after a thorough reflection to avoid the inclusion of manipulative numbers or statements taken out of context. To the contrary, primary data is obtained by the researcher himself, for example via interviews or questionnaires (ACCA, 2011b). The approach of this paper does not call for primary data. The figures used to calculate financial accounting ratios represent secondary data obtained from the financial reports. Listed companies are obliged to publish additional announcements on major transactions or events (LSE 2010), which offer additional insight into the company’s affairs. Industry data is obtained from online publications of public institutions like the Department for Business, Innovation and Skills (BIS) or private sources like the Confederation of British Industry (CBI). Financial ratio analysis is useful to assess the quantitative characteristics of the company over time or to compare it with another company (ACCA, 2012a). An arithmetic relationship is created between numbers in the financial statements, giving a ratio (Okoye, & Ubaka, 2005). Financial statements provide a flood of numbers, therefore this work concentrates on the following ratios, which have experienced a dramatic change over the period and show particular trends: The Return On Capital Employed (ROCE) comprises the Net Profit Margin (NPM, i.e. Profit Before Interest and Tax (PBIT) compared to sales) and the Asset Turnover, which shows how much revenue is generated in terms of value of capital employed, say total assets minus current liabilities (ACCA, 2012b). The Gross Profit Margin (GPM) compares gross profit (revenue minus cost of sales, CoS) to revenue (ACCA, 2012a). The Inventory Turnover Period (ITP) shows how long it takes to turn inventory into sales (ACCA, 2012a). The Accounts Receivable Collection Period (ARCP) gives the number of days the company needs to cash its receivables, whereas Accounts Payable Payment Period (APPP) enumerates the days taken to pay trade debts (Okoye, & Ubaka, 2005). Short-term liquidity is assessed through the coverage of current liabilities by current assets, shown by the Current Ratio, respectively the Quick Ratio that excludes inventory (Delaney, 2003). Long-term liquidity is measured by the Interest Cover, i.e. PBIT available to account for financial costs (Delaney, 2003). The Price-Earnings Ratio (P/E) shows how much investors are ready to pay for a share to participate in future earnings distributions (Pyke, 2007). Historical book earnings are used here instead of forecast earnings (Barker, & Imam, 2005)and the share price at the respective financial year end. Above this, the performance of both the companies is assessed against the following construction industry ratios. The Capital Expenditure Per Employee (CEPE) measures the capital input undertaken by the company to increase the productivity of its workforce (Ive, Gruneberg, Meikle, & Crosthwaite, 2004). The productivity is measured by the Value Added Per Employee (VAPE), whereas the gross profit is used as a proxy for the value added (Ive et al., 2004). The ratio of foreign to total sales evaluates the company’s International Diversification (Delaney, 2003).
  • 3. www.theijbmt.com 22|Page Kier Group Plc: business and financial performance analysis and evaluation To enhance the informative value of the analysis the qualitative instruments SWOT and PESTEL are applied. The SWOT Model shows on which strengths the company has to build on, which weaknesses it has to overcome (internal factors) as well as which opportunities there exist and which threats there are to guard against (external factors) (Houben, Lenie, & Vanhoof, 1999). Corporate strategy can be built upon the results obtained to cope with the SWOT findings (Lu, 2010), for example by matching strengths with opportunities; the entity can also try to convert weaknesses into strengths and threats into opportunities (ACCA, 2012b).The PESTEL Framework looks upon the entity’s broader environment. Political, economic, social, technological, environmental and legal backgrounds are analysed and tied to the company (Gillespie, 2007). Similar to SWOT, it identifies opportunities and threats, albeit on (supra-) national or industry level (Gupta, 2013). This helps to assess the company’s competitiveness and to locate it in the market (Isoherannen, 2012). Furthermore, trends in the environmental change can be identified and used in scenario drawing so that the company can develops different strategic options (Faulkner, & Bowman, 1995). III. LIMITATIONS The reliability of accounting data can be limited if the accounts are not audited by a statutory auditor. For the years concerned Kier and BBY both obtained an unqualified auditor opinion on their financial statements of giving a true and fair view and being properly prepared in accordance with the IRFS, the UK Accounting Standards and the Companies Act 2006. Nevertheless, further limitations arise in several aspects. BBY is larger than Kier (e.g. for 2014 revenue: £8.793m vs. £2.985,2m, total assets: £5.244m vs. £1.769,5m, employees 39.000 vs. 15.000 etc.). However, the analysis focuses on ratios, not on absolute numbers. Finally, the financial year end of Kier is on the 30th June, whereas that of BBY is on the 31st December. To mitigate this issue, the article addresses the significant events between the financial year ends in the analytical part of the paper. Financial ratio analysis is subject to several constraints (ACCA, 2012b). These are the lack of comparability due to different accounting policies used by the reporting entities and the ratios being calculated from outdated financial statements. The reliance on pre-calculated ratios is dangerous as no general standard of ratio constructing exists. Moreover, ratios do not provide any ultimate instruction for decision making as there may be other reasons why a company performs the way it does. Financial statements can be susceptible to earnings management, i.e. the presentation of purposefully prepared accounts and narratives capable of misleading the addressees (Young, 2005). The manipulation can take place by false cut-off procedures (Amor, & Warner, 2003), one-time transactions (Schilit, 2010) or the application of doubtful estimates (Mulford, & Comiskey, 2002) and valuations (Ketz, 2003). Audited financial statements provide reasonable assurance that the numbers are free from material misstatements (ACCA, 2012c). The following limitations of the SWOT Model should be noted. It does not provide guidance how to handle the issues identified (Lu, 2010). Managerial judgement is required to interpret the findings and to assess priorities and weights, which is highly susceptible to human error or plain subjectivity (Kessler, 2013). Factors identified can change their position towards the organisation if not addressed properly: opportunities can become threats if not timely adopted, but used by competitors; strengths can turn into weaknesses if regarded as simply given without further efforts to maintain them (Kessler, 2013). The PESTEL Framework is also not free from limitations. Similar to the SWOT Model, the PESTEL framework does not provide a true path for the development of a business strategy, instead this work still has to be performed by management (Ho, 2014). It provides a general picture that has to be supplemented by a more detailed analysis of the entity to be able to gain and maintain a competitive advantage (Gupta, 2013). Moreover, the same PESTEL factors can belong to more than one category. So interest rates can be policy driven but clearly have economic implications (Gillespie, 2007). This can cause an unnecessary duplication of efforts when setting up a PESTEL Framework for the organisation. Due to the fast changing nature of the environment the analysis has to be carried out regularly to stay reliable (Ho, 2014). The combination of the ratio analysis with the two analytical models mitigates these limitations by comprising quantitative with qualitative information and the internal with the external factors.
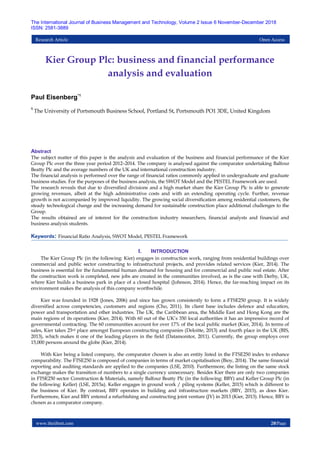
  • 4. www.theijbmt.com 23|Page Kier Group Plc: business and financial performance analysis and evaluation IV. DISCUSSION AND ANALYSIS 4.1 Return On Capital Employed Figure 1: Return On Capital Employed (ROCE) Kier’s ROCE drops by 77,01% from 2012 to 2014, albeit Kier widely outperforms its comparator BBY whose ROCE crashes by the horrible 268,90%. The decline of Kier’s ROCE is partly caused by the falling NPM (-64,31%) and asset turnover (-35,59%). All this is taking place against the background of the total sales rising by +45,50%. 4.2 Gross Profit Margin Figure 2: Revenue & Cost of Sales (CoS) 22.02 9.81 5.066.09 -1.20 -10.29 -15.00 -10.00 -5.00 0.00 5.00 10.00 15.00 20.00 25.00 2012 2013 2014 % Years ROCE Kier BBY 0 1,000 2,000 3,000 4,000 5,000 6,000 7,000 8,000 9,000 2012 2013 2014 £m Years Revenue & CoS Kier Revenue Kier CoS BBY Revenue BBY CoS
  • 5. www.theijbmt.com 24|Page Kier Group Plc: business and financial performance analysis and evaluation Figure 3: Gross Profit Margin (GPM) Despite growing sales Kier’s gross profit declines, because Cost of sales (CoS) grow faster than revenue (+48,66% vs +45,50%) due to higher prices charged by suppliers, sub-contractors, contract write-downs (InsightBee, 2014) and higher labor costs (Sharman, 2014), which are part of CoS (Kier, 2014). Above this, the increase in revenue of £923,8m in 2012- 2014 is mainly owed to the growth of the service division (+£659,20m), which traces back to the acquisition of May Gurney in 2013 (Fisenec, 2013). The provision of services is not as input-intensive as construction (Rogers, n.d.). Hence the falling GPM means that the other two divisions of Kier – construction and property – are operating at rising CoS. While Kier increases revenue through diversified divisions, BBY derives 78% of its revenue from construction (BBY, 2015). However, sales are from the UK market are still under its pre-crisis value and even continuing to fall in 2013 (BBC News, 2013). Sales also fall as key building projects are cancelled in Australia following a new crisis in the mining industry (Wembridge, 2013). The CoS (-6,96%) at BBY do not fall as fast as revenue (-16,08%), indicating that BBY faces the same input-price increases as Kier does (White, 2013a). 4.3 Net Profit Margin Figure 4: Net Profit Margin (NPM) 10.45 9.97 8.5111.43 5.81 1.80 0.00 2.00 4.00 6.00 8.00 10.00 12.00 14.00 2012 2013 2014 % Years GPM Kier BBY 3.32 1.81 1.18 1.78 -0.44 -3.87 -5.00 -4.00 -3.00 -2.00 -1.00 0.00 1.00 2.00 3.00 4.00 2012 2013 2014 % Years NPM Kier BBY
  • 6. www.theijbmt.com 25|Page Kier Group Plc: business and financial performance analysis and evaluation The net profit comes under pressure not only because of the falling gross profit, but also because of the increase in administrative expenses that are reconciled in Table 1 (Kier, 2012, 2014). Administrative expenses as of 2012 £152,80m Restructuring costs £37,70m Increase of unrecovered overhead costs £5,70m Adoption of IAS 19 £13,60m Construction workers compensation scheme £4,50m Increase of amortisation of intangible assets £7,40m Balancing figure: further costs (own calculation) £2,30m Administrative expenses as of 2014 £224,00m Table 1: Reconciliation of administrative expenses The costs of £2,30m are partly caused by price increases which hit the construction sector (InsightBee, 2014). This and the unrecovered overhead costs show that Kier is not able to benefit from economies of scale (i.e. cost reduction per unit through increased operations, ACCA, 2012b) as publicly claimed after the acquisition of May Gurney (Latchem, 2013). A falling NPM reduces ROCE. At BBY additional costs occur through penalties and delay expenses as the company has not been able to fulfill its contractual obligations (Roland, 2014). Over the years, BBY has been bidding for the UK contracts using too optimistic forecasts, poor cost and project control and has failed to collect its receivables (Quinn, & Magrath, 2015). As a result, NPM collapses by 317,43%. 4.4 Asset Turnover Figure 5: Asset Turnover Kier’s sales growth of +45,50% cannot keep up with the increase in the amount of assets (+53,02%). Kier cannot effectively use these assets to generate enough sales with the Asset Turnover falling by 35,59%. The assets partly increase by the goodwill recognized at the acquisition of May Gurney of £194,70m. Kier paid £222,3m (Pitt, 2014) although May Gurney issued a profit warning in 2012 and was severely criticized by stock analysts for operative mismanagement (Macalister, 2012). Its FY2013 ended with an operative loss of £51,00m due to unprofitable environmental contracts (Pitt, 2014). Arguably, Kier has paid too much, so that the post-acquisition revenue cannot offset the increase in assets. BBY’s management fails to preserve sales from falling or to access new sources of revenue. So the company generates less revenue than Kier whose Asset Turnover ranges between 4,27–6,63. 6.63 5.43 4.27 3.42 2.72 2.66 0.00 1.00 2.00 3.00 4.00 5.00 6.00 7.00 2012 2013 2014 % Years Asset turnover Kier BBY
  • 7. www.theijbmt.com 26|Page Kier Group Plc: business and financial performance analysis and evaluation 4.5 Inventory Turnover Period and Accounts Receivable Collection Period Figure 6: Inventory Turnover Period (ITP) Figure 7: Accounts Receivable Collection Period (ARCP) Kier’s total assets also grow up as inventories (+£75,70m) and trade receivables (+£78,20m) increase. Despite of this increase, ITP and ARCP shorten by 19,83% and 12,09%, respectively. Obviously, Kier successfully speeds up its production runs and selling schemes (Kier, 2014). This helps to reduce inventory storage and maintenance costs as well as debt collection costs, improving NPM (ACCA, 2012a). But this positive picture darkens again when accounts payable are looked at in the following sub-chapter. 4.6 Accounts Payable Payment Period 79 83 64 8 7 9 0 10 20 30 40 50 60 70 80 90 2012 2013 2014 Days Years ITP Kier BBY 50 44 44 36 40 29 0 10 20 30 40 50 60 2012 2013 2014 Days Years ARCP Kier BBY
  • 8. www.theijbmt.com 27|Page Kier Group Plc: business and financial performance analysis and evaluation Figure 8: Accounts Payable Payment Period (APPP) Kier’s Accounts Payable Payment Period (APPP) shorten considerably by 57,91%. Generally, this reduction helps to avoid costly payment enforcement by suppliers and evidences the usage of early payment discounts, improving profitability (Retallack, 2014). However, the reduction of APPP can also indicate loss of an important source of short- term finance, that a supplier’s credit actually is (Miwa, & Ramseyer, 2005). The proportion of infrastructural projects within the construction division that accounts for 53,84% of total 2014 sales rises to 25%. Infrastructural jobs are paid upon certification of completion. They are not pre-paid, thus causing a cash shortage during construction (Kier, 2014). Under such circumstances the tightening up of APPP is not a desirable achievement. Moreover, the overall effect on the operating cycle is negative, as is shown in the next sub-chapter. 4.7 Operating Cycle Due to the reduction of APPP Kier’s Operating Cycle more than triples from only 20 days in FY2012 to 62 days in FY2014. This puts Kier under pressure to work more efficiently, i.e. to produce faster, hence reducing the inventory and its turnover period, though not at cost of quality, and to cash receivables sooner, hence decreasing trade receivables and freeing up cash (Garcia, 2011). A glance at BBY shows its ITP growing by 6,24%, which proves that BBY faces troubles to sell (Tovey, & Roland, 2015). However, for BBY it takes 7-9 days to sell, whereas Kier needs 63-84 days. Moreover, BYY needs 29-40 days to collect, with ARCP shortening by 18,36%, while Kier collects over a period of 44–50 days. A slight increase of BYY’s APPP of 8,08% to 46 days aligns it to that of Kier. Regarding its overall challenges a longer APPP provides BBY with cash much needed – the company even cancels its final dividend for FY2014 (Monaghan, 2015). The overall analysis shows, that high CoS (falling GPM) and administrative expenses (falling NPM) along with inefficiently managed assets (falling asset turnover and worsening operating cycle) are causative for Kier’s overall breakdown of ROCE despite the growing sales (KPMG, 2014). 4.8 Current Ratio 109 39 4643 44 46 0 20 40 60 80 100 120 2012 2013 2014 Days Years APPP Kier BBY
  • 9. www.theijbmt.com 28|Page Kier Group Plc: business and financial performance analysis and evaluation Figure 9: Current Ratio Whereas total assets at Kier increase, it does not benefit short-term liquidity. The proportion of current liabilities in relation to current assets grows, thus increasing the risk of running out of cash necessary for the day-to-day operations (Ronen, 2005). As a consequence, Kier’s Current Ratio deteriorates by 6,32% from 2013 to 2014. 4.9 Quick ratio , Figure 10: Quick Ratio The Quick Ratio of 0,66 remains equal over the period and is a sign that Kier constantly experiences a high need for cash and equivalents to meet its current liabilities (Company Watch puts warnings, 2014). The ratio is far below 1, the value accepted for companies with slow moving inventory (ACCA, 2011b). The Current Ratio and Quick Ratio of BBY grow by 25,09% and 24,86% to 0,99 and 0,92, respectively, and show that BBY is on the right track to improve its operations (Morby, 2015). It becomes evident that there is much room for rationalisation at Kier. 4.10 Interest Cover Ratio 1.12 1.18 1.10 0.79 0.95 0.99 0.00 0.20 0.40 0.60 0.80 1.00 1.20 1.40 2012 2013 2014 Times Years Current ratio Kier BBY 0.66 0.66 0.66 0.74 0.90 0.93 0.00 0.20 0.40 0.60 0.80 1.00 2012 2013 2014 Times Years Quick ratio Kier BBY
  • 10. www.theijbmt.com 29|Page Kier Group Plc: business and financial performance analysis and evaluation Figure 11: Interest Cover Ratio Kier’s long-term liquidity is also at risk. Its Interest Cover Ratio collapses by 83,77% from 9,63 to 1,56, with approximately 2/3 of 2014 PBIT to be spent on financial charges. Everything else being equal, a further decline of PBIT by 48,07% as occurred 2012-2014 would not leave enough earnings to meet debt contract obligations (Okoye, & Ubaka, 2005) turning a profit into a loss. The fall is caused mainly by interests payable on bank overdrafts and loans that increased by 125%, on borrowings (+290%) and on finance leases (+2.600%) (Kier, 2012, 2014). The bank overdraft charges correspond with the findings that the shortened APPP along with increased inventories and receivables place a burden on Kier. Increased financial lease commitments show that Kier actively manages its monetary resources. Contrary to bank borrowings leasing often pre-funds 100% of the asset’s price, the upfront payment asked for by banks can thus be utilized otherwise (Beedkar, 2006). Leasing contracts may contain no covenants and constraints on the lessee’s future financing obligations, as is often the case with bank loans, which thus may limit the borrower’s operating flexibility (Nevitt, & Fabozzi, 2000). Nevertheless, the adverse interest cover can make it difficult for Kier to obtain new debt finance. Instead, it could rely on retained earnings or issue equity - there are no interests payable on ordinary shares and dividend payments are subject to annual decision making with regard to the amount or even cancelation of a dividend payment for a particular year (Lynch, 2009). Therefore, equity finance can prevent interest cover from further deterioration (Parrott, 2011). This explains why Kier is going to finance its acquisition of Mouchel that has been agreed upon in April 2015 entirely by new equity (Whitelaw, 2015). But this solution has its cost to Kier: dividend payments are not tax-deductible, whereas interests are. Because of the tax advantage forgone, equity is regarded an expensive source of capital (Lynch, 2009). The interest cover of BBY crashes by 224,72% as the company operates at loss since FY2013 letting no earnings available to account for finance costs (Monaghan, 2015). 4.11 Price-Earnings Ratio Figure 12: Price - Earnings Ratio 9.63 3.05 1.562.23 -0.42 -3.23 -4.00 -2.00 0.00 2.00 4.00 6.00 8.00 10.00 12.00 2012 2013 2013 Times Years Interest Cover Kier BBY 8.98 23.35 97.53 53.63 -56.25 -24.24 -80.00 -60.00 -40.00 -20.00 0.00 20.00 40.00 60.00 80.00 100.00 120.00 2012 2013 2014 % Years P/E Kier BBY
  • 11. www.theijbmt.com 30|Page Kier Group Plc: business and financial performance analysis and evaluation The ratio’s denominator (earnings per share) reduces due to diminishing returns and dilution. The number of shares grows by 14.7m in 2013 to finance the acquisition of May Gurney and to account for scrip dividends (Kier, 2012, 2013, 2014). The nominator becomes higher given the increase of the year end share price by 41,73% 2012–2014 (LSE, 2015c). Consequently, P/E explodes by 985,79%. It starts with modest 8,98 that can be considered appropriate given the falling returns (Frecka, 2005). But towards the end of FY2014 it raised to 97,53. This P/E means that investors would wait over 97 years to get their share price back – clearly not a sound investment decision. P/E is 69,00 if calculated with 2012 number of shares, statistically still a very high value (Shen, 2000). The explanation for such a high P/E are strong expectations of future earnings that are priced into the market (ACCA, 2012b). Given Kier’s order book of £6,2bn (Telford, 2014) the investment community regards future earnings growth as low risk, that in turn may justify such a high P/E (Damodaran, 2004). BBY ends up with P/E of -24,24 being negative due to its loss per share. Nevertheless, its share price has been growing since year end 2014, enlarging P/E (LSE, 2015b). This means that investors regard the cost cutting and contract control efforts undertaken by the management (Dakers, & Tovey, 2015), along with BBY’s order books of £12,7bn (BBY, 2015) and the reference project of the UK-wide construction contract worth £2,9bn (Rubin, 2015) as a reliable and therefore low risk source of future prosperity (Damodaran, 2004). This makes them undertake further investments in BBY shares, pushing the share price and P/E upwards. 4.12 Capital Expenditure Per Employee Figure 13: Capital Expenditure Per Employee (CEPE) CEPE declines from 2012 to 2013 by 32,30%, as Kier spends money on the acquisition of May Gurney. It improves by 21,73% in 2014 to £3.143. The ratio depends on the managerial decision on whether to hire sub-contractors that use their own equipment or to acquire additional capital assets by itself (Barber, & Strack, 2005). Moreover, it does not consider Kier’s new finance lease obligations, which increases by 911,63% to £87m (Kier, 2012, 2014). If recalculated, the ratio grows to £5.673,30, almost 1,5 times the UK average of £3.900 (Ive et al., 2004). The comparison can be distorted by the allocation of assets as finance or operating leasing (Ive et al., 2004). Finance lease expenditure is capitalised, whereas operating lease costs are charged to the income statement (Lease – operating or finance, 2015). BBY hardly relies on leasing with finance lease obligations falling by 85,72% (BBY, 2013, 2015). Thus it misses the opportunities provided by this form of financing. 4.13 Value Added Per Employee 3,814 2,582 3,143 797 964 1,233 0 500 1,000 1,500 2,000 2,500 3,000 3,500 4,000 4,500 2012 2013 2014 £ Years CEPE Kier BBY
  • 12. www.theijbmt.com 31|Page Kier Group Plc: business and financial performance analysis and evaluation Figure 14: Value Added Per Employee (VAPE) Kier’s productivity ratio VAPE deteriorates by 16,77% to £16.387. It is no surprise given its falling gross profit and the number of employees growing by 42,29%. Kier is also considerably below market average of £63.800 (UK Industry, 2014). Low workforce productivity is considered a major hindrance of the construction industry (Rojas, & Aramvaarekul, 2003). This in turn is traced back to low qualification levels (Abdel-Wahab, Dainty, Ison, Bowen, &Huzlehorst, 2008). This is recognized by Kier that invests in training and employee development programmes to close the skill gap (Kitching, 2013). The 1.649 employees participating in 2014 (Kier, 2014) represent 10,75% of its total workforce – almost double the UK average (Abdel-Wahab et al., 2008). BBY performes worse. Although it started slightly better at £19.770, its VAPE drops by 83,28% to £3.296 in 2014, a discouraging development as BBY reduces its global employees by 20,77% (BBY, 2013, 2015). BBY tries to enhance its productivity through labour training, but with only 780 participants in 2014 on a much lesser scale, than Kier (BBY, 2015). 4.14 International Diversification Figure 15: International Diversification In foreign markets companies face severe price competition from rivals established there, lack of reliable supply chains and co-financing sub-contractors, let alone complexities of an alien legal area and troubles with receivables collection (There’s work abroad, 2012). This makes it difficult to meet the client’s requirements for high quality and safe construction, completed on time and on budget (Chan, & Chan, 2004). These disadvantages have prevented Kier from much overseas business, as indicated by its small ratio (2013:2,57; 2014:1,69). However, improvement is to come thanks to new contracts in the Middle East (Barnard, 2014) and the acquisition of Mouchel that can provide Kier with this company’s share of Australian highway maintenance business (Paton, 2015). The purchase of market participants can mitigate the difficulties in entering and mastering foreign markets (Smyth, 1985) as the acquirees are already established and possess country specific knowledge, networks, supply and distribution channels (Pradhan, &Alakshendra, 2006). 19,690 18,537 16,387 19,711 8,738 3,296 0 5,000 10,000 15,000 20,000 25,000 2012 2013 2014 £ Years VAPE Kier BBY 2.57 1.69 46.37 45.73 97.43 98.31 53.63 54.27 0.00 20.00 40.00 60.00 80.00 100.00 Kier 2013 Kier 2014 Years BBY 2013 BBY 2014 % International diversification Foreign Revenue Domestic revenue
  • 13. www.theijbmt.com 32|Page Kier Group Plc: business and financial performance analysis and evaluation Foreign sales of BBY account for 43,73% of total sales in 2012 due to its long-established role as a global player (Fickling, 2009). 4.15 SWOT Model 4.15.1 Strengths 4.15.1.1 Diversification Kier derives competitive advantage through diversification (Porter, 1998). It is diversified among three divisions (construction, property, residential), whereas each division relies on heterogeneous customers from industrials, military and aviation (Kier, 2014). Diversification mitigates the overdependence on one or few sources of income (Johnson, & Scholes 2002), for example the governmental budget on infrastructure that can be subject to spending constraints (Deloitte, 2013). 4.15.1.2 Strong market share Kier’s market share of 65 out of 350 British local authorities (18,57%) is a strong basis to build on (White, 2013b). It shows to other contracting authorities that Kier possesses the necessary experience and knowledge to be awarded with new projects, as has happened in FY2015 in Staffordshire (£400m) and Northamptonshire (£200m) (O’Beirne, 2014). 4.15.1.3 Specialisation While diversifying, Kier is also able to focus: it creates “Kier Living” brand for affordable housing pooling its residential building activities (Morby, 2015). Focussing can be regarded as a genuine strategy by itself to outperform rivals by specialisation (Betts, & Ofori, 1992). But it also provides Kier with the advantages of the cost leadership strategy (Warszawski, 1996) as tenure building demands less capital and is of lower risk compared to commercial building (Kier, 2014). 4.15.1.4 Investment in technology The company’s CEPE adjusted for finance leasing is strongly above UK average with Kier going to invest further £30m in IT and back-office infrastructure (Kier, 2014). New technology can help to operate more efficiently and be ahead of competitors as there is a technology backlog among UK construction industry (Madigan, 1997). 4.15.1.5 Investment in people Its above-average investment in employee training is key for further productivity growth (Harris, McCaffer, & Edum-Fotwe, 2013). 4.15.2 Weaknesses 4.15.2.1 Rising input costs Kier is subject to raising input-prices and labor costs, diminishing its margins (Sharman, 2014). It has to improve its cost controls (Madigan, 1997) and pay more attention to its supply chain to reduce costs (Harris et al., 2013). It could be difficult for Kier to preserve the margins through price increases given the harsh competition in the construction market (KPMG, 2014). 4.15.2.2 Restructuring costs The acquisition of May Gurney caused significant restructuring expenses. With the acquisition of Mouchel similar expenses are to be expected. According to the learning curve theory (ACCA, 2011b) Kier should reduce restructuring costs by learning from experience gained from former acquisitions. Management couching can support the learning processes (Johnson, & Scholes, 2002). 4.15.2.3 Financial risks Falling margins and growing finance charges reduce the interest cover to 1,56 with Kier being at risk not to meet its interest payment obligations. With the lending community heavily relying on this solvency ratio (Jayaram, 2013) Kier may face difficulties to obtain fresh finance for further growth. The company can mitigate this risk through issuance of new equity (Marlow, 2014). But (prospective) shareholders can recognise that they are just substituting debt finance that cannot be obtained elsewhere due to poor performance. Hence, the prospective equity providers may lose confidence and refrain from acquiring shares (ACCA, 2012d), thus making it more difficult for Kier to find new funds. 4.15.2.4 Overseas operations Kier derives less than 2% of its turnover from overseas operations. Thus, the company misses opportunity to participate in new emerging markets and to gain expertise in foreign business, binding itself to the prosperity of its home UK market (Hillebrandt, & Cannon, 1990).
  • 14. www.theijbmt.com 33|Page Kier Group Plc: business and financial performance analysis and evaluation 4.15.3 Opportunities 4.15.3.1 International diversification Kier can overcome its weakness of low international presence by gaining new overseas contracts and the acquisition of Mouchel. Especially in infrastructure there is a high demand in developing countries (Fox, & Skitmore, 2002). 4.15.3.2 UK-market recovery With UK being its main geographical business area the major opportunity for Kier lies in the recovery of the UK market. Governmental investments in infrastructure improve in 2014, as does the private housing market (Rhodes, 2014). 4.15.3.3 Sustainable construction Environment protection plays an important role in the construction industry (Ding, 2008). Kier pays attention to this development through implementing Government’s Corporate Assessment of Environmental, Social and Economic Responsibility Reporting (CEASER) and disclosing its greenhouse gas emissions (Kier, 2014). Kier could try to cope with the government’s ambitious Construction 2025 programme to reduce costs, time and emissions that all have an environmental impact (Rhodes, 2014). The marketing of these achievements would make Kier a preferable constructor for public projects (DEFRA, 2006) and attract demand by environmentally conscious private customers. 4.15.4 Threats 4.15.4.1 Substitutes A threat of substitute arises from the increased use of IT as a means of sending information, simplifying private and business correspondence or holding virtual meetings, thus reducing the need for conventional infrastructure (Madigan, 1997). Diversification into other activities and regions can help to reduce this threat (Hillebrandt, & Cannon, 1990). 4.15.4.2 Slow market recovery Despite growing investments in infrastructure and private housing the construction sector is still 5,9% below its pre-crisis value of 2007 (Rhodes, 2014). Such a slow recovery can endanger the company’s growth targets. 4.15.4.3 International Competition A further threat is increased competition through international construction companies entering the UK market like the Indian Lodha Group, which is going to invest £3bn in the London real-estate (Mark, 2014). Kier can mitigate this risk by strengthening its local supply chain (Xiao, & Proverbs, 2003), thus exploiting location-based advantages, which my be difficult to obtain by a foreign company during its first years in the UK (Porter, 2004). 4.15.4.4 Health & Safety Construction and related services are labor intensive and involve machines, vehicles and other instruments. Danger of accidents and human harm arise (Harris et al., 2013). Any non-compliance with health and safety regulations or even fatal accidents as happened to Kier twice in FY2014 (Kier, 2014) and once in FY2015 (Davis, 2014) can lead to substantial penalties and other legal charges (IIRSM, 2010). Reputational damage can follow negative publicity resulting in loss of customers (Beauchamp, n.d.). Kier should adopt human safety as an absolute standard for its further development (Butcher, & Sheehan, 2009). 4.16 PESTEL Framework 4.16.1 Political factors 4.16.1.1 Public funding UK politics support the construction industry through governmental funding via numerous infrastructural programmes in which Kier participates (Kier, 2014). Consumer spending is stimulated through supportive measures like the Affordable Housing Grant Programme (Kier, 2014). The receivers of grants are the target group of Kier’s “Kier Living” brand. However, this program has been subject to budget cuts resulting in half the funding per house in 2013- 2015 compared to 2008-2011 (Frontier Economics, 2014). When formulating its strategy for further growth, Kier should stress the importance of participating in governmental programmes. Even if its funding reduces, the political interest in infrastructural and housing development is a significant environmental force and source of contracts (Johnson, & Scholes 2002). 4.16.1.2 Social diversity Socially diversified neighbourhoods have been a stated goal of UK politics for the long time. The idea is to avoid social clustering and infrastructural downturn of poorer quarters (Fonseca Feitosa, & Wissmann, 2006). With “Kier Living” targeting a social mix of tenants Kier adopts this policy. This is a sound strategic move as “Kier Living” projects will be undertaken in partnership with local political units, say local councils (Kier launches new housing division, 2014).
  • 15. www.theijbmt.com 34|Page Kier Group Plc: business and financial performance analysis and evaluation 4.16.2 Economic factors 4.16.2.1 Mortgage interests Mortgage interest are historically low starting with fix rates at 1,09 p.a. (Jones, 2015). This makes private house consumption affordable (Carver, 2011). This corresponds with Kier’s focus on residential living through the creation of “Kier Living” brand. 4.16.2.2 Unemployment Unemployment being the lowest for seven years can lead to intense competition for qualified staff and increasing labor costs (Elliott, 2015). Kier has already to deal with cost pressure and a skill gap. Its profit targets and human resource strategy should consider that these problems could intensify. 4.16.2.3 Exchange rates The strong British pound that could diminish overseas revenues does not affect Kier due its minor overseas turnover (Kier, 2014). This could change as Kier works hard to acquire contracts in foreign markets. Its expansion strategy should consider that in the short term transferring earnings from overseas will go ahead with currency losses (Duncan, 2015) if not properly hedged against (ACCA, 2012d). On the other hand, construction hardly depends on importing inputs (8% in contrast to 28% in manufacturing) (LEK, 2009). Thus Kier cannot gain much advantage from favourable exchange rates, when importing materials to the UK. 4.16.3 Social factors 4.16.3.1 Ageing population Demography influences constructing and infrastructure in several ways. By 2025, the share of people over 65 in the UK will be grown by 38% (CBI, 2013), increasing the demand for hospitals, care homes or distinctive housing (BIS, 2013). Kier should accumulate expertise in offering special accommodation for the elderly (Gillespie, 2007). 4.16.3.2 Migration Due to estimated annual net migration of 200.000 the UK population will increase, especially in urban areas, thus creating a pressing demand for housing and transportation, energy supply facilities and public infrastructure (Barrett, 2014). This will present urban planning authorities with new challenges. Furthermore, given its strong focus on tenure Kier should be able to manage tenancies from different cultural, ethnical and religious background. 4.16.4 Technological factors 4.16.4.1 Research & Development As a developed European country, the UK has an advanced technological infrastructure. However, technology usage strongly differ among industries. Construction industry annually invests approximately £22m in relevant Research & Development (R&D) on a declining scale, whereas other sectors spent £500m on average and undertake further innovative efforts (BIS, 2013). 4.16.4.2 Soft-Technology On that background a construction company investing in innovation and technological improvement could bypass its competitors through the technological leadership strategy (Barney, 2007). It may be argued that innovation in construction is rather supplier-dominated with construction companies largely depending on the technological progress on part of the producer of machinery and tools (Johnson, & Scholes 2002). But if technology is not understood as hardware only, paying attention to soft-technology like managerial processes, operational controls and company culture (Barney, 2007) than there is room for improvement at the construction sector itself. 4.16.5 Environmental factors 4.16.5.1 Sustainable procurement The UK experiences a growing demand for environment-friendly facilities (LEK, 2009). This trend is strongly supported by governmental initiatives and target settings. Furthermore, public services follow sustainable procurement guidelines thus creating a market for companies able to fulfil the requirements (DEFRA, 2006). Adoption of these guidelines is key for Kier to secure further governmental contracts.
  • 16. www.theijbmt.com 35|Page Kier Group Plc: business and financial performance analysis and evaluation 4.16.5.2 Climate change The sector faces climate changes (Gillespie, 2007). Infrastructure, energy supply and transportation are all at risk of whether anomalies (Harvey, 2014). Scenario drawing is therefore important for Kier (Goodie, Austin, & Guthrie, 2009) to be prepared to increased demand for constructional safety or new requirements for materials used. 4.16.6 Legal factors 4.16.6.1 Legal environment The British construction industry is regulated by several acts like the Local Democracy, Economic Development and Construction Act 2011, the UK Health and Safety at Work Act 1974 and the Construction (Design and Management) Regulations 2007. The legal system offers a great contractual flexibility to the parties to best reflect the economic relationship chosen (Harris et al., 2013). Legal protection of parties harmed by the breach of contract (Ismail, 2012) can be obtained through a functioning court system. 4.16.6.2 Legal control Poor legal project control and non-enforcement of contractual rights can plunge a company into a loss-making situation, as can be seen from the negative example of BBY. Tough legal control is necessary in the highly fragmented UK construction industry where about 70 sub-contractors per £25m-project are involved (BIS, 2013). Therefore it is crucial for Kier’s future strategy not only to create value, but also to ensure that it can benefit from this value through the enforcement of its contractual rights. V. CONCLUSION 5.1 Answer to RQ1 Kier is able to generate revenue on a growing scale through acquisition of new businesses and through diversification, thus differing from its comparator. However, it is challenged by increasing costs that diminish its margins. Compared to BBY, Kier is slower in turning inventory into sales and collecting its receivables. Therefore, there is potential to improve the efficiency of operations, especially to utilise its assets in a more efficient way. Kier experiences a steady shortage of liquidity. This can constitute a financial risk and undermine the cooperation with lending institutions, thus hindering Kier to acquire fresh capital for new projects. Therefore the company relies on equity providers believing in its growing revenue and strong order books. 5.2 Answer to RQ2 Kier’s performance is built on its diversified divisions and high market share in public procurement. It invests in people and IT, thus preparing for the recovery of UK construction market. But tough cost control is needed to master the strong competition with thin margins. Kier is influenced by the economic environment and the political commitment to support the construction industry. Its assets and operations are subject to steady technological change and increasing demand for sustainable construction. Kier faces a growing social diversification among residential customers and has to be prepared to far-reaching climatic changes effecting its infrastructural engagement. 5.3 Answer to RQ3 Kier should intensify and improve its cost control to safe its margins from deteriorating. It has to use its assets more efficiently and become more creditworthy for debt capital providers. The company should strengthen its overseas operations to diversify not only among business fields, but also geographically. Further investments in technology and human resources are needed to outperform domestic and international competitors. References [1] Abdel-Wahab, M. S., Dainty, A. R. J., Ison, S. G., Bowen, P., & Huzlehorst, G. (2008). Trends of skills and productivity in the UK construction industry. Engineering, Construction and Architectural Management, 15 (4), pp. 372-382. [2] Association of Chartered Certified Accountants - ACCA (2011a). Accountant in business. Berkshire: Kaplan Publishing UK.
  • 17. www.theijbmt.com 36|Page Kier Group Plc: business and financial performance analysis and evaluation [3] Association of Chartered Certified Accountants - ACCA (2011b). Performance management (5th ed.). London: BPP Learning Media Ltd. [4] Association of Chartered Certified Accountants - ACCA (2012a). Financial reporting (International and UK stream) (6th ed.). London: BPP Learning Media Ltd. [5] Association of Chartered Certified Accountants - ACCA (2012b). Business analysis (6th ed.). London: BPP Learning Media Ltd. [6] Association of Chartered Certified Accountants - ACCA (2012c). Audit and assurance (United Kingdom) (6th ed.). London: BPP Learning Media Ltd. [7] Association of Chartered Certified Accountants - ACCA (2012d). Financial management (6th ed.). London: BPP Learning Media Ltd. [8] Amor, K., & Warner, A. (2003). Uncovering creative accounting. Harlow: Pearson Education Ltd. [9] Balfour Beatty Plc (2009). 100 years of Balfour Beatty. Retrieved from: http://www.balfourbeatty.com/files/publications/2008/100_years.pdf [10] Balfour Beatty Plc (2013). Annual report and accounts 2012. Retrieved from: http://www.balfourbeatty.com/files/reports/2012/ar2012/ar2012_interactive.pdf [11] Balfour Beatty Plc (2014). Annual report and accounts 2013. Retrieved from: http://www.balfourbeatty.com/files/reports/2013/ar2013/ar2013_interactive.pdf [12] Balfour Beatty Plc (2015). Annual report and accounts 2014. Retrieved from: http://www.balfourbeatty.com/files/reports/2014/ar2014/ar2014.pdf [13] Barber, F., & Struck, R. (2005). The surprising economics of a “People Business”. Harvard Business Review. Retrieved from: https://hbr.org/2005/06/the-surprising-economics-of-a-people-business [14] Barker, R., & Imam, S. (2005). Earning, dividends and valuation. In: Clubb, C. (ed.) Accounting. The Blackwell encyclopedia of management (2nd ed.). Oxford: Blackwell Publishing Ltd., pp. 158-161. [15] Barnard, L. (2014, September 18). UK builder Kier lands £192m in Abu Dhabi contracts. The National. Retrieved from: http://www.thenational.ae/business/property/20140918/uk-builder-kier-lands-192m-in-abu-dhabi- contracts [16] Barney, J. B. (2007). Gaining and sustaining competitive advantage (3rd ed.). New Jersey: Pearson Prentice Hall. [17] Barrett, D. (2014, February 27). Net migration soars over 200,000 despite David Cameron's pledge. The Daily Telegraph. Retrieved from: http://www.telegraph.co.uk/news/uknews/immigration/10664667/Net-migration- soars-over-200000-despite-David-Camerons-pledge.html [18] BBC News (2013). Balfour Beatty shares fall after profit warning. Retrieved from: http://www.bbc.com/news/business-22335053 [19] Beauchamp, M. (n. d.). The disadvantages of bad publicity. Retrieved from: http://yourbusiness.azcentral.com/disadvantages-bad-publicity-3495.html [20] Beedkar, R. V. (2006). Equipment leasing: Analysis of industry practices emphasizing lessors' risks and returns. Senior Honors Thesis Eastern Michigan University. Retrieved from: http://commons.emich.edu/cgi/viewcontent.cgi?article=1062&context=honors [21] Betts, M., & Ofori, G. (1992). Strategic planning for competitive advantage in construction. Construction Management and Economics, 10, pp. 511-532. [22] Bioy, H. (2014). Tracking the FTSE 250: do you know what you're buying?Retrieved from: http://www.morningstar.co.uk/uk/news/124130/tracking-the-ftse-250-do-you-know-what-youre-buyi ng.aspx
  • 18. www.theijbmt.com 37|Page Kier Group Plc: business and financial performance analysis and evaluation [23] Butcher, D. C. A., & Sheehan, M. J. (2009). Excellent contractor performance in the UK construction industry. Engineering, Construction and Architectural Management, 17 (1), pp. 35-45. [24] Carver, R. (2011). Construction shortfall and government intervention in the UK private sector housing market. Working Paper. Retrieved from: http://papers.ssrn.com/sol3/papers.cfm?abstract_id=1952672 [25] Chan, A. P. C., & Chan, A. P. L. (2004). Key performance indicators for measuring construction success. Benchmarking: An International Journal, 11 (2), pp. 203-221. [26] Cho, Y. (2011). The UK housebuilding: an analysis of post-barker structural responses. Working Paper Oxford Brookes University. Retrieved from: http://oisd.brookes.ac.uk/resources/OISDworkingpaper2Sept2011.pdf [27] Company Watch puts health warnings on Kier and Galliford Try (2014). Retrieved from: http://www.theconstructionindex.co.uk/news/view/company-watch-puts-health-warning-on-kier-and- galliford-try [28] Confederation of British Industry (CBI) (2013). Building Britain’s future. Retrieved from: http://www.cbi.org.uk/media/2118883/building_britains_future.pdf [29] Dakers, M., & Tovey, A. (2015, March 25). Balfour Beatty scraps its dividend for a year after falling into the red. The Daily Telegraph. Retrieved from: http://www.telegraph.co.uk/finance/newsbysector/constructionandproperty/11493591/Balfour-Beatty-scraps- its-dividend-for-a-year-after-falling-into-the-red.html [30] Damodaran, A. (2004). Investment Fables. New Jersey: Financial Times Prentice Hall. [31] Datamonitor (2011). Construction and engineering in United Kingdom. Retrieved from:http://79.170.44.97/cleantechcivils.com/wp-content/uploads/2012/06/Industry-Profile-Civil- Engineering.pdf [32] Davis, B. (2014, September 11). Rubbish collections disrupted in Waltham Forest following fatal crash. The Guardian. Retrieved from: http://www.guardian- series.co.uk/news/11466577.Rubbish_collections_disrupted_following_fatal_crash/ [33] Delaney, F. (2003). Effectiveness of mergers and acquisitions and corporate financial performance in construction. PhD Thesis Edinburgh Napier University. Retrieved from: http://researchrepository.napier.ac.uk/2750/1/DelPhD272595.pdf [34] Deloitte (2013). EPoC 2012 European Powers of Construction. Retrieved from: http://www2.deloitte.com/content/dam/Deloitte/de/Documents/real-estate/RE-European-Powers-of- Construction-2012.pdf [35] Department for Business, Innovation and Skills (BIS) (2013). UK construction. An economic analysis of the sector. Retrieved from: https://www.gov.uk/government/uploads/system/uploads/attachment_data/file/210060/bis-13-958-uk- construction-an-economic-analysis-of-sector.pdf [36] Department for Environment, Food and Rural Affairs (DEFRA) (2006). Procuring in the future. Retrieved from: https://www.gov.uk/government/uploads/system/uploads/attachment_data/file/69417/pb11710-procuring- the-future-060607.pdf [37] Ding, G. K. C. (2008). Sustainable construction - the role of environmental assessment tools. Journal of Environmental Management, 86, pp. 451–464. [38] Duncan, H. (2015, March 11). Pound's seven-year high against the euro: Families look set for cheaper continental trips at Easter after Sterling passes 1.40. The Daily Mail. Retrieved from: http://www.thisismoney.co.uk/money/comment/article-2893696/HUGO-DUNCAN-Roller-coaster-ride- ahead-sterling-2015-turbulent-two-years-pound-suffer-no-party-wins-majority-general-election.html [39] Elliot, L. (2015, May 13). UK unemployment falls to seven-year low, but Bank is right to be cautious. The Guardian. Retrieved from: http://www.theguardian.com/business/2015/may/13/uk-unemployment-falls- seven-year-low-bank-right-to-be-cautious
  • 19. www.theijbmt.com 38|Page Kier Group Plc: business and financial performance analysis and evaluation [40] Faulkner, D., & Bowman, C. (1995). The essence of competitive strategy. Hemel Hempstead: Prentice Hall International (UK) Ltd. [41] Feitosa Fonseca, F. D., & Wissmann, A. (2006). Social-mix policy approaches to urban segregation in Europe and the United States. Term Paper University of Bonn. Retrieved from: http://www.zef.de/fileadmin/downloads/forum/docprog/Termpapers/2006_3_Wissmann_Fonseca.pdf [42] Fickling, D. (2009, August 13). Balfour Beatty aiming for return to global presence. Financial Times. Retrieved from: http://www.ft.com/intl/cms/s/0/7a098fee-87a0-11de-9280-00144feabdc0.html#axzz3aQneT2J8 [43] Fisenec, J. (2013, September 13). Questor share tip: Construction outlook improves for Kier. The Daily Telegraph. Retrieved from: http://www.telegraph.co.uk/finance/markets/questor/10305427/Questor-share-tip- Construction-outlook-improves-for-Kier.html [44] Fox, P., & Skitmore, M. R. (2002). Key Factors in the Future Development of the Construction Industry. In: Proceedings Creating a sustainable construction industry in developing countries, Proceedings of the 1st International Conference of The International Council for Building Research Studies and Documentation (CIB) Working Commission W107: Construction in Developing Co. Queensland University of Technology, 11-13 November, Stellenbosch, South Africa, pp. 543-554. Retrieved from: http://eprints.qut.edu.au/4518/1/4518.pdf [45] Frecka, T. J. (2005). Earnings per share. In: Clubb, C. (ed.) Accounting. The Blackwell encyclopedia of management (2nd ed.). Oxford: Blackwell Publishing Ltd., pp. 170-173. [46] Frontier Economics Ltd. (2014). Assessing the social and economic impact of affordable housing investment. Retrieved from: http://www.frontier-economics.com/documents/2014/09/rpt-affordable-housing-report-2.pdf [47] Garcia, J. F. L. (2011). The impact of working capital management upon companies’ profitability: evidence from European companies. Working Paper Porto University. Retrieved from: http://papers.ssrn.com/sol3/papers.cfm?abstract_id=2165210 [48] Gillespie, A. (2014). Foundations of Economics 3e - additional chapter on business strategy. Oxford: Oxford University Press. Retrieved from: http://fdslive.oup.com/www.oup.com/orc/resources/busecon/economics/gillespie_econ3e/student/chapter /gillespie3e_chapter_businessstrategy.pdf [49] Goodier, C., Austin, S., & Guthrie, W. (2009), Future scenarios for the European construction industry. In: Dainty, A. (ed.). Procs 25th Annual ARCOM Conference, Association of Researchers in Construction Management, 7-9 September, Nottingham, UK, pp.1121-1129. Retrieved from: http://www.arcom.ac.uk/- docs/proceedings/ar2009-1121-1129_Goodier_Austin_and_Guthrie.pdf [50] Gupta, A. (2013). Environment & PEST analysis: an approach to external business environment. International Journal of Modern Social Sciences, 2 (1), pp. 34-43. Retrieved from: http://modernscientificpress.com/Journals/ViewArticle.aspx?YTDXIp8pwb35qABc+2BV/1WJUQnMuLGNSj0 NcUX/H4nrYH2pOUyBFV904kXBzuJV [51] Harris, F., McCaffer, R., & Edum-Fotwe, F. (2013). Modern construction management (7th ed.). Chichester: John Wiley & Sons, Ltd. [52] Harvey, F. (2014, June 1). UK summer flash floods to become more frequent, study shows. The Guardian. Retrieved from: http://www.theguardian.com/environment/2014/jun/01/uk-summer-flash-floods-climate- change-study [53] Hillebrandt, P. M., & Cannon, J. (1990). The modern construction firm. Basingstoke: The Macmillan Press Ltd. [54] Ho, J. K.-K. (2013). Formulation of a systemic PEST analysis for strategic analysis. European Academic Research, 2 (5), pp. 6478-6492. Retrieved from: http://euacademic.org/UploadArticle/831.pdf [55] Houben, G., Lenie, K., & Vanhoof, K. (1999). A knowledge-based SWOT-analysis system as an instrument for strategic planning in small and medium sized enterprises. Decision Support Systems, 26, pp. 125-135. Retrieved from: http://intra.tesaf.unipd.it/pettenella/Corsi/ReaserchMethodology/Documents/SWOT_Analysis_Houben_et_a l.pdf
  • 20. www.theijbmt.com 39|Page Kier Group Plc: business and financial performance analysis and evaluation [56] InsightBee (2014). Kier Group Plc In-depth company report.Retrieved from: https://www.insightbee.com/norev/sample_reports/company/package/generic/In- depth%20Company%20Profile.pdf [57] International Institute for Risk and Safety Management (IIRSM) (2010). £200k penalty for fatal fall at Everton FC. Retrieved from: http://www.iirsm.org/Resources/IIRSM/Documents/PDF/November%202010.pdf [58] Ismail, B. (2012). An evaluation of the implementation of Total Quality Management (TQM) within the construction sector in the United Kingdom and Jordan. PhD Thesis University of Huddersfield. Retrieved from: http://eprints.hud.ac.uk/14055/1/0666332-LoiyBaniIsmail_FinalThesis.pdf [59] Isoherannen, V. (2012). Strategy analysis frameworks for strategy orientation and focus. PhD Thesis University of Oulu. Retrieved from: http://herkules.oulu.fi/isbn9789514297885/isbn9789514297885.pdf [60] Ive, G., Gruneberg, S., Meikle, J., & Crosthwaite D. (2004). Measuring the competitiveness of the UK construction industry. Retrieved from: http://discovery.ucl.ac.uk/13153/1/13153.pdf [61] Jayaram, A. (2013, July 6). Debt traps India Inc as profits fail to cover interest outgo. The Hindu Business Line. Retrieved from: http://www.thehindubusinessline.com/companies/debt-traps-india-inc-as-profits-fail-to-cover- interest-outgo/article4889184.ece [62] Jones, P. (2006). Ove Arup. Masterbuilder of the twentieth century. New Haven: Yale University Press. [63] Jones, R. (2015, May 1). Fix rate mortgages hit record low as Co-op Bank deal of 1.09% goes on sale. The Guardian. Retrieved from: http://www.theguardian.com/money/2015/may/01/fixed-rate-mortages-record- low-co-op-bank-1-09-two-year [64] Johnson, G., & Scholes, K. (2002). Exploring corporate strategy (6th ed). Harlow: Financial Times Prentice Hall. [65] Johnson, R. (2014, October 3 ). 700 homes planned for site of two former Derby hospitals in £100m scheme. Derby Telegraph. Retrieved from: http://www.derbytelegraph.co.uk/700-homes-planned-site-Derby-hospitals-pound- 100m/story-23038118-detail/story.html [66] Keller Group Plc (2015). Annual report and accounts 2014. Retrieved from: http://www.keller.co.uk/~/media/Files/K/Keller-V2/storage/pdfs/2014/keller-ara14-130315.pdf [67] Kessler, E. H. (2013). SWOT analysis framework. In: Kessler, E. H. (ed.). Encyclopedia of management theory. Thousand Oaks: SAGE Publications, Inc. pp. 813-816. Retrieved from: http://www.uk.sagepub.com/gray3e/study/chapter3/Encyclopaedia%20entries/SWOT_Analysis_Framework. pdf [68] Ketz, J. E. (2003). Hidden Financial Risk. Hoboken: John Wiley & Sons. Inc. [69] Kier Group Plc (2012). Annual report & accounts 2012. Retrieved from: http://www.kier.co.uk/~/media/Files/K/Kier/documents/investor-relation/reports-and-presentaions/kier- annual-report-2012.pdf [70] Kier Group Plc (2013). Annual report & accounts 2013. Retrieved from: http://www.kier.co.uk/~/media/Files/K/Kier/documents/investor-relation/reports-and- presentaions/FINAL%20Kier_2013_Annual%20Report%20updated%2021-10-14.pdf [71] Kier Group Plc (2014). Annual report 2014. Retrieved from: http://www.kier.co.uk/~/media/Files/K/Kier/documents/investor-relation/reports-and-presentaions/ar- 2014a/ar2014.pdf [72] Kier Group Plc (2014). Kier launches new housing division. Retrieved from: http://www.kier.co.uk/press- office/press-release/2014/14-07-2014a.aspx [73] Kitching, R. (2013). Construction news awards training initiative of the year. Retrieved from: http://www.cnplus.co.uk/home/awards/construction-news-awards/construction-news-awards-training- initiative-of-the-year/8649994.article#.VVk9n0Z5mmU
  • 21. www.theijbmt.com 40|Page Kier Group Plc: business and financial performance analysis and evaluation [74] KPMG (2014). Construction barometer: Recovery in sight? Retrieved from: http://kpmg.co.uk/creategraphics/09_2014/Construction_Barometer/files/assets/common/downloads/publi cation.pdf [75] LEK (2009). Construction in the UK Economy. Retrieved from: http://www.nasc.org.uk/NASC/files/ea/eabc21b4-91d3-4e44-8f0f-ab27a7a0a4b1.pdf [76] Latchem, R. (2013). Construction giant Kier takes over May Gurney. Retrieved from: http://www.mrw.co.uk/news/may-gurney-takeover-by-kier-completed/8650447.article [77] Lease – operating or finance? (2015). Retrieved from: http://www.accaglobal.com/vn/en/student/exam- support-resources/fundamentals-exams-study-resources/f7/technical-articles/lease.html [78] London Stock Exchange (LSE) (2010). A guide to listing on the London Stock Exchange. London: White Page Ltd. Retrieved from: http://www.londonstockexchange.com/home/guide-to-listing.pdf [79] London Stock Exchange (2015a). FTSE 250 – Share prices Industry Sector Construction & Materials. Retrieved from: http://www.londonstockexchange.com/exchange/prices-and-markets/stocks/indices/constituents- indices.html?index=MCX&industrySector=2350&page=1 [80] London Stock Exchange (2015b). Balfour Beatty Plc – Interactive chart. Retrieved from: http://www.londonstockexchange.com/exchange/prices-and-markets/stocks/summary/company-summary- chart.html?fourWayKey=GB0000961622GBGBXSTMM [81] London Stock Exchange (2015c). Kier Group Plc – Interactive chart. Retrieved from: http://www.londonstockexchange.com/exchange/prices-and-markets/stocks/summary/company-summary- chart.html?fourWayKey=GB0004915632GBGBXSTMM [82] Lu, W. (2010). Improved SWOT approach for conducting strategic planning in the construction industry. Journal of Construction Engineering and Management, 136 (12), pp. 1317–1328. Retrieved from: http://www.bre.polyu.edu.hk/BRE_workshop/pdf/COENG-470%20- %20An%20Improved%20SWOT%20analysis.pdf [83] Lynch, P. (2009). Optimum capital. Student Accountant, pp. 78-84. Retrieved from: http://www.accaglobal.com/content/dam/acca/global/PDF-students/2012s/sa_junjul09_lynch.pdf [84] Macalister, T. (2012, September 6). May Gurney issues profit warning as chief executive departs. The Guardian. Retrieved from: http://www.theguardian.com/business/2012/sep/06/may-gurney-issues-profit-warning [85] Madigan, D. (1997). A SWOT analysis of the UK civil engineering industry. Working Paper University of Bath. Retrieved from: http://www.bath.ac.uk/management/larg_agile/publications/pdf/public/96.014.300.pdf [86] Mark, L. (2014, September 22). Indian developer sets sights on London with £3bn war chest. Architects Journal. Retrieved from: http://www.architectsjournal.co.uk/news/indian-developer-sets-sights-on-london-with-3bn- war-chest/8669962.article [87] Marlow, B. (2014, December 20). Private equity in bid for Mouchel. The Daily Telegraph. Retrieved from: http://www.telegraph.co.uk/finance/newsbysector/supportservices/11306077/Private-equity-in-bid-for- Mouchel.html [88] Miwa, Y., & Ramseyer, J. M. (2005). Trade credit, bank loan and monitoring: evidence from Japan. Discussion Paper Harvard University. Retrieved from: http://www.law.harvard.edu/faculty/ramseyer/wptrade.pdf [89] Monaghan, A. (2015, March 25). Balfour Beatty reports £304m loss and cancels final dividend. The Guardian. Retrieved from: http://www.theguardian.com/business/2015/mar/25/balfour-beatty-304-million-pound-loss [90] Morby, A. (2015). Balfour Beatty probe exposes new £70m black hole. Retrieved from: http://www.constructionenquirer.com/2015/01/22/balfour-beatty-probe-exposes-new-70m-black-hole/ [91] Morby, A. (2015). Kier saves jobs as Southdale Homes collapses. Retrieved from: http://www.constructionenquirer.com/2015/04/30/kier-saves-jobs-as-southdale-homes-collapses/
  • 22. www.theijbmt.com 41|Page Kier Group Plc: business and financial performance analysis and evaluation [92] Mulford, C. W., & Comiskey, E. E. (2002). The financial numbers game: detecting creative accounting practices. New York: John Wiley & Sons. Inc. [93] Nevitt, P. K., & Fabozzi, F. J. (2000). Equipment Leasing (4th ed.). New Hoper: John Wiley & Sons. Inc. [94] O’Beirne, S. (2014). Kier lands two local authority deals worth £600m. Facilities management Journal. Retrieved from: http://www.fmj.co.uk/kier-lands-two-local-authority-deals-worth-600m/ [95] Okoye, E., & Ubaka, C. E. (2005). Ratio analysis: a sine qua non for managerial decision. The Nigerian Accountant, 38 (3), pp. 23-29. Retrieved from: http://papers.ssrn.com/sol3/papers.cfm?abstract_id=1804215 [96] Paton, E. (2015, April 28). Kier confirms Mouchel takeover. Financial Times. Retrieved from: http://www.ft.com/intl/cms/s/0/c9da10bc-ed6f-11e4-987e-00144feab7de.html#axzz3aQneT2J8 [97] Parrott, W. (2011). Analysing the suitability of financing alternatives. Student Accountant Retrieved from:http://www.accaglobal.com/content/dam/acca/global/PDF-students/2012s/sa_june11_alternatives.pdf [98] Pitt, V. (2014). Kier knocks £45m off May Gurney assets. Retrieved from: http://www.building.co.uk/kier- knocks-%C2%A345m-off-may-gurney-assets/5066871.article [99] Porter, M. E. (1998). Competitive strategy (1st export ed.). New York: Free Press. [100] Porter, M. E. (2004). Competitive advantage (1st export ed.). New York: Free Press. [101] Pradhan, J. P., & Alakshendra, A. (2006). Overseas acquisition versus greenfield foreign investment: Which internationalization strategy is better for Indian pharmaceutical enterprises? Working Paper Institute for Studies in Industrial Development. Retrieved from: http://mpra.ub.uni- muenchen.de/12339/1/MPRA_paper_12339.pdf [102] Pyke, C. (2007). Interpreting financial statements. Student Accountant, pp. 40-43. Retrieved from: http://www.accaglobal.com/content/dam/acca/global/PDF-students/2012t/pyke0207.pdf [103] Quinn, L., & Magrath, D. (2015). KPMG Review, Valuation of Investments Portfolio and Trading Update. Retrieved from: http://www.balfourbeatty.com/files/results/2015/trading_update_jan15_presentation.pdf [104] Retallack, B. (2014). Performance appraisal. Retrieved from: http://www.accaglobal.com/za/en/student/exam- support-resources/fundamentals-exams-study-resources/f7/technical-articles/performance-appraisal.html [105] Rhodes, C. (2014). The construction industry: statistics and policy. House of Commons. Retrieved from: http://researchbriefings.parliament.uk/ResearchBriefing/Summary/SN01432#fullreport [106] Rogers, K. (n.d.). Direct and indirect COGS in a service industry. Retrieved from: http://smallbusiness.chron.com/direct-indirect-cogs-service-industry-75032.html [107] Rojas, E. M., & Aramvareekul, P. (2003). Labor productivity drivers and opportunities in the construction industry. Journal of Management and Engineering, 19 (2), pp. 78-82. [108] Roland, D. (2014, March 6). UK troubles batter Balfour Beatty profits. The Daily Telegraph. Retrieved from: http://www.telegraph.co.uk/finance/newsbysector/supportservices/10680868/UK-troubles-batter-Balfour- Beatty-profits.html [109] Ronen, J. (2005). Financial accounting theory and research. In: Clubb, C. (ed.) Accounting. The Blackwell encyclopedia of management (2nd ed.). Oxford: Blackwell Publishing Ltd., pp. 183-188. [110] Rubin, D. K. (2015). Balfour Beatty moves on critical review of UK unit bidding and risk management. Retrieved from: http://enr.construction.com/business_management/companies/2015/0202-balfour-beatty-hires-new-cfo- as-it-moves-to-reboot.asp [111] Sharman, A. (2014, September 18). Kier offers hope for UK construction industry as profits rise. Financial Times. Retrieved from: http://www.ft.com/intl/cms/s/0/bb8c6868-3f08-11e4-a861-00144feabdc0.html#axzz3aQneT2J8
  • 23. www.theijbmt.com 42|Page Kier Group Plc: business and financial performance analysis and evaluation [112] Shen, P. (2000). The P/E ratio and stock market performance. Federal Reserve Bank of Kansas City Economic Review, pp. 23-36. Retrieved from: https://www.kansascityfed.org/Publicat/econrev/pdf/4q00shen.pdf [113] Schilit, H. M. (2010). Financial shenanigans: how to detect accounting gimmicks & fraud in financial reports (3rd ed.). New York: McGraw-Hill. [114] Smyth, H. (1985). Property companies and the construction industry in Britain. Cambridge: Cambridge University Press. [115] Telford, W. (2014, September 24). Plymouth's Kier Group sees profits hit £88m. Plymouth Herald. Retrieved from: http://www.plymouthherald.co.uk/Plymouth-s-Kier-Group-sees-profits-hit-pound-88m/story-22971555- detail/story.html [116] There’s work abroad: What are you waiting for? (2012). Construction Manager. Retrieved from: http://www.construction-manager.co.uk/agenda/what-are-you-waiting/ [117] Tovey, A., & Roland, D. (2015, January 22). Balfour Beatty unveils further £70m profit shortfall following KPMG review. The Daily Telegraph. Retrieved from: http://www.telegraph.co.uk/finance/newsbysector/constructionandproperty/11361882/Balfour-Beatty- unveils-further-70m-profit-shortfall-following-KPMG-review.html [118] UK Industry Performance Report 2014 (2014). The Institute of Clerks of Works and Construction Inspectorate of GB Inc. Retrieved from: http://www.icwgb.org/_files/Documents/F8B059896BE15C816313FBD9FBA2C72C.pdf [119] Warszawski, A. (1996). Strategic planning in construction companies. Journal of Construction Engineering and Management, pp. 133-140. [120] Wembridge, M. (2013, August 14). Balfour Beatty suffers as economic gloom hits construction. Financial Times. Retrieved from: http://www.ft.com/intl/cms/s/0/96966402-04ce-11e3-9e71-00144feab7de.html#axzz3aQneT2J8 [121] White, G. (2013a, May 1). Questor share tip: Balfour Beatty warning prompts dividend concerns. The Daily Telegraph. Retrieved from: http://www.telegraph.co.uk/finance/markets/questor/10028639/Questor-share- tip-Balfour-Beatty-warning-prompts-dividend-concerns.html [122] White, G. (2013b, July 9). Questor share tip: Kier Group soars as 2014 revenues looks secure. The Daily Telegraph. Retrieved from: http://www.telegraph.co.uk/finance/markets/questor/10169602/Questor-share-tip-Kier- Group-soars-as-2014-revenues-looks-secure.html [123] Whitelaw, J. (2015). Kier to buy Mouchel for £265M cash. Retrieved from: http://www.infrastructure- intelligence.com/article/apr-2015/kier-buy-mouchel-%C2%A3265m-cash [124] Xiao, H., & Proverbs, D. (2003). Factors influencing corporate performance: An international investigation. Engineering, Construction and Architectural Management, 10 (5), pp. 322-332. [125] Young, S. (2005). Earnings management and corporate governance. In: Clubb, C. (ed.). Accounting. The Blackwell encyclopedia of management (2nd ed.). Oxford: Blackwell Publishing Ltd., pp. 166-170.