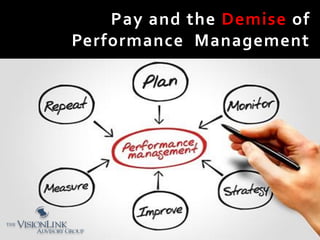
Pay and Demise of Performance Management
•
0 likes•207 views

Performance management is undergoing a revolution. Businesses around the world are adopting more flexible systems for appraising their employees. This new trend has likely left you a bit unsettled: "Should I follow this trend?" "If so, what approach is right for my company?" "How do I align my pay strategies with a less structured performance appraisal process?" "What are the performance metrics I should be managing?" If you find yourself grappling with these issues, you will not want to miss these slides! http://www.vladvisors.com/compensation-knowledge-center/webinars/pay-and-the-demise-of-performance-management

Recommended
Recommended
More Related Content
What's hot
What's hot (20)
Similar to Pay and Demise of Performance Management
Similar to Pay and Demise of Performance Management (20)
More from The VisionLink Advisory Group
More from The VisionLink Advisory Group (20)
Recently uploaded
Recently uploaded (20)
Pay and Demise of Performance Management
- 1. Pay and the Demise of Performance Management
- 2. 7700 Irvine Center Dr., Ste. 930 Irvine, CA 92618 (888) 703 0080 www.vladvisors.com www.phantomstockonline.com www.bonusright.com Founded in 1996 Over 450 Clients in North America
- 3. Vision: Help Businesses Build and Sustain a Performance Culture Accelerate performance capabilities by designing pay strategies that transform employees into growth partners.
- 4. If you do that… • Quality of talent will improve. • Employee engagement will expand. • Performance will be magnified. • Business growth will be accelerated. • Shareholder value will increase.
- 5. 55 Core Issues Business change is exponential. Performance management reinvention is one more symptom. Domino effect. Pay implications.
- 6. 66 Core Message Adapt or Die
- 7. 77 Let’s Assess Poll Question: How would you describe your current performance management or employee appraisal system? We follow a formal methodology. We use an informal, adaptive, flexible system. We have no performance management process.
- 8. 88 Headlines
- 9. 99 History Lesson Appraisals adopted by businesses grew out of the military’s merit system following WWI. Primary focus: weed out non-performers. 2000 Organizations got flatter, which dramatically increased the number of direct reports each manager had, making it harder to invest time in developing them. 2011 Kelly Services was the first big professional services firm to drop appraisals, and other major firms followed suit, emphasizing frequent, informal feed back. 2012 Adobe ended annual performance reviews, in keeping with the famous “Agile Manifesto” and the notion that annual targets were irrelevant to the way its business operated. 2016 Deloitte, PwC, and others that tried going numberless are reinstating performance ratings but using more than one number and keeping the new emphasis on developmental feedback.
- 10. 1010 What’s the Result? Old Systems Accountability for past behavior at the expense of improving current performance. Excessive time devoted to holding meetings, completing forms, creating ratings. Managers influenced by personal biases. Impact of appraisal on compensation influences feedback.
- 11. 1111 What’s Driving the Revolution? New Systems Emphasis on speed, agility and constant (ongoing learning). Focus on continuous building of the workforce. Emphasize mentoring and coaching instead of assessing and correcting. Transition from measuring performance to improving performance.
- 12. 1212 Case Study: Deloitte Three Objectives 1. Recognize performance 2. See performance 3. Fuel performance Source: Reinventing Performance Management, HBR, April 2015, Marcus Buckingham and Ashley Goodall
- 13. 1313 Recognize Performance Variable compensation tied to multiple data points (instead of a single rating). Conversations about performance tied to that data. What’s the most detailed view of you that we can gather and share? How does that data support a conversation about your performance? How can we equip our leaders to have insightful conversations? “Our question now is not ‘What is the simplest view of you?’ but ‘What is the richest?’ ”
- 14. 1414 See Performance Feedback comes from immediate team leader. Focus on leader’s feelings and intentions instead of rating team member skills. Evaluation at the end of a project or quarter—whichever came first.
- 15. 1515 See Performance Team Leader 4 Question Evaluation: 1. Given what I know of this person’s performance, and if it were my money, I would award this person the highest possible compensation increase and bonus [measures overall performance and unique value to the organization on a five-point scale from “strongly agree” to “strongly disagree”]. 2. Given what I know of this person’s performance, I would always want him or her on my team [measures ability to work well with others on the same five-point scale].
- 16. 1616 See Performance 3. This person is at risk for low performance [identifies problems that might harm the customer or the team on a yes-or-no basis]. 4. This person is ready for promotion today [measures potential on a yes- or-no basis].
- 17. 1717 See Performance “In effect, we are asking our team leaders what they would do with each team member rather than what they think of that individual. When we aggregate these data points over a year… we produce a rich stream of information for leaders’ discussions of what they, in turn, will do—whether it’s a question of succession planning, development paths, or performance-pattern analysis. “…the organization’s leaders can use the new data to review a targeted subset of employees (those eligible for promotion, for example, or those with critical skills) and can debate what actions Deloitte might take to better develop that particular group. In this aggregation of simple but powerful data points, we see the possibility of shifting…from talking about the ratings to talking about our people—from ascertaining the facts of performance to considering what we should do in response to those facts.”
- 18. 1818 Fuel Performance Focus on the trinity of purpose, expectations, and strengths. Every team leader to check in with each team member once a week. “These check-ins are not in addition to the work of a team leader; they are the work of a team leader.” Check-ins are initiated by the team member rather than by the team leader.
- 19. 1919 Fuel Performance “To support both people in these conversations, our system will allow individual members to understand and explore their strengths using a self-assessment tool and then to present those strengths to their teammates, their team leader, and the rest of the organization.”
- 20. 2020
- 21. 2121
- 22. 2222
- 23. 2323
- 24. 2424
- 25. 2525 3 Business Reasons for Eliminating Formal Performance Appraisals 1. The Return to People Development 2. The Need for Agility 3. The Centrality of Teamwork Source: The Performance Management Revolution, HBR, October 2016, Peter Cappelli & Anna Tavis
- 26. 2626 The Return to People Development Competitive pressure to upgrade talent management efforts. Employees in charge of their own growth. Requires rich and frequent feedback from supervisors ▪ Need better met by frequent, informal check-ins than by annual reviews.
- 27. 2727 The Return to People Development Compensation Implications: Construct pay strategies in a Total Rewards framework
- 28. 2828 Total Rewards Approach Compelling Future Positive Work Environment Opportunities for Personal and Professional Growth Financial Rewards
- 29. 2929 Compelling Future The company’s purpose and mine are aligned. I see myself in the company’s future. I have a “seat at the table” in determining the direction of the company. I like the direction the company is headed. I embrace the company’s values. I believe the company can achieve its growth goals.
- 30. 3030 Positive Work Environment I like the nature of the work I’m doing. I am working within my unique ability. My responsibilities have strategic purpose. I work in a team of individuals with complementary skills. There are channels and processes for solving problems and decision making.
- 31. 3131 Personal and Professional Development As a result of my immersion in the culture and resources of this organization, my unique abilities will improve—and I will experience personal and professional fulfillment.
- 32. 3232 Financial Rewards I have some control over how much I can earn if I produce. I feel a sense of partnership with ownership. There is a philosophy that guides pay decisions and I relate to it. There is a mechanism for sharing value with those who help produce it.
- 33. 3333 Drive “Pay people adequately and fairly, get the issue of money off the table, then give them lots of autonomy.”
- 35. 3535 Total Rewards Approach Compelling Future Purpose Positive Work Environment Autonomy Opportunities for Personal and Professional Growth Mastery & Purpose Financial Rewards Partnership
- 36. 3636 The Need for Agility Rapid innovation is a source of competitive advantage which means future needs are continually changing. Projects are short-term and tend to change along the way, so employees’ goals and tasks can’t be plotted out a year in advance with much accuracy. “Because organizations won’t necessarily want employees to keep doing the same things, it doesn’t make sense to hang on to a system that’s built mainly to assess and hold people accountable for past or current practices.”
- 37. 3737 The Need for Agility Compensation Implications: Create a rewards strategy that is flexible but enduring and build an agile operational structure to manage it.
- 38. 3838 Flexible but Enduring Look at compensation strategy as you would an investment portfolio. Individual pay components are your “asset classes.” As things change, adjust weighting of each asset class.
- 39. 3939 Salary Performance Incentives Sales Incentives Growth Incentives Core Health & Welfare Plans Executive Benefit Plans Qualified Retirement Plans Nonqualified Retirement Plans Salaries Competitive with market standards? Tied to strong performance management process (merit)? Managed within a flexible but effective structure? Performance Incentives Tied to productivity gains? Clear, achievable and meaningful? Self-financing? Sales Incentives Challenging yet achievable? Reinforcing the right behaviors? Differentiating your offering? Growth Incentives Linked to a compelling future? Supporting an ownership mentality? Securing premier talent? Core Benefits Responsive to today’s employee marketplace? Allocating resources where most needed? Evaluated to eliminate unnecessary expense? Executive Benefits Flexible enough to address varying circumstances? Communicating a unique relationship? Reducing employee tax expense? Qualified Retirement Plans Giving employees an opportunity to optimize retirement values? Operated with comprehensive fiduciary accountability? Avoiding conflicts and minimizing expenses? Nonqualified Retirement Plans Optimizing tax-deferral opportunities? Aligning long-term interests of employees with shareholders? Structured to receive best possible P&L impact? Compensation “Asset Classes”
- 40. 4040 Form of Pay Purpose Standard Investment ROI Salaries Provide for the current cash needs of our executives 40-50th percentile for peer group $500,000 Achieve ROA standard of 0.75% Short-term Incentives Enhance current cash payments to executives for achieving top and bottom line annual goals 30-40% of base salary $168,000 (Target) 15% revenue growth and 12% margin Long-term Incentives (Cash) Retain execs; focus them on long- term earnings growth; align with shareholder interests; meet wealth accumulation needs 15-20% of base salary $84,000 (Target) Long-term growth in earnings (double earnings = share 13% of new value) Long-term Incentives (Equity) Retain execs; focus them on long- term earnings growth; align with shareholder interests; meet wealth accumulation needs 15-20% of base salary $84,000 (Target) Long-term growth in earnings (double earnings = share 13% of new value) Core Benefits Meet basic security needs of the executives 50th percentile for peer group $25,500 ROA of 0.75% Executive Benefits Enhance basic security needs and meet market standards for perquisites 50th percentile for peer group $24,000 ROA of 0.75% Qualified Retirement Provide wealth accumulation opportunity for executives 40th percentile (3% of salary) $15,000 ROA of 0.75% Supplemental Retirement Strengthen rewards value proposition to help recruit and retain executives; meet wealth accumulation needs 30th percentile compared to banks that have plans $135,000 ROA of 0.9%
- 41. 4141 Build a Total Compensation Structure A total compensation structure gives you a comprehensive view of all compensation and benefit plans and ensures operational integrity.
- 42. 4242 The Total Compensation Structure Min Mid Max 1 203,531 271,375 339,219 50.0% 100% 50% 50% 5% Yes 5% $11,141 Unlimited Unlimited 15,000 20,000 2 150,078 200,103 250,129 35.0% 75% 50% 50% 5% Yes 5% $11,141 Unlimited Unlimited 10,000 12,500 3 119,497 159,329 199,161 25.0% 50% 100% 0% 5% Yes 5% $11,141 25 5 5,000 8,000 4 102,632 136,843 171,054 20.0% 25% 100% 0% 5% $6,127 25 5 5,000 5 81,293 101,616 121,940 15.0% 5% $6,127 25 5 5,000 6 69,720 87,150 104,580 15.0% 5% $6,127 15 5 7 58,564 73,205 87,846 10.0% 5% $6,127 15 5 8 50,176 62,720 75,264 10.0% 5% $6,127 15 5 9 44,038 51,809 59,580 5.0% 5% $6,127 15 5 10 37,211 43,777 50,344 5.0% 5% $6,127 10 5 11 30,784 36,217 41,649 5.0% 5% $6,127 10 5 12 23,562 27,720 31,878 5.0% 5% $6,127 10 5 13 19,529 22,975 26,421 0.0% 5% $6,127 10 5 14 17,354 20,417 23,479 0.0% 5% $6,127 10 5 Annual Car Allow Grade/ Band Sick Days Salary Range Bonus Target LTIP Target Financial Planning Perk Deferred Comp Elegible Deferred Comp Max Match 401k Match Max % Vacation Days % Phantom Stock FV % Phantom Stock AO Health, Dental, Life
- 43. 4343 Creating a Balance Total Compensation Structure Name Title/Position Tier Salary Short-term Incentive Target Long-term Incentive Target Total Direct Comp H&W Annual Value QRP Annual Value Security Plans Annual Value Total Indirect Comp TRI Jason Smith CEO 1 $ 300,000 $ 120,000 $ - $ 420,000 $ 18,200 $ 8,000 $ - $ 26,200 $ 446,200 Lucy Jones VP Marketing 2 $ 210,000 $ 45,000 $ - $ 255,000 $ 16,200 $ 7,000 $ - $ 23,200 $ 278,200 Rick Miller VP Sales 2 $ 160,000 $ 85,000 $ - $ 245,000 $ 9,200 $ 6,000 $ - $ 15,200 $ 260,200 Janice Johnson CFO 2 $ 195,000 $ 40,000 $ - $ 235,000 $ 10,200 $ 5,000 $ - $ 15,200 $ 250,200 Maria York Director 3 $ 160,000 $ 10,000 $ - $ 170,000 $ 12,200 $ 4,000 $ - $ 16,200 $ 186,200 Frank North Director 3 $ 150,000 $ 10,000 $ - $ 160,000 $ 11,200 $ 3,000 $ - $ 14,200 $ 174,200 Ricardo South Director 3 $ 140,000 $ 10,000 $ - $ 150,000 $ 7,700 $ 2,000 $ - $ 9,700 $ 59,700 Simon Lewis Director 3 $ 130,000 $ 10,000 $ - $ 140,000 $ 8,700 $ 2,500 $ - $ 11,200 $ 151,200 $ 1,445,000 $ 330,000 $ - $ 1,775,000 $ 93,600 $ 37,500 $ - $ 131,100 $ 1,906,100 How are these values determined? Why no LTI to balance the STI? Should we be addressing these needs?
- 44. 4444 The Centrality of Teamwork Moving away from forced ranking and from appraisals’ focus on individual accountability makes it easier to foster teamwork. The application of “promised-based management” principles.
- 45. 4545 The Centrality of Teamwork Compensation Implications: Focus on value-creation and value sharing tied to a balance of company and team performance.
- 46. 4646 How Do You Define Value Creation? Calculate Your Productivity Profit
- 47. 4747 Productivity Profit Example: Item Amount Capital Account $20,000,000 Cost of Capital 12% Capital Charge $2,400,000 Operating Income $10,000,000 Productivity Profit $7,600,000 Total Rewards Investment $25,000,000 ROTRI™ 30.4% (ROTRI™ = Productivity Profit/Total Rewards Investment)
- 48. 4848 Productivity Profit Example: Item Figure Capital Account $20,000,000 Cost of Capital 12% Capital Charge $2,400,000 Operating Income $10,000,000 *Productivity Profit $7,600,000 Total Rewards Investment $25,000,000 ROTRI™ 30.4% (ROTRI™ = Productivity Profit/Total Rewards Investment) *Variable Pay Plans (Value Sharing) are financed from Productivity Profit
- 49. 4949 Balanced Incentives Short-Term Incentives Reward profitable revenue engine performance Long-Term Incentives Reward sustained growth and profitability
- 50. 5050 Incentives: Basic Construct All employees are told they will share in the creation of company value Every employee has a defined incentive opportunity aligned to forecasted company results Base – Minimum performance Target - Forecast Superior - Overachievement
- 51. 5151 Incentive Calculation Actual incentive can be tied to actual company performance. If company results are halfway between Base and Target. Incentives will be calculated halfway between Base and Target Actual Results = $47,500,000 Calculated Incentive = $5,625
- 52. 5252 Planning Weighting/Allocation Pool allocation to plan participants contingent on: Company Performance – Employees should have all or a majority portion of their bonus based on company performance Org Unit Performance – A portion of an employee’s bonus can be allocated based on department, location, division, or business unit
- 53. 5353 Planning Weighting/Allocation Make overall company performance the primary objective (e.g. ~60 - 100%) Organizational unit success should be secondary objective (e.g. ~40 - 10%) Weight the overall incentive:
- 54. 5454 Individual Performance Trend is to de-emphasize personal performance Performance Management Managers more likely to be honest about performance if incentives are not directly correlated to performance rating If performance is deemed “unacceptable” discretion can be exercised to eliminate incentive payment
- 55. 5555 Growth Incentives (Value Sharing)
- 56. 5656 Select the Right Plan Type Stock Option Performance Shares Restricted Stock Phantom Stock Option Performance Phantom Stock Phantom Stock Profit Pool Performance Unit Strategic Deferred Compensation
- 57. 5757 Grant Equity or Not Equity? Full Value or Appreciation Only? Yes Appreciation Stock Option Full Value Performance Based? Yes Performance Shares No Restricted Stock No Reward for Value Increase or Financial Performance? Value Increase Full Value or Appreciation? Appreciation Phantom Stock Option Full Value Performance Based? Yes Performance Phantom Stock No Phantom Stock Financial Performance Appreciation- Performance Based or Employee Directed? Performance Based Reward for Profit/Cash Flow or Other Metrics? Profits Allocation or Objectives Based? Allocation Profit Pool ObjectivesOther Metrics Performance Unit Employee Directed Strategic Deferred Compensation
- 58. 5858 Define Your Performance Framework Business Framework Talent Framework Compensation Framework
- 59. 5959 Business Framework Phase One Define Growth Expectations (Vision) ▪ Key outcomes that must be achieved Define Business Model and Strategy ▪ Performance Engine ▪ How the company will compete ▪ Where are growth opportunities? Identify Roles and Expectations ▪ Establish Performance Criteria ▪ Define “Success” Business Framework
- 60. 6060 Compensation Framework Phase Two Establish a pay philosophy ▪ Expansive vs. Selective—or Hybrid ▪ Define what the company is willing to pay for Engineer a pay strategy ▪ Structure ▪ Mindset Adopt a “Total Rewards” Approach Compensation Framework
- 61. 6161 Talent Framework Phase Three Identify Key Producers ▪ Meeting “success” standards Identify Talent “Gaps” ▪ Recruiting Strategy Communicate Expectations ▪ Define success Communicate Rewards ▪ Philosophy ▪ Programs ▪ Value Statement Talent Framework
- 62. 6262 So What Do We Conclude? Formal appraisals are being replaced by ongoing conversations. Team member assessments are focused on improving performance and shaping the future company. Compensation must support people development and teamwork while being agile yet enduring. Companies need a performance framework.
- 63. 6363 Today’s Presenter: Ken Gibson SeniorVice President (949) 265-5703 kgibson@vladvisors.com 7700 Irvine Center Drive, Suite 930 Irvine, CA 92618 949-852-2288 www.VLadvisors.com www.PhantomStockOnline.com ThankYou!