More Related Content
Similar to Export of castor oil 2017 18-website (20)
More from Solvent Extractors' Association of India (20)
Export of castor oil 2017 18-website
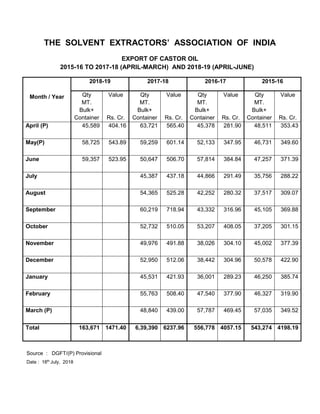
- 1. THE SOLVENT EXTRACTORS’ ASSOCIATION OF INDIA
EXPORT OF CASTOR OIL
2015-16 TO 2017-18 (APRIL-MARCH) AND 2018-19 (APRIL-JUNE)
Month / Year
2018-19 2017-18 2016-17 2015-16
Qty
MT.
Bulk+
Container
Value
Rs. Cr.
Qty
MT.
Bulk+
Container
Value
Rs. Cr.
Qty
MT.
Bulk+
Container
Value
Rs. Cr.
Qty
MT.
Bulk+
Container
Value
Rs. Cr.
April (P) 45,589 404.16 63,721 565.40 45,378 281.90 48,511 353.43
May(P) 58,725 543.89 59,259 601.14 52,133 347.95 46,731 349.60
June 59,357 523.95 50,647 506.70 57,814 384.84 47,257 371.39
July 45,387 437.18 44,866 291.49 35,756 288.22
August 54,365 525.28 42,252 280.32 37,517 309.07
September 60,219 718.94 43,332 316.96 45,105 369.88
October 52,732 510.05 53,207 408.05 37,205 301.15
November 49,976 491.88 38,026 304.10 45,002 377.39
December 52,950 512.06 38,442 304.96 50,578 422.90
January 45,531 421.93 36,001 289.23 46,250 385.74
February 55,763 508.40 47,540 377.90 46,327 319.90
March (P) 48,840 439.00 57,787 469.45 57,035 349.52
Total 163,671 1471.40 6,39,390 6237.96 556,778 4057.15 543,274 4198.19
Source : DGFT/(P) Provisional
Date : 18th
July, 2018