1. Highlights
• >390Mt maiden Resource for Accent’s 100% owned Magnetite Range Iron Ore (magnetite) Project
• Potential for a 20 year mine life; additional upgrade drilling is expected to add to project scale
• This is a high category Resource classification, with more than 70% already in the Indicated category
• Indicated Mineral Resources can be included in Ore Reserve estimates
• Most of the Resource comprises low sulphur variants that have been subject to extensive testwork
• Extensive metallurgical testwork and engineering activities continue
• Pre‐feasibility study activities & Ore Reserve estimation are likely to proceed in the coming months
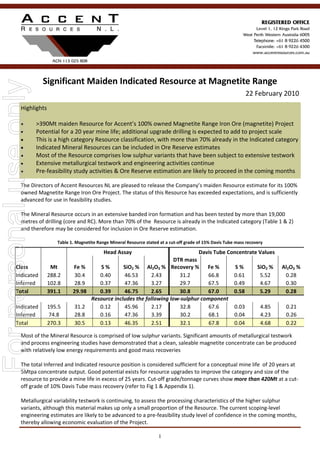
Significant Maiden Indicated Resource at Magnetite Range
22 February 2010
The Directors of Accent Resources NL are pleased to release the Company’s maiden Resource estimate for its 100%
owned Magnetite Range Iron Ore Project. The status of this Resource has exceeded expectations, and is sufficiently
advanced for use in feasibility studies.
The Mineral Resource occurs in an extensive banded iron formation and has been tested by more than 19,000
metres of drilling (core and RC). More than 70% of the Resource is already in the Indicated category (Table 1 & 2)
and therefore may be considered for inclusion in Ore Reserve estimation.
Table 1. Magnetite Range Mineral Resource stated at a cut‐off grade of 15% Davis Tube mass recovery
Most of the Mineral Resource is comprised of low sulphur variants. Significant amounts of metallurgical testwork
and process engineering studies have demonstrated that a clean, saleable magnetite concentrate can be produced
with relatively low energy requirements and good mass recoveries
The total Inferred and Indicated resource position is considered sufficient for a conceptual mine life of 20 years at
5Mtpa concentrate output. Good potential exists for resource upgrades to improve the category and size of the
resource to provide a mine life in excess of 25 years. Cut‐off grade/tonnage curves show more than 420Mt at a cut‐
off grade of 10% Davis Tube mass recovery (refer to Fig 1 & Appendix 1).
Metallurgical variability testwork is continuing, to assess the processing characteristics of the higher sulphur
variants, although this material makes up only a small proportion of the Resource. The current scoping‐level
engineering estimates are likely to be advanced to a pre‐feasibility study level of confidence in the coming months,
thereby allowing economic evaluation of the Project.
1
Head Assay
Class Mt Fe % S % SiO2 % Al2O3 %
DTR mass
Recovery % Fe % S % SiO2 % Al2O3 %
Indicated 288.2 30.4 0.40 46.53 2.43 31.2 66.8 0.61 5.52 0.28
Inferred 102.8 28.9 0.37 47.36 3.27 29.7 67.5 0.49 4.67 0.30
Total 391.1 29.98 0.39 46.75 2.65 30.8 67.0 0.58 5.29 0.28
Davis Tube Concentrate Values
Indicated 195.5 31.2 0.12 45.96 2.17 32.8 67.6 0.03 4.85 0.21
Inferred 74.8 28.8 0.16 47.36 3.39 30.2 68.1 0.04 4.23 0.26
Total 270.3 30.5 0.13 46.35 2.51 32.1 67.8 0.04 4.68 0.22
Resource includes the following low‐sulphur component
Forpersonaluseonly
2. Low Sulphur
Head Assay
Mt Fe % S % SiO2% Al2O3 %
Mass
Recovery
%
Fe % S % SiO2 % Al2O3 % LOI % P % FeO %
Fresh
Indicated 163.8 31.1 0.11 45.93 2.09 34.44 67.8 0.04 4.74 0.20 ‐2.52 0.014 24.61
Inferred 64.3 28.7 0.16 47.32 3.46 31.07 68.1 0.04 4.31 0.26 ‐2.50 0.013 24.00
Total 228.0 30.5 0.13 46.32 2.48 33.49 67.9 0.04 4.62 0.22 ‐2.51 0.014 24.44
Transition
Indicated 31.7 31.3 0.15 46.16 2.58 24.37 66.7 0.02 5.40 0.24 ‐2.52 0.014 24.61
Inferred 10.5 29.2 0.15 47.61 2.99 24.93 68.3 0.03 3.70 0.26 ‐2.50 0.013 24.00
Total 42.2 30.8 0.15 46.52 2.68 24.51 67.1 0.02 4.98 0.24 ‐2.51 0.014 24.44
Total
Indicated 195.5 31.2 0.12 45.96 2.17 32.80 67.7 0.03 4.85 0.21 ‐2.52 0.014 24.61
Inferred 74.8 28.8 0.16 47.36 3.39 30.21 68.1 0.04 4.23 0.26 ‐2.50 0.013 24.00
Total 270.3 30.5 0.13 46.35 2.51 32.09 67.8 0.04 4.68 0.22 ‐2.51 0.014 24.44
Medium
Sulphur
Fresh
Indicated 66.5 28.9 0.43 47.50 2.95 27.97 65.0 0.67 7.09 0.41 ‐2.17 0.018 27.72
Inferred 21.4 29.4 0.44 47.18 2.87 28.98 66.2 0.66 5.79 0.37 ‐2.28 0.015 27.29
Total 87.9 29.0 0.43 47.42 2.93 28.21 65.3 0.66 6.77 0.40 ‐2.20 0.018 27.61
Transition
Indicated 0.6 29.3 0.52 47.64 2.69 22.63 67.3 0.51 5.63 0.32 ‐2.17 0.018 27.72
Inferred 0.2 30.1 0.35 47.56 2.13 23.10 68.5 0.50 3.76 0.20 ‐2.28 0.015 27.29
Total 0.8 29.5 0.48 47.62 2.56 22.74 67.6 0.51 5.19 0.29 ‐2.20 0.018 27.61
Total
Indicated 67.1 28.9 0.43 47.50 2.95 27.92 65.0 0.67 7.08 0.40 ‐2.17 0.018 27.72
Inferred 21.6 29.4 0.44 47.18 2.86 28.92 66.2 0.65 5.77 0.37 ‐2.28 0.015 27.29
Total 88.7 29.0 0.43 47.42 2.92 28.16 65.3 0.66 6.76 0.40 ‐2.20 0.018 27.61
High Sulphur
Fresh
Indicated 25.6 28.1 2.46 48.34 3.06 27.32 65.3 4.91 6.55 0.47 ‐1.97 0.016 27.20
Inferred 6.5 28.5 2.61 47.92 3.18 27.10 65.5 5.18 6.12 0.46 ‐1.96 0.014 27.35
Total 32.1 28.2 2.49 48.25 3.09 27.28 65.4 4.96 6.46 0.47 ‐1.97 0.016 27.23
Transition
Indicated 0.0 28.9 1.05 47.96 2.48 25.41 66.7 4.36 6.38 0.26 ‐1.97 0.016 27.20
Total 0.0 28.9 1.05 47.96 2.48 25.41 66.7 4.36 6.38 0.26 ‐1.97 0.016 27.23
Total
Indicated 25.6 28.1 2.46 48.34 3.06 27.32 65.3 4.91 6.55 0.47 ‐1.97 0.016 27.20
Inferred 6.5 28.5 2.61 47.92 3.18 27.10 65.5 5.18 6.12 0.46 ‐1.96 0.014 27.35
Total 32.1 28.2 2.49 48.25 3.09 27.27 65.4 4.96 6.46 0.47 ‐1.97 0.016 27.23
Total
Fresh
Indicated 255.8 30.3 0.43 46.58 2.41 32.05 66.8 0.69 5.53 0.28 ‐2.39 0.015 25.56
Inferred 92.1 28.9 0.40 47.33 3.30 30.31 67.5 0.55 4.78 0.30 ‐2.42 0.013 24.91
Total 348.0 29.9 0.42 46.78 2.65 31.59 67.0 0.65 5.33 0.29 ‐2.40 0.015 25.39
Transition
Indicated 32.4 31.3 0.16 46.19 2.59 24.34 66.7 0.04 5.40 0.24 ‐2.39 0.015 25.56
Inferred 10.7 29.2 0.15 47.60 2.97 24.89 68.3 0.03 3.71 0.25 ‐2.42 0.013 24.91
Total 43.1 30.8 0.16 46.54 2.68 24.47 67.1 0.04 4.98 0.24 ‐2.40 0.015 25.39
Total
Indicated 288.2 30.4 0.40 46.53 2.43 31.18 66.8 0.61 5.52 0.28 ‐2.39 0.015 25.56
Inferred 102.8 28.9 0.37 47.36 3.27 29.74 67.5 0.49 4.67 0.30 ‐2.42 0.013 24.91
Total 391.1 30.0 0.39 46.75 2.65 30.80 67.0 0.58 5.29 0.28 ‐2.40 0.015 25.39
Davis Tube Concentrate Values
Mineral Resource Statement.
The Mineral Resource Estimate is reported in accordance with the 2004 edition of the Australasian Code for the reporting of Exploration
Results, Mineral Resources and Ore Reserves (JORC code).
The Mineral Resource is jointly reported by Accent Resources NL (ACS) and Micromine Consulting Pty Ltd, with competent person sign‐off
from each party.
ACS supplied the drillhole database, which consisted of drillhole collar location, survey, lithology and assay data in MICROMINE file format.
Information on the current topographic datum and modeled mineralised units was also supplied in the form of wireframe models. Micromine
Consulting assisted with construction of wireframed geological boundaries.
Micromine Consulting reviewed the analytical database and conducted 3D resource modeling, block model development, grade interpola‐
tion, model validation and geological resource reporting. The resource estimation has been prepared in accordance with JORC Code require‐
ments in respect to the methodology applied. Micromine Consulting reviewed the QA/QC procedures provided in the report prepared by
Hazelwood Resources and did not find concerns related to the quality of the data used for the resource estimation study. Resource estima‐
tion is based on the 3D digital interpretation of mineralised envelopes, followed by the geostatistical analysis and grade interpolation of the
mineralised envelopes.
Table 1. Magnetite Range Mineral Resource Statement at a cut‐off of 15% Davis Tube mass recovery
2
Forpersonaluseonly
4. 1
Appendix 1
Magnetite Range Project – JORC Mineral Resource Information February 2010
1. Style of Mineralisation
The magnetite mineralization at the Magnetite Range Project is contained within NW and WNW striking
banded iron formation (BIF) units within the Retaliation Greenstone Belt of the Murchison Province. The
BIF units extend for over 14km of strike within tenement E59/875 and have a sub vertical dip in the south and
can range from shallow dipping to approx. 50 NE dip in the north. The BIF unit is up to 400m true thickness.
2. Drilling
Historic drilling in the Magnetite Range Project area targeted gold mineralization and was not utilized
during recent magnetite exploration. Two iron exploration diamond drill holes (KH-17 and KH-19)
completed in the Hematite Hill prospect area in 1970 were located in the field and used for the planning of
recent drilling. These holes are not part of the resource database.
Accent Resources NL (Accent) completed 128 drill holes for 19,089m at Magnetite Range between 2006
and December 2009. This includes 83 RC (8,546m), 33 diamond (7,357m) and 12 RC pre collared
diamond tail (3,186m) holes. All holes are summarized in Table 1.
Table 1: Magnetite Range Project Drill Holes
Operator and Year Prospect Drill Hole_ID Type Diameter Holes Total
metres
Pacific Consolidated
1970
Hematite
Hill
KH-17 & KH-19 Core BXWL? 2 368.9
Accent 2006 Regional MGRC001 to 017 RC 5.5” 17 1,524
Accent 2008
Regional &
Resource
MGRC018 to 068 RC 5.5” 51 5,594
Accent 2008
Regional &
Resource
MGD001 to 017 Core HQ2 17 3,290.74
Accent 2009
Resource
MGRC069 to 095 RC 5.5” 15 1,428.00
Accent 2009
Resource
MGD018 to 033 Core HQ / NQ 16 4,066.20
Accent 2009
Resource
MGRD069 - 092 RC
Core
5.5” / HQ2 /
NQ2
12 3,186.35
128 19,089.29
Forpersonaluseonly
5. 2
Drill coverage and orientation varies across the project area. Drilling in the south (Local Grid_ID - MR
South) was completed on a nominal Azimuth of 240 (or 060) Magnetic on sections 200m to 1150m apart.
The Hematite Hill prospect in the south was drilled on nominal 200 – 300m x 50 - 100m drill spacing.
Drilling in the north (Local Grid_ID – MR North) was completed on a nominal Azimuth of 210 Magnetic on
sections 200 – 450m apart. The Julia prospect was drilled on nominal 200m x 40 – 80m drill spacing.
3. Sampling
All holes have a hard copy Drillhole Header Sheet and pre numbered Sample Data Sheet which was
completed in the field to manage sample collection. The sheet records details of sample_ID’s and
intervals as well as field duplicates (FDUP - RC only) and Certified Reference Material (STD). FDUP and
STD were collected at a nominal frequency of 1:20 samples.
All field data was entered into MS Excel spreadsheets for upload into a MS Access relational data base.
All hardcopy sheets are retained in archive.
3.1 Core Recovery and Handling
During core drilling an additional four hard copy field sheets were completed. These were the Diamond
Drill Log (Lithology), Diamond Drill Geotechnical Logging (core recovery and RQD), Diamond Drill
Structural Logging (alpha / beta data) and Bulk Density (Immersion method - dry, wet damp mass)
sheets. Magnetic Susceptibility readings at 10cm intervals were collected for drill holes MGD001 to 018.
Alpha beta structural geology data was converted to true and apparent (section) dip and dip direction
using Geocalculator software.
Standard core handling procedures were adopted including core reassembly and mark up from driller’s
core blocks and orientation marks. High definition wet and dry core tray photographs of uncut core were
taken.
3.2 Core Sampling
Nominal 4m composite core assay samples, occasionally adjusted to fit geological boundaries, were
collected from either half or quarter core sampling. All core cutting was completed with an Almonte
automatic core saw along a marked Reference Line. Standard work practices included sampling to the
same side of the orientation line for each sample collected.
Excellent core recovery in excess of 98% was consistently recorded. Remaining core is securely retained
in covered galvanized core trays on wooden pallets for reference and future check or metallurgical
sampling. Laboratory sample preparation rejects (bulk pulp, bulk rejects) for early 2008 core drilling were
mistakenly discarded but late 2008 and all 2009 drill material is available for future use.
3.3 RC Sample Quality & Recovery
RC drilling was monitored to produce maximum sample recovery and consistent quality. During RC
drilling additional field hard copy RC Drill Log (lithology), and a Magnetic Susceptibility and Sampling
Record, were completed. The Sampling Record recorded magnetic susceptibility (1m readings taken on
top of green RC bag), sample quantity (qualitative measure of sample volumes in each 1m RC bag –
Large, Average, Small), sample condition (Dry, Damp, Wet) and comments (record of water flow, position
of water table, potential contamination, any difficulties or other relevant information occurring during
drilling).
Forpersonaluseonly
6. 3
The qualitative recording of sample quantity indicated a generally consistent volume of sample delivered
from the cyclone. Sample bags were generally well filled. Some RC drilling in the Hematite Hill prospect
area intersected minor cavities but no continued loss of sample occurred. Sample loss in the upper two
metres, due to loss of circulation at the collar, was minor and is not considered important as it coincides
with transported cover and soils, or within strongly weathered BIF. The RC drillers were able to maintain
dry sampling for almost all drilling with less than 2% of RC samples recorded as Wet. Wet assay samples
were taken with a spear or allowed to dry before riffle splitting.
The RC drill rig cyclones were cleaned at the start of every hole. During drilling each metre sample was
allowed to clear through the sampling system before the next metre was drilled. Cross sample
contamination (“smearing”) was rarely noted and is not considered to be likely.
3.4 RC Sampling
All RC drilling was completed using face sampling percussion hammers and combined cyclone / 3 tier
stacked riffle splitter that was attached to the drill rig. Washed chip trays for each metre of RC drilling are
retained for geological reference.
RC drilling during 2006 produced 1m bulk green RC bags from the combined cyclone / 3 tier stacked riffle
splitter that was attached to the drill rig. Assay samples were 2m composite intervals derived by sample
spear sampling.
RC drilling during 2008 produced 1m bulk green sample bags and 1m calico bags from the combined
cyclone / 3 tier stacked riffle splitter that was attached to the drill rig. Assay samples were 2m composite
intervals, derived by sample spear sampling of 1m interval calico bags. Difficulties were encountered in
collecting equivalent mass 1m drill calico bags as the adjusting choke mechanism on the combined
cyclone riffle splitter was either inoperative or missing. The RC sampling procedure detailed below (4m
composite assay samples of 1m bulk green RC bags) was adopted towards the end of the 2008 drill
programme.
RC drilling during 2009 produced 1m bulk green sample bags and 1m calico bags from the combined
cyclone / 3 tier stacked riffle splitter that was attached to the drill rig. Assay samples submitted were either
riffle split 1m (near surface “hematite” sampling) or 4m composite intervals collected on an equal weight
basis. The mass of 1m calico drill bags collected with this set up was variable and considerable
supervision was required by field staff and drilling crew to monitor quality and consistency. The nominal
2.5 to 3 kg 1m and 4m composite assay samples were therefore all collected by manual riffle splitting of
the 1m bulk green plastic sample bags.
Riffle split archive samples (10 or 15kg for each 2m or 1m sample interval) were retained of all BIF
intervals. Composite 4m samples of many hanging and footwall lithologies were also collected and
archived. All RC archive samples are secured in sealed 44 gallon steel drums. Laboratory sample
preparation rejects (bulk pulp, bulk rejects) for earlier 2006 and 2008 RC drilling were mistakenly
discarded but late 2008 and all 2009 material has been retained for future reference.
Forpersonaluseonly
7. 4
4. Assaying
Magnetite iron characterisation requires the determination of percentage magnetic material recovered
from a Davis Tube test (DTR_Recovery%) followed by XRF analysis of the Davis Tube concentrate and
whole rock sample (head assay) for the same interval.
4.1 Davis Tube Recovery (DTR) Test Work
Davis Tube Recovery (DTR) test work was completed at two laboratories, namely Nagrom - Kelmscott
(2006 & 2008 programmes) and Amdel - Canning Vale (2009 programmes). The 2006 and 2008 assay
samples were initially submitted to Ultratrace – Canning Vale for XRF glass fusion head (whole rock)
assaying and the DTR sample intervals selected later on the basis of head assay Fe and field Magsus
readings. In the 2009 programme DTR and head assaying were completed concurrently by merged
Amdel - Ultratrace laboratory on samples selected by visual field logging and Magsus.
A total of 2,541 samples were tested to determine the percent Weight Recovery of magnetic material and
assay of the magnetic material (DT concentrate).
4.1.1 DTR Preparation
The bulk of the laboratory sample preparation rejects (bulk pulp, bulk rejects) for earlier 2006 and part of
the 2008 RC drilling were mistakenly discarded before DTR analysis was completed. Nagrom were only
able to be supplied with approx. 150 gram archive pulp packets from previous whole rock assays. These
pulps had been prepared to a 90% passing size of 100 microns at Ultratrace, and subject to their grind
monitoring protocol. The pulp was tested according to Accent specification MRDTR002 which was for a
riffle split 30 gram feed charge of screened -75µm material with two passes through a 40mm diameter
Eriez Davis Tube fed with a vibratory feeder. The required feed size of P80 = 45 microns was achieved.
The DTR test work completed by Amdel on all 2009 drill samples used the staged grinding and wet
screening method to achieve a controlled grind size of P98 = 75µm. A target grind size of P80 = 45µm
was achieved. A single pass Davis Tube test on a 20 gram charge was completed using a 35mm
diameter Davis Tube.
4.1.2 DTR Assay
Further to the determination of DTR_Recovery% the DT concentrate was assayed by XRF glass fusion
using a 12:22 flux to establish elemental composition of the concentrate. Elements assayed were Fe_C%
(LLD 0.01%), SiO2_C% (LLD 0.01% ), Al2O3_C% (LLD 0.01%), TiO2_C% (LLD 0.01%), MnO_C% (LLD
0.01%), CaO_C% (LLD 0.01%), P_C% (LLD 0.001%), S_C% (LLD 0.001%), MgO_C% (LLD 0.01%),
K2O_C% (LLD 0.01%), Na2O (LLD 0.01%). Almost 90% of the XRF concentrate assays from all drill
programmes were completed at Amdel - Ultratrace.
Loss of ignition (LOI1000) was determined gravimetrically on dry samples ignited at 1000 . Ferrous iron
FeO was determined by volumetric titration in a sulphuric / hydrofluoric acid digest. Ferrous iron cannot
be analyzed on high sulphur samples so these are not reported. Satmagan measurement (Fe3O4
Satmagan) was completed on all 2009 drill samples, but played no useful role in resource estimation.
Forpersonaluseonly
8. 5
4.2 Whole Rock Head Assay
All whole rock samples were assayed at Ultratrace. The assay suite was identical to the DT concentrate
listed above, namely XRF glass fusion (11 elements), LOI1000, FeO and Fe3O4 Satmagan. (Satmagan
method was not used on all samples and was not applicable for resource estimation purposes).
5. Quality Assurance & Quality Control
Standard QAQC procedures such as FDUP and Certified Reference Materials were introduced towards
the end of the 2008 RC and diamond drill programme. It is noted that the same field staff and head
assay laboratory (Ultratrace) were used in all post‐2006 drilling programmes, just the RC composite
sample procedures were different.
Standard QAQC procedures have been followed. These include submission and monitoring of Field
Duplicates (where RC is involved), Lab Duplicates, Lab Repeats, Certified Reference Material
(Standards), Laboratory Internal Standards and where available Satmagan. Inter laboratory checks and
grind size monitoring was completed on selected DTR samples.
5.1 Certified Reference Materials – Monitoring of Accuracy
The preparation of DTR weight recovery standards is difficult due to the problem of providing
homogeneous sub-samples with a constant grain size distribution. This means that the laboratory
accuracy for DTR_Recovery cannot be confirmed unequivocally.
Two sets of Certified Reference Materials (CRM), with independently derived assay statistics (mean,
standard deviation) were used to measure the accuracy of reported head assay analyses. Approximately
50 gram CRM samples in heat sealed plastic sachets were purchased from Geostats Pty Ltd (Perth) and
inserted every 20th
RC sample. Control charts indicate very good analytical accuracy, taken to occur
within limits of Mean plus or minus 2 Standard Deviations.
Analytical accuracy was also monitored with the use of Internal Laboratory Standards at Amdel. Good
analytical accuracy is indicated.
5.2 Duplicates and Repeats – Monitoring of Precision and Bias
Field duplicates (FDUP) are principally a measure of field RC sampling collection procedures but also test
analytical precision. The FDUP were collected at a nominal frequency of 1:20 and derived from a riffle
split of the 4m composite assay sample that was itself derived by riffle splitting of 1m bulk green RC bags.
Lab Duplicates (LDUP) are routinely generated duplicate preparations and analysis of pulp material,
completed for both Davis Tube and whole rock samples. These were completed at a nominal frequency
of 1:20 at both Amdel and Nagrom.
Lab Repeat (LREP) are routinely generated repeat, or second, glass fusion disc produced from the same
pulp split at a frequency varying between 1:12 to 1:30 at Amdel.
Scatter plots with regression lines all indicated good repeatability of assay pairs, consistent over the full
assayed grade range. No bias was noted, scatter was generally well less than 10% with some infrequent
outliers (5 of 51 pairs – 10%) in the FDUP data. The data provides good assurance that FDUP data is not
affected by field sampling error and that the laboratories have achieved high precision.
Forpersonaluseonly
9. 6
5.3 Inter Laboratory Checks
A series of inter laboratory check samples were completed to establish any variation in DTR test results
between Nagrom and Amdel. Nagrom DTR test work was completed on a 30 gram feed weight of
screened -75µm material with two passes through the Davis Tube, Amdel DTR test work was completed
on a 20 gram feed weight of controlled grind pulp stage grind (target P80 = 45µm) with one pass through
the Davis Tube.
Interpretation of results is complicated by the large number of variables. Comparison of Fe, S, SiO2 and
DTR_Recovery indicates a very weak scatter for Fe and DTR_Recovery but more moderate scatter for S
and SiO2 particularly at low levels. A consistent weak bias is apparent with some overestimation in Fe (3
to 4%) and S (8 to 20%) and underestimation in SiO2 (~10%) and DTR_Recovery (7 to 10%) of the
Nagrom 2008 assays compared to Amdel. This data is being checked and further check sampling is
planned.
5.4 Grind Size Consistency Monitoring
Nagrom and Amdel completed wet screen size checking on 20 gram splits every 10 samples to monitor
feed weight grind size and to determine target P80 (80% passing size). Control charts of P80 = 45 µm
indicate that the targeted feed size was achieved at both laboratories.
6. Survey Control
6.1 Drillhole Collar Positions
Drill hole collar positions are initially recorded by hand held GPS. Final collar positions were surveyed by
a licenced surveyor from Cardno Spectrum using a Topcon GR3 RTKGPS instrument. The reference
datum for Magnetite Range is MGA94 Zone 50 with elevation referenced to AHD. Accuracies of ± 0.075m
vertical and ±0.050m horizontal were obtained. Local grid coordinates for local grids MR South and MR
North are calculated by transformation.
6.2 Digital Terrain Survey
A Digital Terrain Model (DTM) for the topography surface was generated from aeromagnetic survey
data. The original surface was found to be approximately 31m above the surveyed drill collars so was
recalculated.
6.3 Downhole Surveys
Initial down hole surveys were completed at nominal 50 - 80m intervals by the drillers with single shot
cameras. These surveys provided correct dips but inaccurate azimuths due to the high magnetic content
of the BIF. Final down hole surveys were completed periodically by Surtron Technologies using
gyroscopic directional probes at nominal 20m intervals. The majority of holes were able to be surveyed to
the end of hole. For holes that were unable to be surveyed to the end the last gyroscopic azimuth reading
was continued with the earlier single shot dips used at their measured depths. In the absence of down
hole survey information the collar declination and azimuth data are projected down-hole
Forpersonaluseonly
10. 7
7. Rock Density Measurements
Four methods were employed to obtain Bulk Density (BD) measurements from various geological and
metallurgical units at Magnetite Range. These were:
i) Immersion method (water displacement / Archimedes) completed on 36 diamond holes at
nominal 1m intervals. These measurements were mostly confined to the BIF units. The difference
in Dry and Wet Bulk Densities was insignificant due to the very low porosity of fresh core
ii) Density Tool method - geophysical logging by Surtron completed on 10 diamond holes at nominal
10cm intervals
iii) Tray Weight method - weights of trays with uncut core were collected for 5 diamond holes
iv) Coated Wax method - specific gravity (SG) of diamond core samples coated with paraffin wax by
AMMTEC
All methods provided good quality data from which weighted average bulk densities were determined for
different BIF sub-units.
Micromine Consulting assigned Wet Bulk Density (WBD) values to block model cells using regression
formulae based on iron content, which was used in the resource estimation.
8. Geological Modelling
Consistent geological logging codes were applied to all RC and diamond holes. The logging system
allows coded lithological and mineral descriptions as well as groupings of the main rock, regolith and BIF
types. Systematic recording of features such as oxidation, colour, minerals, sulphides, grain size,
magnetite % & grain size. One geologist has completed nearly 90% of the geological logging and high
consistency has been maintained.
Resource Estimation Methodology
Micromine Consulting reviewed the analytical database and conducted 3D resource modeling, block
model development, grade interpolation, model validation and geological resource reporting.
The Resource estimation is based on the 3D digital interpretation and wire framing of the main BIF units
and two sulphur domains( >0.2%S and >2%S), geostatistical analysis and block modelling. Fe, S, SiO2
and Al2O3 for both DTR and head assay grades, and weight recovery grades, were interpolated using
the Ordinary Kriging method. The estimates are reported at different weight recovery grades. The
estimates are reported with no top cut grade applied.
9.1 Exploratory Data Analysis
Classical statistical analysis was completed for the following elements on samples contained within the
BIF wire frame model:
• DTR assays: Fe, S, SiO2 and Al2O3
• Head assays: Fe, S, SiO2 and Al2O3
The DTR and head assays demonstrate distribution close to normal except for S which were domained at
>0.2 and >2%S.
9.2 Interpretation and Wire Framing
Interpretation and wire framing was carried out for 43 drill sections. The following wireframe models were
used in the resource estimation process:
Forpersonaluseonly
11. 8
• Digital Terrain Topographic Surface (DTM)
• Base of Complete Oxidation Surface (BOCO)
• Top of Fresh Rock Surface (TOFR)
• Closed wireframe model for the main BIF units
• Closed wireframe model for sulphur domain > 0.2% S
• Closed wireframe model for sulphur domain > 2% S
If the corresponding BIF envelope did not appear on the next cross section, the former was projected half
way to the next section, or to correspond with the airborne digital terrain model, where it was terminated.
The airborne digital terrain model and magnetic image was used to assist with the wireframing of the BIF
formation. The geological hard boundary for the BIF was extended 50 metres down-dip beyond the
deepest intersection on each drillhole cross section. The wireframed DTM Surfaces were subsequently
used to code the block model.
Figure 1: Three Dimensional View of Wire Framed Mineralised Envelopes
9.3 Drill Hole Data Selection and Compositing
Drillhole data selection is a standard procedure which ensures that the correct samples are used in the
classic statistics, geostatistical analyses and grade interpolation processes. For this purpose, the solid
wireframes for BIF formation was used to select the drill hole samples.
The majority of collected and assayed samples within the interpreted mineralised envelopes had a
sample length of 4 metres. The selected samples within BIF formation were composited over 4m
intervals, starting at the drill hole collar and progressing down hole. Compositing was stopped and
restarted at all boundaries between BIF envelopes and waste material. If a gap between samples of less
than 40 cm occurred, it was included in the sample composite. If the gap was longer than 40 cm, the
composite was stopped and another composite was started from the next sample. Basic statistical
parameters were obtained for the composited data.
9.4 Geostatistics
A series of semivariograms were generated for use as the input weighting mechanism for Kriging
algorithms. All variograms were calculated and modelled for the 4m composited DTR and head assay
Forpersonaluseonly
12. 9
sample files and constrained by the BIF model. Spherical semivariograms along the main directions of
anisotropy were then modelled. This made it possible to estimate the continuity of grade distribution in
three main directions and define the grade interpolation search radii. The parameters of the modelled
semivariograms are shown below (Table 2):
Table 2: Semivariogram Characteristics
Element Direction
Nugget
Effect
Partial
Sill
Range,
m
Fe Concentrate
First
0.00016 0.0037
344
Second 103
Third 40
S Concentrate (total)
First
0.432 0.754
252
Second 136
Third 97
S Con (domain < 0.2%)
First
0.315 0.52
197
Second 102
Third 70
S Con
(domain > 0.2%, <2%)
First
0.162 0.24
318
Second 80
Third 48
SiO2 Concentrate
First
0.051 0.125
192
Second 78
Third 44
Al2O3 Concentrate
First
0.144 0.37
249
Second 114
Third 154
Fe head assays
First
2.3 20.1/26.2
135/308
Second 49/152
Third 23/52
S head assays (total) First 0.31 0.46 160
Forpersonaluseonly
13. 10
Second 80
Third 75
S HA (domain < 0.2%)
First
0.23 0.46
252
Second 72
Third 192
SiO2 head assays
First
7.3 35.3
166
Second 97
Third 77
9.5 Block Modelling
Block modelling included several stages. Firstly, an empty block model was created within the closed
wireframe model for the BIF structure. The block model was then clipped by the topography surface and
the surface of the base of complete oxidation. Thus, all model cells above the topographic surface and
the surface of complete oxidation were deleted from the model file. The surface for the base of the
transition zone was used to code the block model in such a way that each cell or subcell was assigned a
code that indicated its position in relation to the surface of the base of transition zone. The resultant
model was coded by wireframe models of the sulphur domain and optimised to reduce block numbers.
The initial filling with a parent cell size of 20m by 50m by 10m was followed by subcelling down to 4m by
10m by 2m where necessary. The parent cell size was chosen on the basis of the exploration grid density
and in order to avoid the generation of too large a block model. The subcelling size was chosen to
maintain the resolution of the mineralised bodies and boundaries between the domains and surfaces.
9.6 Grade Interpolation and Resource Classification
Iron, sulphur SiO2 and Al2O3 from both DTR and head assays grades were interpolated into the empty
block model using the Ordinary Kriging method. The concentrate recovery values were also estimated in
the block model using the same parameters as for DRT iron grades.
The Ordinary Kriging process was performed at different search radii until all cells were interpolated. The
search radii were determined by means of the evaluation of the modelled semivariograms parameters,
which determined the Kriging weights to be applied to samples at specified distances. The first search
radii were selected to be equal to two thirds of the semivariogram ranges in the unfolded strike, down dip
and across dip (thickness) directions. Model cells that did not receive a grade estimate from the first
interpolation run were used in the next interpolation with greater search radii equal to the full
semivariogram ranges in all directions. The model cells that did not receive grades from the first two runs
were then estimated using radii incremented by the full semivariogram ranges.
When model cells were estimated using radii not exceeding the full semivariogram ranges, a restriction of
at least three samples from at least two drill holes was applied to increase the reliability of the estimates.
A detailed definition of the interpolation strategy is presented in Table 3.
Each sulphur domain was processed and estimated separately, ie. the sample composites from different
sulphur domains were not mixed.
Forpersonaluseonly
14. 11
Table 3: Interpolation and Resource Classification Parameters
Interpolation Method Ordinary Kriging
Interpolation Run No 1 2 >2
Resource Category Indicated Indicated Inferred
Search Radii
Less or equal to 2/3
of semivariogram
ranges
Less of equal to
semivariogram
ranges
Greater than
semivariogram ranges
Minimum number of
samples
3 2 1
Maximum number of
samples
16 16 16
Minimum number of
drillholes
2 2 1
The blocks were interpolated using only assay composites restricted by the BIF wireframe model and
corresponding sulphur domains.
Declustering was performed during the interpolation process by using four sectors within the search
neighbourhood. Each sector was restricted to a maximum of four points, and the search neighbourhood
was restricted to an overall minimum of three points for the interpolation runs using radii within the
semivariogram ranges. The maximum combined number of samples allowable for the interpolation was
therefore 16. Change of support was honoured by discretising to 2-points by 2-points by 2-point kriged
estimates. These point estimates are simple averages of the block estimates.
The Resource classification strategy utilised in this report is based primarily on search and interpolation
parameters. The specific requirements concerning the minimum number of samples and the minimum
number of drill holes used for grade interpolation for each block were applied, and are tabulated in Table
3. Those blocks which contained interpolated grades were initially classified as an Indicated Resource
with the assumption that at least three samples from at least two drill holes were selected for grade
interpolation, and that the search radii were equal to or less than the semivariograms ranges for iron
grades (in concentrate) in all directions. If the grades were interpolated into block model cells by using
search radii greater than the full semivariogram ranges in all directions, those blocks were classified as
Inferred Resources assuming that a minimum of one sample from one drill hole was used for the grade
interpolation.
Once the classification on the basis of search and semivariogram parameters was complete, it was
visually reviewed. Some inconsistencies were found where the mineralised body was displaced by major
faults. It was then decided to reinterpret the areas with such inconstancies and where the distance
between exploration lines was greater than 200m. All these areas were interpreted and the resource
category for them was downgraded to Inferred Resources.
Forpersonaluseonly
15. 12
9.7 Bulk Density Values
Bulk density values can be assigned to block model cells using the following methods:
• Direct assignment of the values to block model cells,
• Calculation of values for each cell using regression formulas,
• Interpolation of values,
• Use of geological model to assign values into each model cell.
Micromine Consulting used the second method, ie. the specific gravity values were calculated to each
model cell according to the regression formulas. Accent Resources supplied a separate database with
both wet (5502 measurements) and dry (5689 measurements) bulk density values (Immersion method).
This database was merged into the head assays for iron grades and used to generate simple linear
regression charts. The following regression formulas can be used to calculate the bulk density values for
each model cell:
• BD (dry) = 2.611782 + 0.024729 x Fe% (head assays)
• WBD (wet) = 2.606423 + 0.024821 x Fe% (head assays
Micromine assigned Wet Bulk Density (WBD) values to block model cells for the resource calculation.
10. Mineral Resource
The mineral resource estimate is stated at various cut-off grades (Davis Tube mass recovery) in Table 4.
Forpersonaluseonly