More Related Content
Similar to 3, windsor park, delwood, mueller (10)
3, windsor park, delwood, mueller
- 1. Blake Taylor Taylor Real Estate
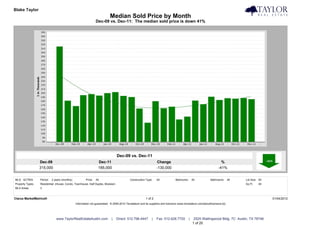
Median Sold Price by Month
Dec-09 vs. Dec-11: The median sold price is down 41%
Dec-09 vs. Dec-11
Dec-09 Dec-11 Change %
315,000 185,000 -130,000 -41%
MLS: ACTRIS Period: 2 years (monthly) Price: All Construction Type: All Bedrooms: All Bathrooms: All Lot Size: All
Property Types: Residential: (House, Condo, Townhouse, Half Duplex, Modular) Sq Ft: All
MLS Areas: 3
Clarus MarketMetrics® 1 of 2 01/04/2012
Information not guaranteed. © 2009-2010 Terradatum and its suppliers and licensors (www.terradatum.com/about/licensors.td).
www.TaylorRealEstateAustin.com | Direct: 512.796.4447 | Fax: 512.628.7720 | 2525 Wallingwood Bldg. 7C Austin, TX 78746
1 of 20
- 2. Blake Taylor Taylor Real Estate
Median Sold Price by Month
Dec-09 vs. Dec-11: The median sold price is down 41%
Time Period Median Price # Units Average DOM
Dec-11 185,000 25 48
Nov-11 187,650 33 68
Oct-11 186,250 35 57
Sep-11 187,425 33 66
Aug-11 183,000 32 66
Jul-11 191,000 37 62
Jun-11 172,500 38 55
May-11 181,500 29 66
Apr-11 142,000 21 107
Mar-11 135,000 31 80
Feb-11 166,500 19 73
Jan-11 162,460 10 76
Dec-10 180,000 23 72
Nov-10 127,000 17 63
Oct-10 162,000 19 61
Sep-10 190,225 24 81
Aug-10 193,000 35 53
Jul-10 202,500 25 93
Jun-10 200,000 29 51
May-10 194,000 44 37
Apr-10 197,500 37 52
Mar-10 195,000 34 63
Feb-10 168,000 15 67
Jan-10 181,250 16 60
Dec-09 315,000 27 66
Clarus MarketMetrics® 2 of 2 01/04/2012
Information not guaranteed. © 2009-2010 Terradatum and its suppliers and licensors (www.terradatum.com/about/licensors.td).
www.TaylorRealEstateAustin.com | Direct: 512.796.4447 | Fax: 512.628.7720 | 2525 Wallingwood Bldg. 7C Austin, TX 78746
2 of 20
- 3. Blake Taylor Taylor Real Estate
Median For Sale vs. Median Sold
Dec-09 vs. Dec-11: The median price of for sale properties is down 7% and the median price of sold properties is down 41%
Dec-09 vs. Dec-11 Dec-09 vs. Dec-11
Dec-09 Dec-11 Change % Dec-09 Dec-11 Change %
199,000 184,675 -14,325 -7% 315,000 185,000 -130,000 -41%
MLS: ACTRIS Period: 2 years (monthly) Price: All Construction Type: All Bedrooms: All Bathrooms: All Lot Size: All
Property Types: Residential: (House, Condo, Townhouse, Half Duplex, Modular) Sq Ft: All
MLS Areas: 3
Clarus MarketMetrics® 1 of 2 01/04/2012
Information not guaranteed. © 2009-2010 Terradatum and its suppliers and licensors (www.terradatum.com/about/licensors.td).
www.TaylorRealEstateAustin.com | Direct: 512.796.4447 | Fax: 512.628.7720 | 2525 Wallingwood Bldg. 7C Austin, TX 78746
3 of 20
- 4. Blake Taylor Taylor Real Estate
Median For Sale vs. Median Sold
Dec-09 vs. Dec-11: The median price of for sale properties is down 7% and the median price of sold properties is down 41%
For Sale # Properties Sold # Properties Price
Time Period Median For Sale Median Sold Difference
Dec-11 184,675 138 185,000 25 325
Nov-11 177,000 150 187,650 33 10,650
Oct-11 184,725 172 186,250 35 1,525
Sep-11 184,725 174 187,425 33 2,700
Aug-11 187,000 181 183,000 32 -4,000
Jul-11 180,000 183 191,000 37 11,000
Jun-11 174,400 198 172,500 38 -1,900
May-11 170,000 190 181,500 29 11,500
Apr-11 170,000 193 142,000 21 -28,000
Mar-11 169,900 187 135,000 31 -34,900
Feb-11 162,000 177 166,500 19 4,500
Jan-11 160,000 187 162,460 10 2,460
Dec-10 165,000 195 180,000 23 15,000
Nov-10 169,900 215 127,000 17 -42,900
Oct-10 175,500 241 162,000 19 -13,500
Sep-10 175,500 239 190,225 24 14,725
Aug-10 181,275 239 193,000 35 11,725
Jul-10 184,500 261 202,500 25 18,000
Jun-10 184,900 255 200,000 29 15,100
May-10 185,000 250 194,000 44 9,000
Apr-10 189,000 255 197,500 37 8,500
Mar-10 189,900 241 195,000 34 5,100
Feb-10 189,900 220 168,000 15 -21,900
Jan-10 189,925 184 181,250 16 -8,675
Dec-09 199,000 180 315,000 27 116,000
Clarus MarketMetrics® 2 of 2 01/04/2012
Information not guaranteed. © 2009-2010 Terradatum and its suppliers and licensors (www.terradatum.com/about/licensors.td).
www.TaylorRealEstateAustin.com | Direct: 512.796.4447 | Fax: 512.628.7720 | 2525 Wallingwood Bldg. 7C Austin, TX 78746
4 of 20
- 5. Blake Taylor Taylor Real Estate
Sold Properties by Month
Dec-09 vs. Dec-11: The number of Sold properties is down 7%
Dec-09 vs. Dec-11
Dec-09 Dec-11 Change %
27 25 -2 -7%
MLS: ACTRIS Period: 2 years (monthly) Price: All Construction Type: All Bedrooms: All Bathrooms: All Lot Size: All
Property Types: Residential: (House, Condo, Townhouse, Half Duplex, Modular) Sq Ft: All
MLS Areas: 3
Clarus MarketMetrics® 1 of 2 01/04/2012
Information not guaranteed. © 2009-2010 Terradatum and its suppliers and licensors (www.terradatum.com/about/licensors.td).
www.TaylorRealEstateAustin.com | Direct: 512.796.4447 | Fax: 512.628.7720 | 2525 Wallingwood Bldg. 7C Austin, TX 78746
5 of 20
- 6. Blake Taylor Taylor Real Estate
Sold Properties by Month
Dec-09 vs. Dec-11: The number of Sold properties is down 7%
Full Market Bank Properties Non-Bank Properties
Time Period # Properties Median Price Average DOM # Properties % Bank Median Price # Properties % Non-Bank Median Price
Dec-11 25 185,000 48 6 24.0 89,000 19 76.0 198,650
Nov-11 33 187,650 68 4 12.1 88,250 29 87.9 193,000
Oct-11 35 186,250 57 3 8.6 129,000 32 91.4 195,500
Sep-11 33 187,425 66 3 9.1 80,000 30 90.9 189,300
Aug-11 32 183,000 66 6 18.8 87,890 26 81.2 202,500
Jul-11 37 191,000 62 5 13.5 92,000 32 86.5 206,250
Jun-11 38 172,500 55 2 5.3 142,500 36 94.7 172,500
May-11 29 181,500 66 4 13.8 85,500 25 86.2 225,000
Apr-11 21 142,000 107 6 28.6 73,050 15 71.4 149,400
Mar-11 31 135,000 80 9 29.0 80,000 22 71.0 149,375
Feb-11 19 166,500 73 3 15.8 125,000 16 84.2 181,475
Jan-11 10 162,460 76 1 10.0 162,000 9 90.0 162,920
Dec-10 23 180,000 72 2 8.7 111,750 21 91.3 182,000
Nov-10 17 127,000 63 2 11.8 184,475 15 88.2 127,000
Oct-10 19 162,000 61 0 19 100.0 162,000
Sep-10 24 190,225 81 2 8.3 30,650 22 91.7 202,425
Aug-10 35 193,000 53 4 11.4 116,500 31 88.6 214,000
Jul-10 25 202,500 93 1 4.0 132,000 24 96.0 215,250
Jun-10 29 200,000 51 1 3.5 180,000 28 96.5 209,500
May-10 44 194,000 37 1 2.3 189,000 43 97.7 198,000
Apr-10 37 197,500 52 3 8.1 88,550 34 91.9 204,000
Mar-10 34 195,000 63 3 8.8 145,000 31 91.2 204,000
Feb-10 15 168,000 67 1 6.7 140,000 14 93.3 180,000
Jan-10 16 181,250 60 0 16 100.0 181,250
Dec-09 27 315,000 66 3 11.1 78,500 24 88.9 337,416
Clarus MarketMetrics® 2 of 2 01/04/2012
Information not guaranteed. © 2009-2010 Terradatum and its suppliers and licensors (www.terradatum.com/about/licensors.td).
www.TaylorRealEstateAustin.com | Direct: 512.796.4447 | Fax: 512.628.7720 | 2525 Wallingwood Bldg. 7C Austin, TX 78746
6 of 20
- 7. Blake Taylor Taylor Real Estate
Under Contract Properties by Month
Dec-09 vs. Dec-11: The number of Under Contract properties is up 5%
Dec-09 vs. Dec-11
Dec-09 Dec-11 Change %
20 21 1 +5%
MLS: ACTRIS Period: 2 years (monthly) Price: All Construction Type: All Bedrooms: All Bathrooms: All Lot Size: All
Property Types: Residential: (House, Condo, Townhouse, Half Duplex, Modular) Sq Ft: All
MLS Areas: 3
Clarus MarketMetrics® 1 of 2 01/04/2012
Information not guaranteed. © 2009-2010 Terradatum and its suppliers and licensors (www.terradatum.com/about/licensors.td).
www.TaylorRealEstateAustin.com | Direct: 512.796.4447 | Fax: 512.628.7720 | 2525 Wallingwood Bldg. 7C Austin, TX 78746
7 of 20
- 8. Blake Taylor Taylor Real Estate
Under Contract Properties by Month
Dec-09 vs. Dec-11: The number of Under Contract properties is up 5%
Full Market Bank Properties Non-Bank Properties
Time Period # Properties Median Price Average DOM # Properties % Bank Median Price # Properties % Non-Bank Median Price
Dec-11 21 165,000 71 2 9.5 91,950 19 90.5 166,000
Nov-11 22 169,500 58 7 31.8 99,900 15 68.2 235,000
Oct-11 37 199,000 65 4 10.8 90,000 33 89.2 199,900
Sep-11 26 201,500 56 4 15.4 86,950 22 84.6 219,700
Aug-11 38 202,500 68 4 10.5 90,450 34 89.5 209,975
Jul-11 32 168,500 80 7 21.9 104,900 25 78.1 190,000
Jun-11 41 184,900 67 5 12.2 125,537 36 87.8 192,200
May-11 34 187,475 56 3 8.8 99,900 31 91.2 198,500
Apr-11 28 165,325 74 3 10.7 83,900 25 89.3 180,000
Mar-11 23 158,000 86 7 30.4 67,500 16 69.6 179,000
Feb-11 28 159,975 71 6 21.4 93,078 22 78.6 203,759
Jan-11 24 157,400 78 4 16.7 111,690 20 83.3 167,400
Dec-10 17 166,000 62 2 11.8 142,950 15 88.2 175,000
Nov-10 20 181,000 74 2 10.0 149,900 18 90.0 194,500
Oct-10 17 167,000 62 2 11.8 195,900 15 88.2 167,000
Sep-10 21 192,500 76 0 21 100.0 192,500
Aug-10 25 192,900 59 1 4.0 34,000 24 96.0 193,900
Jul-10 28 219,925 56 3 10.7 115,000 25 89.3 230,000
Jun-10 26 190,000 77 4 15.4 161,950 22 84.6 211,950
May-10 23 200,000 76 0 23 100.0 200,000
Apr-10 38 197,450 42 1 2.6 190,000 37 97.4 199,900
Mar-10 60 202,450 50 4 6.7 100,450 56 93.3 209,250
Feb-10 28 197,000 67 2 7.1 167,450 26 92.9 199,000
Jan-10 12 194,450 83 1 8.3 140,000 11 91.7 199,900
Dec-09 20 214,450 60 0 20 100.0 214,450
Clarus MarketMetrics® 2 of 2 01/04/2012
Information not guaranteed. © 2009-2010 Terradatum and its suppliers and licensors (www.terradatum.com/about/licensors.td).
www.TaylorRealEstateAustin.com | Direct: 512.796.4447 | Fax: 512.628.7720 | 2525 Wallingwood Bldg. 7C Austin, TX 78746
8 of 20
- 9. Blake Taylor Taylor Real Estate
New Properties by Month
Dec-09 vs. Dec-11: The number of New properties is down 33%
Dec-09 vs. Dec-11
Dec-09 Dec-11 Change %
36 24 -12 -33%
MLS: ACTRIS Period: 2 years (monthly) Price: All Construction Type: All Bedrooms: All Bathrooms: All Lot Size: All
Property Types: Residential: (House, Condo, Townhouse, Half Duplex, Modular) Sq Ft: All
MLS Areas: 3
Clarus MarketMetrics® 1 of 2 01/04/2012
Information not guaranteed. © 2009-2010 Terradatum and its suppliers and licensors (www.terradatum.com/about/licensors.td).
www.TaylorRealEstateAustin.com | Direct: 512.796.4447 | Fax: 512.628.7720 | 2525 Wallingwood Bldg. 7C Austin, TX 78746
9 of 20
- 10. Blake Taylor Taylor Real Estate
New Properties by Month
Dec-09 vs. Dec-11: The number of New properties is down 33%
Full Market Bank Properties Non-Bank Properties
Time Period # Properties Median Price # Properties % Bank Median Price # Properties % Non-Bank Median Price
Dec-11 24 199,900 1 4.2 119,900 23 95.8 205,000
Nov-11 33 179,000 0 33 100.0 179,000
Oct-11 46 203,000 7 15.2 99,900 39 84.8 220,000
Sep-11 47 199,900 4 8.5 124,450 43 91.5 209,995
Aug-11 42 189,900 5 11.9 77,900 37 88.1 198,000
Jul-11 48 184,675 6 12.5 95,200 42 87.5 191,925
Jun-11 52 202,500 1 1.9 185,000 51 98.1 205,000
May-11 43 167,000 4 9.3 94,950 39 90.7 173,900
Apr-11 48 185,950 4 8.3 104,975 44 91.7 194,900
Mar-11 57 200,000 7 12.3 84,900 50 87.7 210,950
Feb-11 39 162,000 4 10.3 87,950 35 89.7 169,000
Jan-11 39 161,000 5 12.8 110,000 34 87.2 177,000
Dec-10 31 149,999 3 9.7 86,256 28 90.3 152,500
Nov-10 30 146,250 6 20.0 75,628 24 80.0 182,450
Oct-10 53 189,000 5 9.4 97,900 48 90.6 192,425
Sep-10 51 164,950 6 11.8 106,450 45 88.2 169,900
Aug-10 39 181,275 2 5.1 184,950 37 94.9 181,275
Jul-10 65 184,900 6 9.2 114,900 59 90.8 189,000
Jun-10 64 179,950 10 15.6 125,900 54 84.4 194,950
May-10 51 205,000 4 7.8 122,400 47 92.2 214,900
Apr-10 84 194,700 1 1.2 190,000 83 98.8 194,900
Mar-10 66 193,950 2 3.0 152,398 64 97.0 198,950
Feb-10 62 189,900 2 3.2 130,000 60 96.8 192,200
Jan-10 53 195,000 2 3.8 126,450 51 96.2 199,000
Dec-09 36 189,950 4 11.1 84,950 32 88.9 204,450
Clarus MarketMetrics® 2 of 2 01/04/2012
Information not guaranteed. © 2009-2010 Terradatum and its suppliers and licensors (www.terradatum.com/about/licensors.td).
www.TaylorRealEstateAustin.com | Direct: 512.796.4447 | Fax: 512.628.7720 | 2525 Wallingwood Bldg. 7C Austin, TX 78746
10 of 20
- 11. Blake Taylor Taylor Real Estate
For Sale Properties by Month
Dec-09 vs. Dec-11: The number of For Sale properties is down 23%
Dec-09 vs. Dec-11
Dec-09 Dec-11 Change %
180 138 -42 -23%
MLS: ACTRIS Period: 2 years (monthly) Price: All Construction Type: All Bedrooms: All Bathrooms: All Lot Size: All
Property Types: Residential: (House, Condo, Townhouse, Half Duplex, Modular) Sq Ft: All
MLS Areas: 3
Clarus MarketMetrics® 1 of 2 01/04/2012
Information not guaranteed. © 2009-2010 Terradatum and its suppliers and licensors (www.terradatum.com/about/licensors.td).
www.TaylorRealEstateAustin.com | Direct: 512.796.4447 | Fax: 512.628.7720 | 2525 Wallingwood Bldg. 7C Austin, TX 78746
11 of 20
- 12. Blake Taylor Taylor Real Estate
For Sale Properties by Month
Dec-09 vs. Dec-11: The number of For Sale properties is down 23%
Full Market Bank Properties Non-Bank Properties
Time Period # Properties Median Price Average DOM # Properties % Bank Median Price # Properties % Non-Bank Median Price
Dec-11 138 184,675 105 5 3.6 129,900 133 96.4 185,000
Nov-11 150 177,000 94 12 8.0 121,450 138 92.0 187,000
Oct-11 172 184,725 92 19 11.1 99,900 153 89.0 199,000
Sep-11 174 184,725 94 17 9.8 104,000 157 90.2 195,000
Aug-11 181 187,000 95 18 9.9 90,000 163 90.1 196,500
Jul-11 183 180,000 98 21 11.5 107,900 162 88.5 189,000
Jun-11 198 174,400 100 20 10.1 114,000 178 89.9 182,400
May-11 190 170,000 98 22 11.6 110,450 168 88.4 179,250
Apr-11 193 170,000 97 24 12.4 111,500 169 87.6 179,900
Mar-11 187 169,900 100 27 14.4 84,900 160 85.6 179,000
Feb-11 177 162,000 106 27 15.2 97,900 150 84.8 169,950
Jan-11 187 160,000 112 30 16.0 99,900 157 84.0 169,900
Dec-10 195 165,000 113 28 14.4 98,900 167 85.6 170,000
Nov-10 215 169,900 107 29 13.5 119,900 186 86.5 184,900
Oct-10 241 175,500 104 26 10.8 119,950 215 89.2 184,900
Sep-10 239 175,500 105 22 9.2 119,950 217 90.8 179,900
Aug-10 239 181,275 102 18 7.5 123,450 221 92.5 185,000
Jul-10 261 184,500 94 19 7.3 119,900 242 92.7 190,750
Jun-10 255 184,900 96 19 7.5 125,000 236 92.5 194,900
May-10 250 185,000 98 11 4.4 125,000 239 95.6 194,500
Apr-10 255 189,000 85 8 3.1 149,000 247 96.9 189,900
Mar-10 241 189,900 84 11 4.6 124,900 230 95.4 194,700
Feb-10 220 189,900 86 11 5.0 140,000 209 95.0 195,000
Jan-10 184 189,925 93 10 5.4 140,000 174 94.6 199,000
Dec-09 180 199,000 94 8 4.4 144,500 172 95.6 199,900
Clarus MarketMetrics® 2 of 2 01/04/2012
Information not guaranteed. © 2009-2010 Terradatum and its suppliers and licensors (www.terradatum.com/about/licensors.td).
www.TaylorRealEstateAustin.com | Direct: 512.796.4447 | Fax: 512.628.7720 | 2525 Wallingwood Bldg. 7C Austin, TX 78746
12 of 20
- 13. Blake Taylor Taylor Real Estate
Expired Properties by Month
Dec-09 vs. Dec-11: The number of Expired properties is down 38%
Dec-09 vs. Dec-11
Dec-09 Dec-11 Change %
29 18 -11 -38%
MLS: ACTRIS Period: 2 years (monthly) Price: All Construction Type: All Bedrooms: All Bathrooms: All Lot Size: All
Property Types: Residential: (House, Condo, Townhouse, Half Duplex, Modular) Sq Ft: All
MLS Areas: 3
Clarus MarketMetrics® 1 of 2 01/04/2012
Information not guaranteed. © 2009-2010 Terradatum and its suppliers and licensors (www.terradatum.com/about/licensors.td).
www.TaylorRealEstateAustin.com | Direct: 512.796.4447 | Fax: 512.628.7720 | 2525 Wallingwood Bldg. 7C Austin, TX 78746
13 of 20
- 14. Blake Taylor Taylor Real Estate
Expired Properties by Month
Dec-09 vs. Dec-11: The number of Expired properties is down 38%
Full Market Bank Properties Non-Bank Properties
Time Period # Properties Median Price Average DOM # Properties % Bank Median Price # Properties % Non-Bank Median Price
Dec-11 18 166,245 95 0 18 100.0 166,245
Nov-11 14 151,000 97 1 7.1 129,950 13 92.9 162,000
Oct-11 18 183,500 144 3 16.7 169,500 15 83.3 195,000
Sep-11 22 202,400 123 1 4.5 185,000 21 95.5 204,900
Aug-11 16 201,500 107 1 6.2 84,900 15 93.8 205,000
Jul-11 12 164,250 168 1 8.3 149,900 11 91.7 169,500
Jun-11 22 157,450 142 0 22 100.0 157,450
May-11 10 159,500 93 0 10 100.0 159,500
Apr-11 18 174,900 112 3 16.7 101,900 15 83.3 189,900
Mar-11 19 169,999 114 0 19 100.0 169,999
Feb-11 19 180,000 107 1 5.3 125,000 18 94.7 184,950
Jan-11 25 150,000 151 3 12.0 120,000 22 88.0 153,725
Dec-10 30 194,975 142 1 3.3 129,900 29 96.7 195,000
Nov-10 31 175,500 137 2 6.5 162,700 29 93.5 189,500
Oct-10 39 200,000 158 1 2.6 109,900 38 97.4 200,000
Sep-10 30 175,000 122 1 3.3 105,900 29 96.7 175,000
Aug-10 26 189,700 117 1 3.9 149,000 25 96.2 194,500
Jul-10 33 179,000 128 0 33 100.0 179,000
Jun-10 33 199,500 112 2 6.1 129,950 31 93.9 199,900
May-10 36 181,450 107 2 5.6 152,398 34 94.4 186,475
Apr-10 18 188,500 110 0 18 100.0 188,500
Mar-10 10 212,200 105 0 10 100.0 212,200
Feb-10 17 289,000 148 0 17 100.0 289,000
Jan-10 14 199,900 117 0 14 100.0 199,900
Dec-09 29 249,900 104 0 29 100.0 249,900
Clarus MarketMetrics® 2 of 2 01/04/2012
Information not guaranteed. © 2009-2010 Terradatum and its suppliers and licensors (www.terradatum.com/about/licensors.td).
www.TaylorRealEstateAustin.com | Direct: 512.796.4447 | Fax: 512.628.7720 | 2525 Wallingwood Bldg. 7C Austin, TX 78746
14 of 20
- 15. Blake Taylor Taylor Real Estate
Supply & Demand by Month
Dec-09 vs. Dec-11: The number of for sale properties is down 23% and the number of sold properties is down 7%
Dec-09 vs. Dec-11 Dec-09 vs. Dec-11
Dec-09 Dec-11 Change % Dec-09 Dec-11 Change %
180 138 -42 -23% 27 25 -2 -7%
MLS: ACTRIS Period: 2 years (monthly) Price: All Construction Type: All Bedrooms: All Bathrooms: All Lot Size: All
Property Types: Residential: (House, Condo, Townhouse, Half Duplex, Modular) Sq Ft: All
MLS Areas: 3
Clarus MarketMetrics® 1 of 2 01/04/2012
Information not guaranteed. © 2009-2010 Terradatum and its suppliers and licensors (www.terradatum.com/about/licensors.td).
www.TaylorRealEstateAustin.com | Direct: 512.796.4447 | Fax: 512.628.7720 | 2525 Wallingwood Bldg. 7C Austin, TX 78746
15 of 20
- 16. Blake Taylor Taylor Real Estate
Supply & Demand by Month
Dec-09 vs. Dec-11: The number of for sale properties is down 23% and the number of sold properties is down 7%
# Properties Average DOM # Properties Average DOM
Time Period For Sale For Sale Sold Sold
Dec-11 138 105 25 48
Nov-11 150 94 33 68
Oct-11 172 92 35 57
Sep-11 174 94 33 66
Aug-11 181 95 32 66
Jul-11 183 98 37 62
Jun-11 198 100 38 55
May-11 190 98 29 66
Apr-11 193 97 21 107
Mar-11 187 100 31 80
Feb-11 177 106 19 73
Jan-11 187 112 10 76
Dec-10 195 113 23 72
Nov-10 215 107 17 63
Oct-10 241 104 19 61
Sep-10 239 105 24 81
Aug-10 239 102 35 53
Jul-10 261 94 25 93
Jun-10 255 96 29 51
May-10 250 98 44 37
Apr-10 255 85 37 52
Mar-10 241 84 34 63
Feb-10 220 86 15 67
Jan-10 184 93 16 60
Dec-09 180 94 27 66
Clarus MarketMetrics® 2 of 2 01/04/2012
Information not guaranteed. © 2009-2010 Terradatum and its suppliers and licensors (www.terradatum.com/about/licensors.td).
www.TaylorRealEstateAustin.com | Direct: 512.796.4447 | Fax: 512.628.7720 | 2525 Wallingwood Bldg. 7C Austin, TX 78746
16 of 20
- 17. Blake Taylor Taylor Real Estate
The Average Days on Market by Month
Dec-09 vs. Dec-11: The average days on market is up 18%
Dec-09 vs. Dec-11
Dec-09 Dec-11 Change %
60 71 11 +18%
MLS: ACTRIS Period: 2 years (monthly) Price: All Construction Type: All Bedrooms: All Bathrooms: All Lot Size: All
Property Types: Residential: (House, Condo, Townhouse, Half Duplex, Modular) Sq Ft: All
MLS Areas: 3
Clarus MarketMetrics® 1 of 2 01/04/2012
Information not guaranteed. © 2009-2010 Terradatum and its suppliers and licensors (www.terradatum.com/about/licensors.td).
www.TaylorRealEstateAustin.com | Direct: 512.796.4447 | Fax: 512.628.7720 | 2525 Wallingwood Bldg. 7C Austin, TX 78746
17 of 20
- 18. Blake Taylor Taylor Real Estate
The Average Days on Market by Month
Dec-09 vs. Dec-11: The average days on market is up 18%
Time Period Average DOM # UC Units
Dec-11 71 21
Nov-11 58 22
Oct-11 65 37
Sep-11 56 26
Aug-11 68 38
Jul-11 80 32
Jun-11 67 41
May-11 56 34
Apr-11 74 28
Mar-11 86 23
Feb-11 71 28
Jan-11 78 24
Dec-10 62 17
Nov-10 74 20
Oct-10 62 17
Sep-10 76 21
Aug-10 59 25
Jul-10 56 28
Jun-10 77 26
May-10 76 23
Apr-10 42 38
Mar-10 50 60
Feb-10 67 28
Jan-10 83 12
Dec-09 60 20
Clarus MarketMetrics® 2 of 2 01/04/2012
Information not guaranteed. © 2009-2010 Terradatum and its suppliers and licensors (www.terradatum.com/about/licensors.td).
www.TaylorRealEstateAustin.com | Direct: 512.796.4447 | Fax: 512.628.7720 | 2525 Wallingwood Bldg. 7C Austin, TX 78746
18 of 20
- 19. Blake Taylor Taylor Real Estate
Months Supply of Inventory
Dec-09 vs. Dec-11: The average months supply of inventory is down 28%
Dec-09 vs. Dec-11
Dec-09 Dec-11 Change %
6.6 4.7 -1.8 -28%
MLS: ACTRIS Period: 2 years (monthly) Price: All Construction Type: All Bedrooms: All Bathrooms: All Lot Size: All
Property Types: Residential: (House, Condo, Townhouse, Half Duplex, Modular) Sq Ft: All
MLS Areas: 3
Clarus MarketMetrics® 1 of 2 01/04/2012
Information not guaranteed. © 2009-2010 Terradatum and its suppliers and licensors (www.terradatum.com/about/licensors.td).
www.TaylorRealEstateAustin.com | Direct: 512.796.4447 | Fax: 512.628.7720 | 2525 Wallingwood Bldg. 7C Austin, TX 78746
19 of 20
- 20. Blake Taylor Taylor Real Estate
Months Supply of Inventory
Dec-09 vs. Dec-11: The average months supply of inventory is down 28%
# Units For Sale # UC Units UC Average
Time Period Last Day of Month During Month MSI DOM
Dec-11 99 21 4.7 71
Nov-11 114 22 5.2 58
Oct-11 117 37 3.2 65
Sep-11 126 26 4.8 56
Aug-11 127 38 3.3 68
Jul-11 139 32 4.3 80
Jun-11 135 41 3.3 67
May-11 146 34 4.3 56
Apr-11 147 28 5.2 74
Mar-11 145 23 6.3 86
Feb-11 130 28 4.6 71
Jan-11 138 24 5.8 78
Dec-10 148 17 8.7 62
Nov-10 164 20 8.2 74
Oct-10 185 17 10.9 62
Sep-10 188 21 9.0 76
Aug-10 188 25 7.5 59
Jul-10 200 28 7.1 56
Jun-10 196 26 7.5 77
May-10 191 23 8.3 76
Apr-10 199 38 5.2 42
Mar-10 171 60 2.9 50
Feb-10 175 28 6.2 67
Jan-10 158 12 13.2 83
Dec-09 131 20 6.5 60
Clarus MarketMetrics® 2 of 2 01/04/2012
Information not guaranteed. © 2009-2010 Terradatum and its suppliers and licensors (www.terradatum.com/about/licensors.td).
www.TaylorRealEstateAustin.com | Direct: 512.796.4447 | Fax: 512.628.7720 | 2525 Wallingwood Bldg. 7C Austin, TX 78746
20 of 20