{Pooja: 9892124323 } Call Girl in Mumbai | Jas Kaur Rate 4500 Free Hotel Del...
Unit - I FDS.pdf
1. lOMoARcPSD|282 656 68
lOMoARcPSD|282 656 6
Department of Computer Science Engineering
CS3352-Foundations of Data Science
Unit - I : Introduction
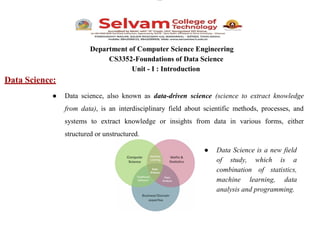
Data Science:
● Data science, also known as data-driven science (science to extract knowledge
from data), is an interdisciplinary field about scientific methods, processes, and
systems to extract knowledge or insights from data in various forms, either
structured or unstructured.
● Data Science is a new field
of study, which is a
combination of statistics,
machine learning, data
analysis and programming.
2. lOMoARcPSD|282 656 68
● Data Scientist
A data scientist is someone who uses their skills to mine the data, understand it and extract
insights from it. They usually work with a team of engineers and analysts to create models that
can be used for various purposes.
● Data Analyst
A data analyst works on getting information from various sources such as offline or online
databases, spreadsheets, surveys and so on. They also use analytical tools like
Excel/PowerPoint/Tableau etc., but mostly rely on statistical techniques to present their
findings in a readable format.
3. lOMoARcPSD|282 656 68
Benefits of Data Science:
● Improves Business Predictions
● Helps in Sales & Marketing
● Increases Information Security
● Complex Data Interpretation
● Highly Paid jobs & career opportunities
● Automating Recruitment Processes
5. lOMoARcPSD|282 656 68
Facets of Data:
● The main categories of data are these:
○ Structured
○ Unstructured
○ Natural Language
○ Machine-generated
○ Graph-based
○ Audio, video and images
○ Streaming
6. lOMoARcPSD|282 656 68
● Structured
○ Structured data is the data that depends on a data model and resides in a fixed field
within a record.
○ It’s often easy to store structured data in tables within data bases or Excel files.
SQL, Structured Query Language, is the preferred way to manage and query data
that resides in databases.
7. lOMoARcPSD|282 656 68
● Unstructured
○ Unstructured data is data that isn’t easy to fit into a data model because the content
is context-specific or varying. One example of unstructured data is your regular
email.
8. lOMoARcPSD|282 656 68
● Natural Language
○ Natural language is a special type of unstructured data; it’s challenging to process
because it requires knowledge of specific data science techniques and linguistics.
○ A human-written email is also a perfect example of natural language data.
9. lOMoARcPSD|282 656 68
● Machine-generated
○ Machine-generated data is informative that’s automatically created by a computer,
process, application or other machine without human intervention.
○ Examples of machine data are web server logs, call detail records, network event
logs, etc.
10. lOMoARcPSD|282 656 68
● Graph-based
○ Graph-based data is a natural way to represent social networks, and its structure
allows you to calculate specific metrics such as the influence of a person and the
shortest path between two people.
e
11. lOMoARcPSD|282 656 68
● Audio, Images and Videos
○ Audio, image, and video are data types that pose specific challenges to a data scientist. Tasks that are
trivial for humans, such as recognizing objects in pictures, turn out to be challenging for computers.
● Streaming Data
○ Streaming data can take almost any of the previous forms, it has an extra property. The data flows
into the system when an event happens instead of being loaded into a data store in a batch. Examples
are the “What’s trending” on Twitter, live sporting or music events and the stock market.
13. lOMoARcPSD|282 656 68
Step 2: Data Collection
● After defining the problem, you will need to collect the requisite data to derive
insights and turn the business problem into a probable solution.
● The process involves thinking through your data and finding ways to collect and get
the data you need. It can include scanning your internal databases or purchasing
databases from external sources.
● Many companies store the sales data they have in customer relationship management
(CRM) systems.
14. lOMoARcPSD|282 656 68
Step 3: Data Preparation
● After the first and second steps, when you have all the data you need, you will
have to process it before going further and analyzing it. Data can be messy if it
has not been appropriately maintained, leading to errors that easily corrupt the
analysis.
● The most common errors that you can encounter and should look out for are:
○ Missing values
○ Corrupted values like invalid entries
○ Time zone differences
○ Date range errors like a recorded sale before the sales even started
16. lOMoARcPSD|282 656 68
● Your data comes from several different places, and in this substep we focus on integrating
these different sources. Data varies in size, type, and structure, ranging from databases and
Excel files to text documents.
17. lOMoARcPSD|282 656 68
Step 4: Exploratory Data Analysis (EDA)
● EDA is used for seeing what the data can tell us before the modeling task.
● In this step, we have to develop ideas that can help identify hidden patterns and
insights.
● We have to find more interesting patterns in the data, such as why sales of a
particular product or service have gone up or down. We must analyze or notice
this kind of data more thoroughly.
● Exploratory data analysis methods are generally cross-classified in two ways:
○ First, each method is either non-graphical or graphical.
○ Second, each method is either univariate or multivariate (usually just
bivariate)
18. lOMoARcPSD|282 656 68
Univariate Analysis
● Univariate analysis is the simplest form of data analysis, where the data being
analyzed consists of only one variable.
● The main purpose of univariate analysis is to describe the data and find patterns that
exist within it.
● Common examples include:
○ Central tendency (mean, median, mode)
○ Variability (range, interquartile range, standard deviation, and variance)
○ Box Plots
○ Histograms
○ Pie Charts etc.
19. lOMoARcPSD|282 656 68
Bivariate Analysis
● The term bivariate analysis refers to the analysis of two variables.
● The purpose of bivariate analysis is to understand the relationship between two
variables.
● Common ways to perform bivariate analysis:
○ Scatterplots
○ Correlation Coefficients
○ Simple Linear Regression
Scatterplot Graph
20. lOMoARcPSD|282 656 68
Step 5: Data Modeling
● This is one of the most crucial processes as the Machine Learning Algorithm aids in creating a usable
Data Model. There are a lot of algorithms to pick from, the Model is selected based on the problem.
● There are three types of Machine Learning methods that are incorporated:
1. Supervised Learning
❖ As its name suggests, Supervised machine learning is based on supervision and here we
train the machines using the "labelled" dataset, and based on the training, the machine
predicts the output.
❖ Supervised machine learning can be classified into two types of problems, which are given
below:
● Classification
● Regression
22. lOMoARcPSD|282 656 68
2. Unsupervised Learning
❖ Unsupervised machine learning, the machine is trained using the unlabeled dataset, and the
machine predicts the output without any supervision.
❖ Unsupervised Learning can be further classified into two types, which are given below:
● Clustering
● Association
23. lOMoARcPSD|282 656 68
3. Reinforcement Learning
❖ Reinforcement learning works on a feedback-based process, in which an AI agent (A software
component) automatically explore its surrounding by hitting & trail, taking action, learning
from experiences, and improving its performance.
24. lOMoARcPSD|282 656 68
Step 6: Evaluation and Deployment
● In this phase it’s crucial to check that our Data Science Modelling efforts meet the
expectations.
● If the required precision is not achieved, you can go back to choose an alternate
Data Model, and then evaluate the model again.
● The Model which provides the best result based on test findings is completed and
deployed in the production environment whenever the desired result is achieved
through proper testing as per the business needs.
26. lOMoARcPSD|282 656 68
Data Science vs Data Mining:
S.No. Data Science Data Mining
1 Data Science is an area. Data Mining is a technique.
2
It is about collection, processing, analyzing and
utilizing of data into various operations. It is
more conceptual.
It is about extracting the vital and
valuable information from the data.
3
It deals with the all types of data i.e. structured,
unstructured or semi-structured.
It mainly deals with the structured forms
of the data.
4
It is a super set of Data Mining as data science
consists of Data scraping, cleaning,
visualization, statistics and many more
techniques.
It is a subset of Data Science as mining
activities which is in a pipeline of the
Data science.
5 It is mainly used for scientific purposes. It is mainly used for business purposes.
27. lOMoARcPSD|282 656 68
Data Mining:
● Data mining is also called knowledge
discovery in databases (KDD)
● Data mining is extraction of useful
patterns from data sources, e.g.,
databases, texts, web, image.
● Patterns must be: valid, novel,
potentially useful, understandable
28. lOMoARcPSD|282 656 68
The knowledge discovery process is an iterative sequence of the following steps:
1. Data cleaning (to remove noise and inconsistent data)
2. Data integration (where multiple data sources may be combined)
3. Data selection (where data relevant to the analysis task are retrieved from the database)
4. Data transformation (where data are transformed and consolidated into forms appropriate for
mining by performing summary or aggregation operations)
5. Data mining (an essential process where intelligent methods are applied to extract data patterns)
6. Pattern evaluation (to identify the truly interesting patterns representing knowledge based on
interestingness measures)
7. Knowledge presentation (where visualization and knowledge representation techniques are used to
present mined knowledge to users)
29. lOMoARcPSD|282 656 68
Data Warehousing:
● Suppose that AllElectronics is a successful international company with branches
around the world. Each branch has its own set of databases. The president of
AllElectronics has asked you to provide an analysis of the company’s sales per
item type per branch for the third quarter. This is a difficult task, particularly
since the relevant data are spread out over several databases physically located at
numerous sites.
● If AllElectronics had a data warehouse, this task would be easy.
30. lOMoARcPSD|282 656 68
● A data warehouse is a repository of information collected from multiple sources, stored
under a unified schema, and usually residing at a single site.
● Data warehouses are constructed via a process of data cleaning, data integration, data
transformation, data loading, and periodic data refreshing.
31. lOMoARcPSD|282 656 68
● A data warehouse is usually modeled by a
multidimensional data structure, called a data cube, in
which each dimension corresponds to an attribute or a
set of attributes in the schema, and each cell stores the
value of some aggregate measure such as count or sum
(sales_amount).
● Drill-down refers to the process of viewing data at a
level of increased detail, while roll-up refers to the
process of viewing data with decreasing detail.
32. lOMoARcPSD|282 656 68
Basic Statistical Description of Data:
● Basic Statistical descriptions of data can be used to identify properties of the data and
highlight which data values should be treated as noise or outliers.
● Types of Descriptive Statistics:
All descriptive statistics are either measures of central tendency or measures of
variability, also known as measures of dispersion.
1. Central Tendency (Measures of central tendency focus on the average or
middle values of data sets)
a. Mean
b. Median
c. Mode
For example, the sum of the following data set is 28: (2, 3, 4, 4, 4, 5, 6). The
mean is 4 (i.e. 28/7). The mode of a data set is the value appearing most often,
and the median is the figure situated in the middle of the data set.
33. lOMoARcPSD|282 656 68
2. Variability
● Measures of variability (or the measures of spread) helps in analyzing how dispersed
the distribution is for a set of data.
● Consider the following data set: 5, 19, 24, 62, 91, 100.
○ The range of that data set is 95, which is calculated by subtracting the
lowest number (5) in the data set from the highest (100).
3. Distribution
● Distribution (or frequency distribution) refers to the quantity of times a data point
occurs. Alternatively, it is the measurement of a data point failing to occur.
● Consider a data set: male, male, female, female, female, other. The distribution of this
data can be classified as:
○ The number of males in the data set is 2, The number of females in the data
set is 3, The number of individuals identifying as other is 1.
34. lOMoARcPSD|282 656 68
4. Univariate vs. Bivariate
● In descriptive statistics, univariate data analyzes only one variable.
○ For example, imagine a room full of high school students. Say you wanted to
gather the average age of the individuals in the room. This univariate data is
only dependent on one factor: each person's age.
● Bivariate data, on the other hand, attempts to link two variables by searching for
correlation. Two types of data are collected, and the relationship between the two pieces
of information is analyzed together.
○ Let's say each high school student in the example above takes a college
assessment test, and we want to see whether older students are testing better
than younger students. In addition to gathering the age of the students, we
need to gather each student's test score.