A feature-Enriched Completely Blind image Quality Evaluator
URMP2015
1. TRAINING AND TESTING
EXPERIMENTS
We use AVA dataset, a large-scale dataset for image quality
assessment
Total: 255,529 images
Training: 235,599 images
Testing: 19,930 images
EVALUATION
We employ different methods for evaluation:
2 error metrics: RMSE & MAE
Baseline comparison: compare to a trivial predictor
- accuracy: a method to visualize a predictor’s performance
QUALITY SCORE DISTRIBUTION PREDICTIONVARIATION IN CROWD OPINIONS
Photo Quality Assessment: Predicting Crowd Opinions
Uyen Mai, Feng Liu
Computer Graphics and Vision Lab
Portland State University
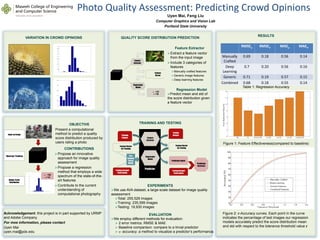
RESULTS
Table 1: Regression Accuracy
Feature Effectiveness.
Figure 1: Feature Effectiveness(compared to baseline)
Acknowledgement: this project is in part supported by URMP
and Adobe Company.
For moe information, please contact
Uyen Mai
uyen.mai@pdx.edu
Feature
Extractor
Regression
Model
Feature
Vector
= 5.1
= 1.0
“Black box” Predictor
Input: an Image
Output: Score
Distribution
= 4.9
= 1.2
Predictor
Training
Images
Training Ground
Truth Labels
Feature
Extractor
Feature Vector
for Training
Regression
Model
Testing
Images
Feature Vector
for Testing
Predicted Labels
Testing Ground
Truth Labels
Prediction
Accuracy
Fit a
Random
Forest
Model
RMSE RMSE MAE MAE
Manually
Crafted
0.69 0.18 0.56 0.14
Deep
Learning
0.7 0.20 0.56 0.16
Generic 0.71 0.19 0.57 0.15
Combined 0.68 0.18 0.55 0.14
OBJECTIVE
Present a computational
method to predict a quality
score distribution produced by
users rating a photo
CONTRIBUTIONS
Propose an innovative
approach for image quality
assessment
Propose a regression
method that employs a wide
spectrum of the state-of-the-
art features
Contribute to the current
understanding of
computational photography
Feature Extractor
Extract a feature vector
from the input image
Include 3 categories of
features
Manually crafted features
Generic image features
Deep learning features
Regression Model
Predict mean and std of
the score distribution given
a feature vector
Figure 2: ϵ-Accuracy curves. Each point in the curve
indicates the percentage of test images our regression
models accurately predict the score distribution mean
and std with respect to the tolerance threshold value ϵ