
Recommended
More Related Content
What's hot
What's hot (20)
Viewers also liked
Viewers also liked (15)
Similar to Efficient Frontier Searching of Fixed Income Portfolio under CROSS
Similar to Efficient Frontier Searching of Fixed Income Portfolio under CROSS (20)
Efficient Frontier Searching of Fixed Income Portfolio under CROSS
- 1. Efficient Frontier Searching of Fixed Income Portfolio under China Solvency II (CROSS) Framework Sun Zhi1 Abstract: With the enforcement of CROSS, regulatory capital optimization under the CROSS (China Risk Oriented Solvency System) framework is becoming strategic for insurance firms in China, Efficient frontier construction considering regulatory capital charge is now an indispensable part of the decision process of annual strategic asset allocation. This paper provides a systematic framework in constructing efficient frontiers for fixed income portfolios through the application of quadratic programming theory. In this framework, expected yield requirements, regulatory credit risk capital requirements and targeted interest rate risk offsetting effect measured by modified duration can be fulfilled in a high level of accuracy. Key words: CROSS; Efficient frontier; Credit risk regulatory capital; Expected yield; Duration 1. Introduction China Risk oriented solvency system(CROSS) is a critical regulatory reform and key innovation put forward by China Insurance Regulatory Commission(CIRC), in order to regulate booming Chinese insurance industry in a more proactive and dynamic way. CROSS is mainly comprised of three pillars with the first pillar impose minimum regulatory capital based on the risk characteristics of various kinds of asset and liabilities and pillar two stresses on the importance of enterprise wide risk management through add-on capital linked to the quality of risk management conducts in insurance firms. Pillar three of CROSS establish a systematic mechanism for regulatory reporting and market disclosure, strengthening the influence of external supervision and market discipline on the governance of insurance firms. The formal enacting and implementation of CROSS will inevitably exert great impact on the entire insurance industry, millions of insurance policy holders as well as the real economy. Under CROSS framework, the level of risk assumed by an insurance firm’s balance sheet directly determines the amount of regulatory capital that needs to be set aside. Against the backdrop of interest rate sliding down in China, more insurance firms are taking aggressive asset driven expansion strategy. These firms tend to invest significantly in more risky financial products with higher expected yield but significant higher risk. As a result, the regulatory capital imposed on these firms is much higher than regulatory capitals required for their counterparts following traditional insurance operation models. 1 Risk Management Department, Hua Xia Life Insurance Limited, Beijing 100086, China. Email:sunzhi822@yahoo.com.sg. This paper represents only the personal views of the author.
- 2. With CROSS pending full implementation, regulatory capital optimization under the CROSS framework is becoming a strategic task in virtually all insurance firms in China. In addition, efficient frontier construction considering regulatory capital charge is now an essential step of the decision process of annual strategic asset allocation in many sophisticated insurance firms. This paper provides a systematic approach in searching for the optimal fixed income portfolio where the regulatory credit risk capital limit is not breached and the expected yield reaches the highest level possible, while achieving targeted interest rate risk offsetting effect measured by modified duration. 2. Optimization Problem Formulation Without loss of generality, in this paper, the investment choices of insurance firms are limited to high-grade corporate bonds and risk free government bonds with modified duration from one year to ten years. As CIRC only allow insurance firms to invest in AA class or above corporate bonds, choices of corporate bonds are further limited to AAA, AA+, AA, AA- corporate bonds. In CROSS framework corporate bonds that are classified as available for sale or trading in accounting treatment are subject to credit spread risk charge only. As for corporate bonds classified as hold to maturity in accounting treatment, these bonds are subject to default risk charge. Government bonds are free of any credit related regulatory capital charge in CROSS. With investment choices limited as above, both credit spread risk charge and default risk charge can be represented as simple numerical vectors. The following variables are defined for the ease of exposition: x is a nonnegative vector, denoting the vector of fixed income investment choices, defined as below. x1 …x10: AAA corporate bonds classified as available for sale or trading in accounting with duration from one year to ten years in ascending order. x11 …x20: AA+ corporate bonds classified as available for sale or trading in accounting with duration from one year to ten years in ascending order. x21 …x30: AA corporate bonds classified as available for sale or trading in accounting with duration from one year to ten years in ascending order. x31 …x40: AA- corporate bonds classified as available for sale or trading in accounting with duration from one year to ten years in ascending order. x41 …x50: Government bonds classified as available for sale or trading in accounting with duration from one year to ten years in ascending order. x51…x100 are defined in the same fashion for AAA, AA+, AA, AA- rated corporate bonds and Government bonds but classified as hold to maturity in accounting treatment. y: vector of expected yields for AAA, AA+, AA, AA- rated corporate bonds and Government bonds corresponding to durations from one year to ten years.
- 3. y1 …y50 represents expected yields of different types of bonds and durations similar to the way x1 …x50 is defined. Accounting classification has no impact on the expected yields. sc: credit spread charge vector given in CROSS. dc: default charge vector in CROSS. ρ: correlation factor used for aggregating credit spread risk charge and default risk charge. The objective function of the optimization problem can be constructed as below: Minimization of the square of regulatory capital assumed Where: A = scT *sc +dcT *dc+2* ρ *scT *dc Based on the real data from CROSS regulation, it is easy to verify that A is an indefinite matrix and hence RC(x) 2 is a non-convex quadratic function. The following constraints are set up to factor in key criteria in making fixed income asset allocation decisions including expected yield. Constraint 1: investment size limit ∑ Where: Z denotes total investment size. Constraint 2: expected yield target ∑ ∑ Where: Y denotes the expected yield target of the fixed income portfolio Constraint 3: percentage limit on bonds classified as hold to maturity in accounting treatment ∑ Where: R is the maximum ratio of bonds that can classified as hold to maturity in accounting treatment. Constraint 4: portfolio duration target Duration measures interest rate sensitivity of the fixed income portfolio and is a relatively accurate measure in reflecting the amount of interest rate risk exposure originating from the liability side of insurance firms that can be offset.
- 4. ∑ ∑ Where: D represents the overall fixed income portfolio duration. By now, the questing of efficient frontier under CROSS for fixed income portfolio has been formulated as a quadratic programming problem with linear constraints. Since the objective function is not a convex function, there is no guarantee of a unique globally optimized solution, which is available in closed formula if the objective function is convex. In this case, the solution of this optimization problem has to resort to numerical methods. 3. Overview of the Numerical Methods Quadprog function in Matlab’s Optimization Toolbox is a widely adopted local solver implementation for quadratic problems. It is able to find a locally optimal solution to quadratic optimization problems in a fast and reliable way. In this paper, a Multi-start technique is used in conjunction with Matlab’s Quadprog function, which implements an active-set strategy. The goal is to seek the best local optimal solution in the collection of local optimal solutions arrived from different starting points located on a uniform grid with a relatively large size of dimension. A brief review of the key principles of the active-set strategy in solving quadratic programming problem is given as below: The optimization problem can be posed more generically as below: The feasibility region is denoted as . The active-set strategy is mainly composed of the following two steps: Step 1: if the starting point is not feasible, a feasible starting point is calculated through solving a linear programming problem. Step 2: an active set matrix Sk is maintained as an estimate of the active constraints at the solution point. Sk is updated at each iteration k. The search direction dk that minimizes the objective function while remaining on active constraint boundaries is calculated. Next, Lagrange multipliers, λk, are calculated. If all elements of λk are positive, xk is the optimal solution of the quadratic programming problem. However, if any component of λk is negative, and the component does not correspond to an equality constraint, then the corresponding element is deleted from the active set and a new iteration point is sought.
- 5. 4. Key Simulation Results and the Projected Efficient Frontier In order to provide more insights on the impact of CROSS regulatory framework on fixed income investment decisions, a comprehensive simulation case is constructed mimicking the real investment decision context of Chinese insurance firms. As CIRC only allow insurance firms to invest in AA class or above corporate bonds, the investment choices in this simulation case are limited to AAA, AA+, AA, AA- corporate bonds and risk free government bonds. The yield curves for each type of the bonds are freely available on www.chinabond.com.cn and these curves retrieved are used to construct the following yield table with entries associated with different ratings and modified durations. Modified Duration/ Risk Rating AAA AA+ AA AA- Government Bond 1 3.334793 3.715183 4.075118 5.280336 2.598444 2 3.689818 4.06381 4.406722 6.108481 2.743498 3 3.752241 4.167423 4.534621 6.225571 2.880162 4 3.892922 4.375252 4.757626 6.447706 2.964192 5 4.030127 4.658369 5.061125 6.867294 3.071944 6 4.045612 4.731762 5.214426 6.995973 3.172192 7 4.10264 4.829489 5.38639 7.18747 3.167761 8 4.165817 4.956765 5.570569 7.367911 3.145756 9 4.235908 5.046077 5.684212 7.483511 3.209506 10 4.305998 5.135389 5.797856 7.613261 3.304508 Table 1: Bond yield in percentages as of 19th of Nov 2015 Default charge table in CROSS is given as below: Risk Rating Default Charge Factor AAA 0.015 AA+ 0.036 AA 0.045 AA- 0.049 Table 2: CROSS default risk charge table for corporate bonds Credit risk spread charge table in CROSS is as follows: Risk Rating Modified Duration Credit Spread Risk Charge Factor AAA 0<D≤5 D (-0.0015 D+0.0175) D>5 D 0.010 AA+ 0<D≤5 D (-0.0014 D+0.018) D>5 D 0.011 AA 0<D≤5 D (-0.0013 D+0.0195) D>5 D 0.013 AA- 0<D≤5 D (-0.0012 D+0.022) D>5 D 0.016
- 6. Table 3: CROSS credit risk spread charge table for corporate bonds With the above population of key variables, the simulation is conducted for various expected yield targets with asset duration and without asset duration constraint. The percentage limit on bonds classified as hold to maturity in accounting treatment is set as 20%. In each optimization run, Matlab’s Quadprog function is executed with maximum evaluation run of 20,000, in order to achieve an accurate local optimal point. To ensure a reasonable level of accuracy of the global convergence of the results, a multi-start strategy is deployed with a 9 100 uniform grid composed of different starting points. In the simulation results, the converging trend of optimization results is reasonably good, and it improves further with yield target getting higher. The following figure depicts the simulated efficient frontier without restriction on the target asset duration: Figure 1: efficient frontier with no asset duration constraint As shown from the figure above, there is a monotone increasing relationship between expected yield and credit risk regulatory capital required in the efficient frontier. This testifies the key principle behind CROSS regulatory framework, which impose more regulatory capital for more risky assets with higher expected yield. In addition, the slope of increasing is getting flatter as expected yield goes up. Namely, when expected yield reaches a certain level, the marginal gain on expected yield is coupled with a significant increase in regulatory capital charge. For example, in the figure above, an increase in expected yield from 7% to 7.5% will result in an additional credit risk regulatory capital charge close to 5% of investment size, which may not be economical when insurance firms’ own capital is scarce. In most cases, insurance firms are facing significant interest rate risk arising predominantly from the liability end due to its massive size and relatively long duration. Asset duration is a key measure of the amount of interest rate exposure that can be mitigated through proper investment in fixed income instruments. Target asset duration constraint can be easily managed in the optimization framework given in this paper. 0.00% 1.00% 2.00% 3.00% 4.00% 5.00% 6.00% 7.00% 8.00% 0.00% 2.00% 4.00% 6.00% 8.00% 10.00% 12.00% 14.00% Expected Yield Minimum Credit Risk Capital Required/Portfolio Size No Duration Constraint
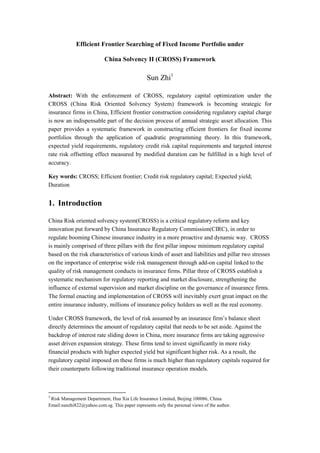
- 7. The figure below is a contrast of two efficient frontiers with no asset duration constraint and target asset duration of 10 years: Figure 2: efficient frontiers with no asset duration constraint and target asset duration of 10 years Based on the current values of CROSS credit risk spread charge factors and default risk charge factors, hold to maturity corporate bonds with long duration tends to consume less credit risk capital than the same type of bond but classified as trading or available for sale. This simulation study does verify that hold to maturity corporate bonds of long duration are preferred over the same type of bonds classified as trading or available for sale if credit risk regulatory capital is the sole concern. The figure below is a contrast of two efficient frontiers having hold to maturity asset ratio as 20% and 40% respectively, without asset duration constraint. 0.00% 1.00% 2.00% 3.00% 4.00% 5.00% 6.00% 7.00% 8.00% 0.00% 2.00% 4.00% 6.00% 8.00% 10.00% 12.00% 14.00% Expected Yield Minimum Credit Risk Capital Required/Portfolio Size Target Duration = 10 No Duration Constraint 0.00% 1.00% 2.00% 3.00% 4.00% 5.00% 6.00% 7.00% 8.00% 0.00% 2.00% 4.00% 6.00% 8.00% 10.00% 12.00% 14.00% Expected Yield Minimum Credit Risk Capital Required/Portfolio Size No Duration Constraint,HTM Asset Ratio=40% No Duration Constraint,HTM Asset Ratio=20%
- 8. 5. Conclusion Risk based capital regulatory regime is becoming a consensus among regulators from different regions and key industry players in both banking and financial industry. CROSS is a revolutionary initiative in China’s insurance regulation, which will have profound and long- lasting effects on the operation of insurance firms in the Chinese market. This paper establishes a comprehensive, easy to implement and efficient framework in the form of a non-convex quadratic programming problem with linear constraints for the purpose of fixed income investment decision. With this aid of this framework, insurance firms can achieve significantly superior investment return without incurring additional regulatory capital. As a natural product of the quadratic optimization problem, this framework provides the investment choices across the fixed income instrument spectrum to achieve the minimum regulatory capital with fixed expected yield target. Taking advantage of the monotone increasing relationship between regulatory capital consumed and expected yield on the efficient frontier, this framework is also able to provide investment choices achieving optimal expected yield with given credit risk regulatory capital limit. In addition to expected yield and regulatory capital, other key measures of significance to fixed income investment such as asset duration and the ratio of hold to maturity assets are also nicely fitted into the optimization framework of this paper. This provides more flexibility for deriving optimal fixed income investment decisions. The targeted asset duration constraint is especially critical as it measures interest rate risk mitigation effect. The interest rate risk mitigation effect can be combined with credit risk regulatory capital to provide a more complete picture on the impact of fixed income portfolio on the overall regulatory capital. It is also found out that hold to maturity corporate bonds of long duration are preferred over the same type of bonds classified as trading or available for sale if credit risk regulatory capital is the sole concern. This optimization framework is also highly scalable in two directions. Firstly, other specific investment decision constrains can always be added as linear constraints with little impact on performance. In addition, the choices of bonds can be extended to bonds with durations that are not integer through enlarging the size of the investment choice vector.
- 9. References: [1] China Risk Oriented Solvency System, Rules 1-17, China Insurance Regulatory Commission [2] H.D. Qi, D. Sun, Correlation stress testing for value-at-risk: an unconstrained convex optimization approach, Comput. Optim. Appl. 45 (2010) 427–462. [3] Andrew R. Conn et al, A Globally Convergent Augmented Langrangian Algorithm for Optimization with General Constraints and Simple Bounds , SIAM Journal on Numerical Analysis, Vol. 28, No. 2 (Apr., 1991) 545-572. [4] MATLAB Reference Guide, the MathWorks Inc., Natick, MA, 2010. [5]J.Q.Chen, Samuel Burer, Globally Solving Nonconvex Quadratic Programming Problems via Completely Positive Programming, Argonne National Laboratory. [6] P. Pardalos, Global optimization algorithms for linearly constrained indefinite quadratic problems. Computers and Mathematics with Applications, 21 (1991) 87-97. [7] Ji Ying, Li Yijun, a Global Optimization Algorithm for Sum of Quadratic Ratios Problem with Coefficients, the 2nd International Conference on Computer Application and System Modeling (2012) [8] V. Moraru, An Algorithm for Solving Quadratic Programming Problems, Computer Science Journal of Moldova, vol.5, no.2(14), 1997 [9] H.D. Qi, D. Sun, A quadratically convergent Newton method for computing the nearest correlation matrix, SIAM J. Matrix Anal. Appl. 28 (2006) 360–385. [10] Y. Yuan, W. Sun, Optimization Theory and Methods, Science Press, Beijing, 2010. [11] H. Markowitz, Portfolio selection, J. Finance 7 (1952) 77–91.