
Recommended
Recommended
More Related Content
Viewers also liked
Viewers also liked (11)
Similar to BB&T Report Card 2015
Similar to BB&T Report Card 2015 (20)
Recently uploaded
Recently uploaded (20)
BB&T Report Card 2015
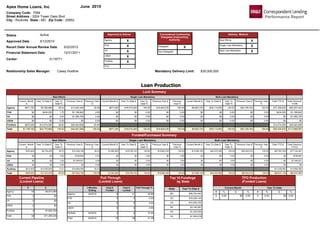
- 1. Status : Active Approved Date : 5/12/2010 Recert Date/ Annual Review Date: 5/22/2012 Financial Statement Date: 12/31/2011 Center: 5119771 Approved to Deliver: Agency X FHA X VA X USDA X Portfolio X TPO Conventional Conforming Delegated Underwriting Authority: Delegated X Non-Delegated Delivery Method: Best Efforts X Single Loan Mandatory X Bulk Loan Mandatory X Casey HuetherRelationship Sales Manager: $30,000,000Mandatory Delivery Limit: Loan Production Lock Summary Best Efforts Single Loan Mandatory Bulk Loan Mandatory Current Month $ Year To Date $ Year To Date % Previous Year $ Previous Year % Current Month $ Year To Date $ Year To Date % Previous Year $ Previous Year % Current Month $ Year To Date $ Year To Date % Previous Year $ Previous Year % Total YTD $ Total Previous YTD$ Agency $120,000 $11,105,785 40.61 $13,202,445 29.38 $0 $19,515,293 100.00 $16,825,235 100.00 $5,491,551 $73,988,512 100.00 $52,199,764 100.00 $104,609,590 $82,227,444 FHA $0 $434,250 1.59 $1,189,845 2.65 $0 $0 0.00 $0 0.00 $0 $0 0.00 $0 0.00 $434,250 $1,189,845 VA $0 $0 0.00 $1,085,700 2.42 $0 $0 0.00 $0 0.00 $0 $0 0.00 $0 0.00 $0 $1,085,700 USDA $0 $0 0.00 $0 0.00 $0 $0 0.00 $0 0.00 $0 $0 0.00 $0 0.00 $0 $0 Portfolio $1,235,000 $15,809,550 57.81 $29,463,698 65.56 $15,809,550 $29,463,698 Total $1,355,000 $27,349,585 100.00 $44,941,688 100.00 $0 $19,515,293 100.00 $16,825,235 100.00 $5,491,551 $73,988,512 100.00 $52,199,764 100.00 $120,853,390 $113,966,687 Funded/Purchased Summary Best Efforts Single Loan Mandatory Bulk Loan Mandatory Current Month $ Year To Date $ Year To Date % Previous Year $ Previous Year % Current Month $ Year To Date $ Year To Date % Previous Year $ Previous Year % Current Month $ Year To Date $ Year To Date % Previous Year $ Previous Year % Total YTD $ Total Previous YTD $ Agency $560,000 $8,384,580 34.87 $10,328,156 38.22 $0 $19,433,993 100.00 $16,892,235 100.00 $7,946,031 $75,418,661 100.00 $50,522,070 100.00 $103,237,234 $77,742,461 FHA $0 $0 0.00 $729,904 2.70 $0 $0 0.00 $0 0.00 $0 $0 0.00 $0 0.00 $0 $729,904 VA $0 $0 0.00 $1,095,521 4.05 $0 $0 0.00 $0 0.00 $0 $0 0.00 $0 0.00 $0 $1,095,521 USDA $0 $0 0.00 $0 0.00 $0 $0 0.00 $0 0.00 $0 $0 0.00 $0 0.00 $0 $0 Portfolio $0 $15,660,850 65.13 $14,869,599 55.03 $15,660,850 $14,869,599 Total $560,000 $24,045,430 100.00 $27,023,180 100.00 $0 $19,433,993 100.00 $16,892,235 100.00 $7,946,031 $75,418,661 100.00 $50,522,070 100.00 $118,898,084 $94,437,485 Current Pipeline (Locked Loans) # $ Agency 7 $1,639,020 FHA 0 $0 VA 0 $0 USDA 0 $0 Portfolio 2 $1,235,000 Total 9 $2,874,020 Pull Through (Locked Loans) 3 Months Ending Total # Funded Total # Locked Pull Through % Agency 07/2015 8 10 80.00 FHA 07/2015 0 1 0.00 VA 0 0 0.00 USDA 0 0 0.00 Portfolio 07/2015 2 2 100.00 Total 07/2015 10 13 76.92 State Year To Date $ MD $71,163,005 DC $23,099,164 VA $15,126,605 DE $5,314,467 PA $2,273,625 NJ $1,301,618 FL $619,600 Top 10 Fundings by State TPO Production (Funded Loans) Current Month Year To Date # % $ % # % $ % 0 0.00 $0 0.00 0 0.00 $0 0.00 Apex Home Loans, Inc September 2015 Company Code: 7084 Street Address : 3204 Tower Oaks Blvd City : Rockville State : MD Zip Code : 20852 Performance Report
- 2. Loan Quality Credit Scores Agency FHA VA USDA Portfolio Current Month % Last 12 Months % Current Month % Last 12 Months % Current Month % Last 12 Months % Current Month % Last 12 Months % Current Month % Last 12 Months % 740+ 57.14 70.86 0.00 0.00 0.00 0.00 0.00 0.00 0.00 96.15 700-739 35.71 24.33 0.00 0.00 0.00 0.00 0.00 0.00 0.00 3.85 680-699 7.14 4.55 0.00 0.00 0.00 0.00 0.00 0.00 0.00 0.00 660-679 0.00 0.00 0.00 0.00 0.00 0.00 0.00 0.00 0.00 0.00 620-659 0.00 0.27 0.00 0.00 0.00 0.00 0.00 0.00 0.00 0.00 Below 620 0.00 0.00 0.00 0.00 0.00 0.00 0.00 0.00 0.00 0.00 Loan To Values Agency FHA VA USDA Portfolio Current Month % Last 12 Months % Current Month % Last 12 Months % Current Month % Last 12 Months % Current Month % Last 12 Months % Current Month % Last 12 Months % <=75% 57.14 43.05 0.00 0.00 0.00 0.00 0.00 0.00 0.00 65.38 75.01-80% 32.14 30.21 0.00 0.00 0.00 0.00 0.00 0.00 0.00 34.62 80.01-85% 3.57 3.48 0.00 0.00 0.00 0.00 0.00 0.00 0.00 0.00 85.01-90% 0.00 10.70 0.00 0.00 0.00 0.00 0.00 0.00 0.00 0.00 90.01-95% 7.14 12.57 0.00 0.00 0.00 0.00 0.00 0.00 0.00 0.00 >95% 0.00 0.00 0.00 0.00 0.00 0.00 0.00 0.00 0.00 0.00 Debt To Income Agency FHA VA USDA Portfolio Current Month % Last 12 Months % Current Month % Last 12 Months % Current Month % Last 12 Months % Current Month % Last 12 Months % Current Month % Last 12 Months % <=30% 46.43 41.71 0.00 0.00 0.00 0.00 0.00 0.00 0.00 38.46 30.01-35% 25.00 16.31 0.00 0.00 0.00 0.00 0.00 0.00 0.00 34.62 35.01-40% 10.71 18.72 0.00 0.00 0.00 0.00 0.00 0.00 0.00 19.23 40.01-45% 10.71 18.98 0.00 0.00 0.00 0.00 0.00 0.00 0.00 7.69 45.01-50% 7.14 4.28 0.00 0.00 0.00 0.00 0.00 0.00 0.00 0.00 50.01-55% 0.00 0.00 0.00 0.00 0.00 0.00 0.00 0.00 0.00 0.00 >55% 0.00 0.00 0.00 0.00 0.00 0.00 0.00 0.00 0.00 0.00 Apex Home Loans, Inc September 2015 Company Code: 7084 Street Address : 3204 Tower Oaks Blvd City : Rockville State : MD Zip Code : 20852 Performance Report
- 3. Loan Performance Delinquency Information (Units) Funded Last 12 Months (Rolling) - 2 Month Lag Funded Last 24 Months (Rolling) - 2 Month Lag Total Servicing Portfolio 30Day 60 Day 90 Day 120 Day Tot Del Total Loans Funded 30 Day 60 Day 90 Day 120 Day Tot Del Total Loans Funded 30Day 60 Day 90 Day 120 Day Tot Del Total Loans Serv # Total Loans Serv $ #/% #/% #/% #/% #/% #/% #/% #/% #/% #/% #/% #/% #/% #/% #/% AGENCY ARM 0 / 0.00 0 / 0.00 0 / 0.00 0 / 0.00 0 / 0.00 7 0 / 0.00 0 / 0.00 0 / 0.00 0 / 0.00 0 / 0.00 16 0 / 0.00 0 / 0.00 0 / 0.00 0 / 0.00 0 / 0.00 42 $12,831,570 AGENCY FIX 1 / 0.27 0 / 0.00 0 / 0.00 0 / 0.00 1 / 0.27 364 1 / 0.20 0 / 0.00 0 / 0.00 0 / 0.00 1 / 0.20 495 2 / 0.25 0 / 0.00 0 / 0.00 0 / 0.00 2 / 0.25 806 $253,667,820 FHA 0 / 0.00 0 / 0.00 0 / 0.00 0 / 0.00 0 / 0.00 0 0 / 0.00 0 / 0.00 0 / 0.00 0 / 0.00 0 / 0.00 7 0 / 0.00 0 / 0.00 0 / 0.00 0 / 0.00 0 / 0.00 26 $8,304,260 PORTFOLIO ARM 0 / 0.00 0 / 0.00 0 / 0.00 0 / 0.00 0 / 0.00 4 0 / 0.00 0 / 0.00 0 / 0.00 0 / 0.00 0 / 0.00 10 0 / 0.00 0 / 0.00 0 / 0.00 0 / 0.00 0 / 0.00 16 $10,244,120 PORTFOLIO FIX 0 / 0.00 0 / 0.00 0 / 0.00 0 / 0.00 0 / 0.00 22 0 / 0.00 0 / 0.00 0 / 0.00 0 / 0.00 0 / 0.00 27 0 / 0.00 0 / 0.00 0 / 0.00 0 / 0.00 0 / 0.00 40 $28,258,367 USDA 0 / 0.00 0 / 0.00 0 / 0.00 0 / 0.00 0 / 0.00 0 0 / 0.00 0 / 0.00 0 / 0.00 0 / 0.00 0 / 0.00 0 0 / 0.00 0 / 0.00 0 / 0.00 0 / 0.00 0 / 0.00 0 $0 VA 0 / 0.00 0 / 0.00 0 / 0.00 0 / 0.00 0 / 0.00 0 0 / 0.00 0 / 0.00 0 / 0.00 0 / 0.00 0 / 0.00 6 0 / 0.00 0 / 0.00 0 / 0.00 0 / 0.00 0 / 0.00 24 $10,123,760 TOTAL 1 / 0.25 0 / 0.00 0 / 0.00 0 / 0.00 1 / 0.25 397 1 / 0.18 0 / 0.00 0 / 0.00 0 / 0.00 1 / 0.18 561 2 / 0.21 0 / 0.00 0 / 0.00 0 / 0.00 2 / 0.21 954 $323,429,897 Early Payment Default Previous Month Last 12 Months # # Agency 0 0 FHA 0 0 VA 0 0 USDA 0 0 Portfolio 0 0 Total 0 0 Early Payoff Previous Month Last 12 Months # # Agency 0 2 FHA 0 0 VA 0 0 USDA 0 0 Portfolio 0 1 Total 0 3 Apex Home Loans, Inc September 2015 Company Code: 7084 Street Address : 3204 Tower Oaks Blvd City : Rockville State : MD Zip Code : 20852 Performance Report
- 4. Loan Delivery Credit Pends Current Month Previous Month Loans Reviewed # Loans Pended # Loans Pended % Average # Days to Clear Loans Reviewed # Loans Pended # Loans Pended % Average # Days to Clear 0 0 0.00 0.00 0 0 0.00 0.00 Operational Pends Current Month Previous Month Loans Reviewed # Loans Pended # Loans Pended % Average # Days to Clear Loans Reviewed # Loans Pended # Loans Pended % Average # Days to Clear 24 21 87.50 3.57 27 17 62.96 1.31 Credit Pend Conditions for Pended Loans Condition Current Month Previous Month # % # % Assets/Reserves 0 0.00 0 0.00 Income Calculation/Documentation 0 0.00 0 0.00 Appraisal 0 0.00 0 0.00 Invalid/ Incomplete Credit 0 0.00 0 0.00 Employment Verification/Documentation 0 0.00 0 0.00 Compliance Documentation 0 0.00 0 0.00 Incomplete Initial Application 0 0.00 0 0.00 Miscellaneous/Other 0 0.00 5 100.00 Totals 0 0.00 5 100.00 Condition Current Month Previous Month # % # % Incomplete Application 0 0.00 0 0.00 Escrow Information Incomplete 0 0.00 0 0.00 Closing Legal Documents Incomplete/Incorrect 1 4.00 2 22.22 Compliance 0 0.00 0 0.00 Upload to Freddie Mac Selling System 0 0.00 0 0.00 Transmittal (1008) AUS Findings do not match 0 0.00 0 0.00 Tax Transcript Missing 0 0.00 0 0.00 HPML Certification Missing 0 0.00 0 0.00 Proof of MERS Registration Missing 0 0.00 0 0.00 SSR Missing 0 0.00 0 0.00 Color Appraisal Missing 0 0.00 0 0.00 Subordination Agreement Missing 0 0.00 0 0.00 Loan Org ID Missing 0 0.00 0 0.00 Need proof of Upfront MI payment 0 0.00 0 0.00 Miscellaneous/Other 24 96.00 7 77.78 TOTAL 25 100.00 9 100.00 Operational Pend Conditions for Pended Loans Outstanding MICs # of Loans > 60 Days 0 Outstanding LGCs # of Loans > 60 Days 0 Outstanding LNGs # of Loans > 60 Days 0 Outstanding Repurchases # $ 0 0.00 Apex Home Loans, Inc September 2015 Company Code: 7084 Street Address : 3204 Tower Oaks Blvd City : Rockville State : MD Zip Code : 20852 Performance Report