2. Shale gas extraction utilizes hydraulic fracturing, or “fracking”,
to release the entrapped gas by fracturing the source rock. This is
done by pumping large amounts of a mixture of water, sand and
additives into the well at high pressure.4,5
Some have suggested
that hydraulic fracturing of the rock could induce methane
migration toward the surface, potentially contaminating ground-
water resources.6−10
Yet, the most probable pathways of
groundwater contamination by methane or flow-back waters
(i.e., fracking fluids and recovered saline groundwater) are leaks
through badly cemented well casings, and flow-back waters
spillage on the surface.5−11
Studies carried out in the Marcellus
shale have reported high thermogenic methane concentrations in
groundwater located within a distance of 1 km from fracked
wells, as suggested by carbon (δ13
C) and hydrogen (δ2
H) stable
isotope analyses.8−12
It is unclear however whether the gas
migrated through fracking-induced fractures or leaky casings.7−11
Li and Carlson (2014) found no correlation between dissolved
methane concentration and distance to oil/gas well or well
density in Northeastern Colorado. However, these authors have
shown that the number of shallow groundwater wells with
methane concentrations >5 mg/L decreased as the distance to an
oil/gas well became greater than 700 m.13
Darrah et al. (2014)
recently reported that contaminated wells in the Barnett and
Marcellus shales were linked to gas leakage from intermediate-
depth strata through failures of annulus cement, faulty
production casings, or an underground gas well failure, ruling
out upward migration from depth through overlying geological
strata.7
Few studies worldwide report methane concentrations and
sources before hydraulic fracturing, although local legislations
requiring companies to assess local baseline methane concen-
trations before drilling are progressively being implemented.14
In
New York State, Kappell et al. (2012) reported natural methane
levels in groundwater but did not assess its source,15
while
McPhillips et al. (2014) found that methane concentrations were
mostly correlated to groundwater chemistry, with little influence
from valleys versus upslope location of the wells, distance from a
conventional gas well, or geohydrologic units.16
McIntosh et al.
(2014) reported that dissolved methane in groundwater of
southwestern Ontario (Canada) was almost exclusively microbial
in origin and that its concentration was linked to bedrock
geology.17
To our knowledge, the only study reporting the
analysis of groundwater quality before and after hydraulic
fracturing is that of Boyer et al. (2011).18
These authors reported
no statistical difference in groundwater−methane concentrations
before and after drilling with or without hydraulic fracturing
(approximately 50% of the wells were fracked). The dissolved
methane concentration was higher in one well following drilling,
but this well had not been hydraulically fractured.18
Longer
monitoring periods maybe required to understand potential risks
to shallow groundwater owing to the slow migration rate of
contaminants (gas and fluid) through the well casing, the
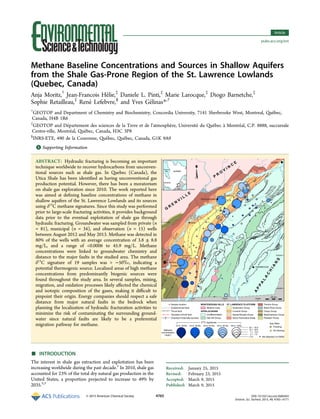
Figure 1. Map of sampled area and the St. Lawrence Lowlands geology and tectonic structures. Methane concentrations are represented with the size of
the circles and methane δ13
C signatures by their color. Note that the “fracked” wells (orange stars) appearing on the map are private exploration wells
fracked before the moratorium in 2010. They are sealed and cannot be accessed to collect gas samples.
Environmental Science & Technology Article
DOI: 10.1021/acs.est.5b00443
Environ. Sci. Technol. 2015, 49, 4765−4771
4766
3. sedimentary sequence or natural preferential flow paths.19
To
assess whether methane contamination is associated with
fracking, it is therefore important to monitor both the baseline
concentrations of methane and its isotopic signature prior to
shale gas extraction.8,10,12,15−17,20
Discriminating between deep thermogenic and shallow
bacterial sources of methane using stable carbon isotope
signatures is crucial to distinguish between the natural presence
of methane in groundwater and potential contamination
sources.18,21−24
Furthermore, it is important to assess whether
a relationship exists between the natural occurrence/concen-
tration of thermogenic methane and the main geological features
of the study area, such as the presence of faults and the lithology.
In the St. Lawrence Lowlands (Quebec, Canada), the Utica
Shale has been targeted by energy companies because of its
potential for shale gas production, but total recoverable reserves
still have to be fully assessed.25
Since 2010, there has been a
moratorium on shale gas exploration and exploitation. Recently,
the Quebec government has launched scientific, societal, and
economic studies on the risks and benefits of potential future
shale gas exploitation.26
These studies offered a unique
opportunity to measure hydrocarbon gas concentrations and
δ13
C signatures in shallow aquifers in an area not yet affected by
shale gas exploitation, and hence to document baseline
concentrations and sources of dissolved hydrocarbon gases.27
This paper presents methane, ethane and propane concen-
trations as well as the δ13
C signature of methane from 130
municipal, private and observation wells sampled in the area of
the St. Lawrence Lowlands. Approximately 1.9 million people
live in this region, which is the most important and fertile
agricultural area of the Quebec Province (Canada), and which
has recently been assessed for the shale gas potential from the
Utica Shale.25,28
■ MATERIALS AND METHODS
Geology and Hydrogeology. Located within the St.
Lawrence Lowlands, the study area corresponds to a 15 435
km2
corridor between Montreal and Quebec City, bordered by
the Appalachian Mountains (southeast) and the north shore of
the St. Lawrence River (northwest) (Figure 1). This corridor
corresponds to the main exploration area of the Utica Shale gas.25
The area overlaps two geological provinces: the St. Lawrence
Platform, a Cambrian−Ordovician carbonate and siliciclastic
platform, and the Cambrian−Devonian orogeny of the
Appalachian Mountains. The Ordovician sedimentary units of
the St. Lawrence Platform crossed by the sampled wells are in
stratigraphic order:29
(1) 30−300 m thick calcareous mudstone
of the Utica Shale with a total organic carbon content (TOC)
between 1 and 1.5% and the facies- and time-equivalent Stony
Point Formation;28
(2) the Sainte-Rosalie Group, a typical flysch
consisting of a succession of siltstone, mudstone, silty shale and
rare dolomitic units; (3) a turbiditic unit dominated by
mudstones with subordinate alternating sandstone and siltstone
of the Lorraine Group with TOC between 0.5 and 1%. This
group is the most exposed in the St. Lawrence Lowlands (Figure
1); and finally (4) shale, sandstone and conglomerates of the
“molasse”-type Queenston Group. The Ordovician sedimentary
sequence of the St. Lawrence Platform is directly overlain by
Quaternary sediments made of glacial tills, marine and lacustrine
silt, and from Champlain Sea silty clays and glacio-fluvial sands
(11 200−9800 yrs).30
In the Appalachian Mountains, the
fractured bedrock aquifer is composed of metasediments, mainly
shales, schists, slates, and phyllades belonging to several units of
Cambrian−Ordovician age. A detailed stratigraphy of the study
area is reported in Pinti et al. (2014).31
The study area is marked by multiple faults, with the most
important ones being the Yamaska normal fault bordering the St.
Lawrence River and the Logan line, a thrust fault that marks the
transition between the St. Lawrence Platform and the
Appalachian Mountains (Figure 1). A regional semiconfined or
confined aquifer is located in the Ordovician fractured bedrock of
moderate hydraulic conductivity (∼10−6
−10−5
m/s). Limited
extent granular aquifers are found also in the superficial coarse-
grained Quaternary sediments, such as the glacio-fluvial or fluvial
sands. The main groundwater flow directions in the bedrock
aquifer are SE-NW and follow the general topography, with
recharge occurring mostly in the Appalachian Mountains and
discharge to the St. Lawrence River or its main tributaries.32
Aquifer confinement increases gradually from the highest
elevations toward the St. Lawrence Platform.
Groundwater chemistry shows the occurrence of low-salinity
water, dominantly of Ca−Mg−HCO3
−
type, close to the
recharge areas of the Appalachian Mountains. This water evolves
by ion exchange into a Na-HCO3 type downstream, with
electrical conductivity ranging from 88 to 4,466 μS/cm in the
study area. Saline groundwater (conductivity from 717 to 31,500
μS/cm) is found in a 10 km wide zone bordering the St.
Lawrence River close to the Chambly-Fortierville syncline.32,33
Groundwater is clearly brackish in a 2,200 km2
area to the north
of the Montérégie-Est basin in the fractured Queenston Group,
where salinity reaches 5 g/L locally.34
The source of salinity
derives from exchanges of freshwater with pore seawater trapped
into the thick Champlain Sea silty-clays that confine partially or
totally the aquifer fractured bedrock aquifer.35
Sampling and analysis. Water samples were collected
throughout the St. Lawrence Lowlands (Figure 1). A total of 130
wells were visited on private properties (n = 81), municipalities
(n = 34), as well as at groundwater observation stations (n = 15).
Table 1. Average, Median, Range of Methane, Ethane and Propane Concentrations (in mg/L), and Methane δ13
C Signatures (in
‰ vs. VPDB)a
methane (mg/L) ethane (mg/L) propane (mg/L) methane (‰)
average 3.8 ± 8.8 0.010 ± 0.018 0.003 ± 0.002 −62.3
Nb
117 42 10 73
median 0.1 0.003 0.002 −60.0
maximum 45.9 ± 0.8 0.086 ± 0.003 0.006 ± 0.004 −24.8
minimum <0.0006 <0.0004 <0.0010 −105.1
limit of detectionc
0.0006 0.0004 0.0010 N/A
limit of quantificationc
0.0020 0.0010 0.0030 N/A
a
The NBS19 and LSVEC international standards were used to anchor δ13
C signatures to the VPDB scale. The experimental detection/quantification
limits are also provided. b
Number of samples measured (above the limit of detection). c
3 standard deviations (3 σ). d
10 standard deviations (10 σ).
Environmental Science & Technology Article
DOI: 10.1021/acs.est.5b00443
Environ. Sci. Technol. 2015, 49, 4765−4771
4767
4. All the wells were open borehole bedrock and their depths
ranged from 6 to 120 m. A volume equivalent to three times the
water volume in the wellbore was purged for observation wells
that are not used for human consumption. Water was sampled
once the physicochemical parameters of the water (pH,
conductivity and temperature) had stabilized. Water was
sampled at the wellhead in municipal wells and before any
water treatment or filtration unit in domestic wells. Sampling and
analysis were performed following established methods, as
described in the Supporting Information section.
■ RESULTS AND DISCUSSION
Hydrocarbon Gas Concentrations. Dissolved methane
was detected in 117 of the 130 wells. The average methane
concentration was 3.8 ± 8.8 mg/L, the median was 0.1 mg/L, and
the range was <0.0006 to 45.9 mg/L (Table 1; the complete data
set is available in the Supporting Information section, Table S1).
In 84 samples with detectable methane levels (65% of all
samples), the measured concentration was below 1 mg/L
(Figure 2). Ethane and propane concentrations were detected in
a limited number of wells with maximum concentrations of 0.086
mg/L for ethane (42 wells) and 0.006 mg/L for propane (10
wells) (Table 1).
In May 2013, the Quebec Ministry of Environment approved
new regulations for the protection of groundwater that set an
alert level for methane concentration in groundwater used for
drinking purposes to 7 mg/L.36
Above this level, well owners
have to take measures to avoid the accumulation of gaseous
methane in water pipes. As an example, the U.S. Department of
Energy considers methane concentrations between 10 and 28
mg/L as non problematic; direct actions are required only at 28
mg/L.37
The 7 mg/L concentration level was exceeded for 18
wells where it averaged 21.8 ± 11.0 mg/L. At four of these wells,
methane concentrations were higher than 28 mg/L, which
corresponds to the solubility of methane in water at 1 atm and 15
°C. The maximum measured concentration was 45.9 ± 0.8 mg/
L. These high concentrations indicate that methane sponta-
neously degasses and can be problematic if it accumulates in
closed, unventilated spaces such as the well casing. These results
are comparable to methane concentrations in groundwater
measured by Kappel et al. (2012), McPhillips et al. (2014) as well
as McIntosh et al. (2014) in drinking water wells from New York
State (United States) and southwestern Ontario (Canada).15−17
The higher concentrations of methane were found along the
Yamaska, Logan and d’Aston faults on the south shore opposite
to Trois-Rivières, around the city of Chambly and northeast of
Montreal (Figure 1). Dissolved methane concentrations in these
areas were approximately 10 times higher than the average
groundwater−methane concentrations in the St. Lawrence
Lowlands. The Logan line, which corresponds to the boundary
between the St. Lawrence Platform Ordovician terrains and the
Cambrian-Ordovician metasediments of the Appalachians,
marks the transition between high and low dissolved methane
concentrations. The majority of wells with high methane
concentrations fall within the Lorraine Group Shales (Figure
1), which is also a hydrocarbon source rock. The CH4 median
concentration measured in wells tapping into the Lorraine Group
is 1.92 mg/L, against 0.34, 0.003, and 0.075 mg/L for the Sainte-
Rosalie, Utica Shale and Queenston Groups, respectively.
Noteworthy, methane concentrations are highest in wells located
closest to major fault accidents (Figure 3), suggesting facilitated
migration of gases through natural faults in the bedrock. This is
especially clear for wells taping the bedrock aquifer in the
Lorraine formation.
Methane Sources. The δ13
C signature of methane was
determined for the 73 samples with methane concentrations
higher than 0.03 mg/L allowing accurate δ13
C measurement,
with isotopic ratios ranging from −105.1 to −24.8‰. Methane
δ13
CC signatures below −64‰ are usually indicative of a
biogenic (bacteriogenic) source if minimal methane oxidation
has occurred,24,38
although less depleted δ13
C values are also
possible depending on the methane precursor.39,40
For instance,
methane produced in freshwater sediments, where precursors
can be more enriched than in groundwater, showδ13
Csignatures
ranging from −65 to −50‰.40
In contrast, methane δ13
C
signatures ranging between −50 and −20‰ suggest a
thermogenic source,24,39
although slightly more negative values
have also been observed.38
In this work, δ13
C values lower than −64‰ were used to
indicate a predominantly biogenic origin and δ13
C signatures
higher than −50‰ a predominantly thermogenic origin. Out of
the 73 samples with CH4 concentrations greater than 0.03 mg/L,
31 had δ13
C signatures more depleted than −64‰, while 19
Figure 2. Distribution of methane concentrations from 0 to 50 mg/L
and from 7 to 50 mg/L (insert) for samples with detectable CH4
concentrations.
Figure 3. Relationship between methane concentrations and distance of
the groundwater well from the major bedrock faults.
Environmental Science & Technology Article
DOI: 10.1021/acs.est.5b00443
Environ. Sci. Technol. 2015, 49, 4765−4771
4768
5. others had δ13
C signatures less depleted than −50‰ (Figure 4).
The majority of samples with less depleted δ13
C signatures were
characterized by low methane concentrations (<1 mg/L). Out of
these 19 samples with a δ13
C signature > −50‰, three had
methane concentrations >7 mg/L, with one sample having a
concentration of 26.4 ± 1.9 mg/L, close to the solubility of
methane at 1 atm and 15 °C (28 mg/L). These three well were
located close to the Logan line (Figure 1). The five samples with
a δ13
C signature < −64‰ and a concentration >7 mg/L were
also close to the Logan line and associated with the Lorraine
group. The vast majority of samples with methane concen-
trations >7 mg/L showed isotopic signatures between −64 and
−50‰ (Figure 4).
Thermogenic gases normally contain ethane, propane and
other higher hydrocarbon gases at varying concentrations.
Biogenic gases contain mostly methane and possibly very low
levels of ethane.43
The concentration ratios between methane
and the sum of these higher hydrocarbon gases (C1/(C2+C3)),
also referred to as gas wetness, can thus be used as a source
indicator. Ratios greater than 1000 indicate a biogenic source
while ratios lower than 100 indicate a thermogenic
source38,39,41−43
Figure 5 shows that the majority of the samples
plot outside the thermogenic gas window. The only sample
falling within the thermogenic window (δ13
C > −50‰) had a
low methane concentration (<1 mg/L). Thus, none of the
samples with high methane concentrations (>7 mg/L) and less
depleted in 13
C (δ13
C > −50‰) appears to be of thermogenic
origin.
There were nine cases where the gas wetness ratio suggested a
nonthermogenic source whereas the δ13
C signature of methane
was typical of a thermogenic one. Three processes can alter the
gas wetness and/or the δ13
C signature of methane: (1) mixing of
different sources; (2) oxidation of methane; and (3) migration or
diffusion of gas.38−43
Mixing of biogenic and thermogenic gases
can be represented with different mixing curves that vary
according to the gas wetness ratio and the δ13
C signature of the
end-members. Two such theoretical mixing curves are
represented in Figure 5 with different thermogenic and biogenic
end-members.
Oxidation of methane results in an enrichment in 13
C of the
residual methane. It also results in a decreasing C1/(C2+C3)
ratio39−42,44
since the oxidation kinetics of 12
C−CH4 are higher
than those of 13
C−CH4, and the oxidation kinetics of methane
are higher than those of ethane and propane.39
On the other
hand, the migration of gas mainly results in a higher C1/
(C2+C3) ratio since the diffusion rate through the bedrock is
higher for the lighter methane compared to heavier ethane and
propane. In most studies published so far, migration was found to
only slightly affect the δ13
C signature of methane compared to
the C1/(C2+C3) ratio.41,42
Samples that plot outside of the biogenic or thermogenic
window could have been affected by one of more of these
processes (i.e., mixing, oxidation and migration). For example,
three wells showed high concentrations of methane with a δ13
C >
−50‰ (Figure 2) although their C1/(C2+C3) ratio was >100
(Figure 5), suggesting an alteration of the original gas
composition. The available data is however insufficient to draw
definitive conclusions on the processes taking place for each
sample. Methane in samples falling within the thermogenic and
biogenic windows could also have been affected by these
processes to some extent. The determination of the δ13
C
signature of ethane and/or the δ2
H signature of methane would
be necessary to determine the exact processes that affected the
gas wetness or δ13
C signature of methane in these samples.
Despite the fact that most of the gas measured in the samples
was biogenic in origin, thermogenic sources also contributed to
some extent to the groundwater pool of light hydrocarbons in the
area. This thermogenic gas could be mostly associated with the
Lorraine silty shale outcrops. Here, biogenic gases formed at
shallower depths in anoxic environments, likely in semiconfined
or confined fractured aquifers where methanogens can
proliferate,45,46
possibly mix with thermogenic gases formed in
the deeper horizons of the Lorraine Shale or even the Utica Shale.
Although speculative at this point, major faults could be a
preferential path for this deeper thermogenic component to
migrate upward7
and mix with biogenic shallower methane
(Figure 2).
Figure 4. Relationship between methane concentrations and δ13
C
signatures by geological formations. Gray areas depict the delimitations
between biogenic (left gray area) and thermogenic (right gray area)
methane.
Figure 5. Bernard plot of methane/(ethane+propane) ratio versus δ13
C
of methane for the samples analyzed in this study. Gray areas depict
approximate delimitations for biogenic and thermogenic methane.
Mixing curves A and B are theoretical mixing curves modified from
Whiticar.39
The arrows indicate the general direction of the methane/
(ethane + propane) ratios and the δ13
C of methane upon oxidation or
migration. Modified from refs 48 and49
Environmental Science & Technology Article
DOI: 10.1021/acs.est.5b00443
Environ. Sci. Technol. 2015, 49, 4765−4771
4769
6. The hypothesis of an increased methane concentration in
confined aquifers is supported by the relation found between the
measured concentration of methane and well water chemistry
(Figure 6). Freshwater recently recharged in nonconfined
aquifers having a Ca,Mg(HCO3) and Na-SO4-type chemistry
are extremely depleted in methane (CH4 median values of 0.06
and 0.02 mg/L, respectively). Methane concentration increases
rapidly in more evolved groundwater affected by ion Ca−Na
exchange (Na-HCO3) and exchange with saline waters (Na−Cl-
type) in confined aquifers (CH4 median values of 0.34 to 7.6 mg/
L, respectively). This net increases of methane concentration is
probably related to the change from oxygenated shallow
environments to deeper and anoxic ones where methanogens
can proliferate and methane oxidation and loss is strongly
limited.45−47
Methane is thus a natural component of groundwater in the St.
Lawrence Lowlands and can be present at concentrations that
exceed solubility under conditions encountered in the wells.
Depleted δ13
C measurements suggest that methane found in
these shallow fractured bedrock aquifers is mostly produced by
methanogenic bacteria, although the gas composition may have
been altered by processes such as migration and/or mixing with
deeper-seated thermogenic sources and bacterial oxidation.
Additional analyses such as the δ13
C signature of ethane and
propane as well as δ2
H of methane are required to pinpoint the
exact sources of this gas and the processes that may have altered
it. The relationship between methane concentrations and
groundwater chemistry suggests that methane levels are
controlled to a large extent by the composition of the bedrock,
local redox conditions, as well as water flow patterns and
confinement (residence time). Natural faults in the bedrock are
likely to be a preferential migration pathway for methane,
especially in the Lorraine formation, as shown by the inverse
trend between methane concentrations and distance from the
faults. This is an important finding as a faulty fracked well located
in the vicinity of natural faults could lead to much greater
contamination of the groundwater compared to wells operated in
compact intermediate bedrock. Energy companies, which target
the area where the bedrock of the Lorraine group is located,
should thus respect a safe distance from major natural faults in
the intermediate and superficial bedrock when locating fracked
wells. In view of the current study, this is a reasonable precaution
to minimize the risk of contaminating the surrounding
groundwater in case a fracked well becomes faulty.
■ ASSOCIATED CONTENT
*S Supporting Information
Sampling and analysis of methane, ethane and propane dissolved
in groundwater, plus a table listing all the data acquired in this
work. This material is available free of charge via the Internet at
http://pubs.acs.org.
■ AUTHOR INFORMATION
Corresponding Author
*Phone: 514-848-2424 ×3337; fax: 514-848-2868; e-mail: yves.
gelinas@alcor.concordia.ca.
Author Contributions
Sampling was carried out by A.M., D.B., and S.R., while the
concentration and isotopic analyses were done by AM.
Calibration of the reference gases for isotopic analysis was
done by A.M. and J.F.H. A.M. and Y.G. wrote the first draft of the
manuscript with inputs from D.P., J.F.H., M.L., and R.L.. All
authors have given approval to the final version of the
manuscript.
Notes
The authors declare no competing financial interest.
■ ACKNOWLEDGMENTS
We thank the Strategic Environmental Assessment Committee
on Shale Gas and the Quebec Government for entrusting us this
project (Project CÉES no. E3-9 and FQRNT “Initiatives
Stratégiques d’Innovation” Project no. 171083). This research
was funded by grants from the FRQ-NT, NSERC, and CFI.
■ REFERENCES
(1) Kerr, R. A. Natural Gas From Shale Bursts Onto the Scene. Science
2010, 328, 1624−1626.
(2) United States Energy Information Administration. Annual Energy
Outlook 2012 with Projections to 2035; 2012.
(3) Wang, Q.; Chen, X.; Jha, A. N.; Rogers, H. Natural gas from shale
formation − The evolution, evidences and challenges of shale gas
revolution in United States. Renewable Sustainable Energy Rev. 2014, 30,
1−28.
(4) Kargbo, D. M.; Wilhelm, R. G.; Campbell, D. J. Natural gas plays in
the Marcellus Shale: Challenges and potential opportunities. Environ.
Sci. Technol. 2010, 44, 5679−5684.
(5) Vidic, R. D.; Brantley, S. L.; Vandenbossche, J. M.; Yoxtheimer, D.;
Abad, J. D. Impact of shale gas development on regional water quality.
Science 2013, 340, 1−9.
(6) Warner, N. R.; Jackson, R. B.; Darrah, T. H.; Osborn, S. G.; Down,
A.; Zhao, K.; White, A.; Vengosh, A. Geochemical evidence for possible
natural migration of Marcellus Formation brine to shallow aquifers in
Pennsylvania. Proc. Natl. Acad. Sci. U. S. A. 2012, 109, 11961−11966.
(7) Darrah, T. H.; Vengosha, A.; Jackson, R. B.; Warner, N. R.; Poreda,
R. J. Noble gases identify the mechanisms of fugitive gas contamination
in drinking-water wells overlying the Marcellus and Barnett Shales. Proc.
Natl. Acad. Sci. U. S. A. 2014, 111, 14076−14081.
(8) Osborn, S. G.; Vengosh, A.; Warner, N. R.; Jackson, R. B. Methane
contamination of drinking water accompanying gas-well drilling and
hydraulic fracturing. Proc. Natl. Acad. Sci. U. S. A. 2011, 108, 8172−8176.
(9) Molofsky, L. J.; Connor, J. A.; Farhat, S. K.; Wylie, A. S., Jr Methane
in Pennsylvania water wells unrelated to Marcellus shale fracturing. Oil
Gas J. 2011, December 5, 54−67.
(10) Jackson, R. E.; Gorody, A. W.; Mayer, B.; Roy, J. W.; Ryan, M. C.;
Van Stempvoort, D. R. Groundwater protection and unconventional gas
extraction: The critical need for field-based hydrogeological research.
Ground Water 2013, 51, 488−510.
Figure 6. Methane concentrations measured in groundwater of different
chemical types.
Environmental Science & Technology Article
DOI: 10.1021/acs.est.5b00443
Environ. Sci. Technol. 2015, 49, 4765−4771
4770
7. (11) Stokstad, E. Will fracking put too much fizz in your water? Science
2014, 344, 1468−1471.
(12) Jackson, R. B.; Vengosh, A.; Darrah, T. H.; Warner, N. R.; Down,
A.; Poreda, R. J.; Osborn, S. G.; Zhao, K.; Karr, J. D. Increased stray gas
abundance in a subset of drinking water wells near Marcellus shale gas
extraction. Proc. Natl. Acad. Sci. U. S. A. 2013, 110, 11250−11255.
(13) Li, H.; Carlson, K. H. Distribution and origin of groundwater
methane in the Wattenberg Oil and Gas Field of Northern Colorado.
Environ. Sci. Technol. 2014, 48, 1484−1491.
(14) Wyoming Oil and Gas Conservation Commission (WOGCC).
Wyoming Oil and Gas Regulations, Chapter 3. Operational and Drilling
Rules, 2014.
(15) Kappel, W. M.; Nystrom, E. A. Dissolved Methane in New York
Groundwater, U.S. Geological Survey Open File Rep. 2012-1162, 2012;
pp 1−6.
(16) McPhillips, L. E.; Creamer, A. E.; Rahmb, B. G.; Walter, M. T.
Assessing dissolved methane patterns in central New York groundwater.
J. Hydrol.: Reg. Stud. 2014, 1, 57−73.
(17) McIntosh, J. C.; Grasby, S. E.; Hamilton, S. M.; Osborn, S. G.
Origin, distribution and hydrogeochemical controls on methane
occurrences in shallow aquifers, southwestern Ontario, Canada. Appl.
Geochem. 2014, DOI: 10.1016/j.apgeochem.2014.08.001.
(18) Boyer, E. W.; Swistock, B. R.; Clark, J.; Madden, M.; Rizzo, D. E.
The Impact of Marcellus Gas Drilling on Rural Drinking Water Supplies;
The Center for Rural Pennsylvania, 2011; p 29.
(19) Myers, T. Potential contaminant pathways from hydraulically
fractured shale to aquifers. Ground Water 2012, 50, 872−882.
(20) Gorody, A. Factors affecting the variability of stray gas
concentration and composition in groundwater. Environ. Geosci. 2012,
19, 17−31.
(21) Chafin, D. T.; Swanson, D. M.; Grey, D. W. Methane-Isotope Data
for Ground Water and Soil Gas in the Animas River Valley, Colorado and
New Mexico, 1990−91. , U.S. Geological Survey Water Resouce
Invesigations. Report 93−4007, 1996.
(22) Sloto, R. A. Baseline Groundwater Quality from 20 Domestic Wells in
Sullivan County, Pennsylvania, 2012 Scientific Investigations Report
2013 − 5085. 2013.
(23) Barker, J. F.; Fritz, P. Carbon isotope fractionation during
microbial methane oxidation. Nature 1981, 293, 289−291.
(24) Stolper, D. A.; Lawson, M.; Davis, C. L.; Ferreira, A. A.; Santos
Neto, E. V.; Ellis, G. S.; Lewan, M. D.; Martini, A. M.; Tang, Y.; Schoell,
M.; Sessions, A. L.; Eiler, J. M. Gas formation. Formation temperatures
of thermogenic and biogenic methane. Science 2014, 344, 1500−1503.
(25) Rivard, C.; Lavoie, D.; Lefebvre, R.; Séjourné, S.; Lamontagne, C.;
Duchesne, M. An overview of Canadian shale gas production and
environmental concerns. Int. J. Coal Geol. 2014, 121, 64−76.
(26) Commité de l’évaluation environnementale stratégique sur le gaz
de schiste. Plan de Réalisation de l’Evaluation Environnementale
Stratégique sur le gaz de Schiste; 2012.
(27) Pinti, D. L.; Gélinas, Y.; Larocque, M.; Barnetche, D.; Retailleau,
S.; Moritz, A.; Hélie, J. F.; Lefebvre, R. Concentrations, Sources Et
Mécanismes De Migration Préférentielle Des Gaz D’Origine Naturelle
(Méthane, Hélium, Radon) Dans Les Eaux Souterraines Des Basses- Terres
Du Saint-Laurent, 2013; p 94.
(28) Lavoie, D.; Rivard, C.; Lefebvre, R.; Séjourné, S.; Thériault, R.;
Duchesne, M. J.; Ahad, J. M. E.; Wang, B.; Benoit, N.; Lamontagne, C.
The Utica Shale and gas play in southern Quebec: Geological and
hydrogeological syntheses and methodological approaches to ground-
water risk evaluation. Int. J. Coal Geol. 2013.
(29) Lavoie, D.; Thériault, R. Upper Ordovician shale gas and oil in
Quebec: Sedimentological, geochemical and thermal frameworks.
Search Discovery 2014, 9.
(30) Lamothe, M. A new framework for the pleistocene stratigraphy of
the Central St. Lawrence Lowland, Southern Québec. Géographie Phys.
Quat. 1989, 43, 119.
(31) Pinti, D. L.; Retailleau, S.; Barnetche, D.; Moreira, F.; Moritz, A.
M.; Larocque, M.; Gélinas, Y.; Lefebvre, R.; Hélie, J. F.; Valadez, A.
222Rn activity in groundwater of the St. Lawrence Lowlands, Quebec,
eastern Canada: Relation with local geology and health hazard. J.
Environ. Radioact. 2014, 136, 206−217.
(32) Larocque, M.; Gagné, S.; Tremblay, L.; Meyzonnat, G. Projet de
connaissance des eaux souterraines du bassin versant de la rivière Bécancour
et de la MRC de Bécancour - Rapport scientifique, Rapport déposé au
ministère du Développement durable, de l’Environnement, de la Faune
et des Parcs, 2013; p 213,
(33) Larocque, M.; Meyzonnat, G.; Gagné, S. Rapport d’étape phase I:
Projet de connaissance des eaux souterraines de la zone Nicolet et de la partie
basse de la zone Saint-François, Rapport déposé au ministère du
Développement durable, de l’Environnement, de la Faune et des Parcs,
m2013; p 106.
(34) Carrier, M. A.; Lefebvre, R.; Rivard, C.; Parent, M.; Ballard, J. M.;
Benoit, N.; Vigneault, H.; Beaudry, C.; Malet, X.; Laurencelle, M.
Portrait des ressources en eau souterraine en Montérégie Est, Québec,
Canada. Projet réalisé conjointement par l’INRS, la CGC, l’OBV Yamaska
et l’IRDA dans le cadre du Programme d’acquisition de connaissances sur les
eaux souterraines, rapport final I, 2013.
(35) Cloutier, V.; Lefebvre, R.; Savard, M. M.; Therrien, R.
Desalination of a sedimentary rock aquifer system invaded by
Pleistocene Champlain Sea water and processes controlling ground-
water geochemistry. Environ. Earth Sci. 2009, 59, 977−994.
(36) MDDEFP. Règlement sur le prélèvement des eaux et leur
protection. Gaz. Off. du Quebec 2013, 145, 2184−2215.
(37) Technical Measures for the Investigation and Mitigation of Fugitive
Methane Hazards in Areas of Coal Mining; Department of Energy. U.S.
Department of the Interior. Office of Surface Mining Reclamation and
Enforcement2001; p 129.
(38) Schoell, M. The hydrogen and carbon isotopic composition of
methane from natural gases of various origins. Geochim. Cosmochim. Acta
1980, 44, 649−661.
(39) Whiticar, M. J. Carbon and hydrogen isotope systematics of
bacterial formation and oxidation of methane. Chem. Geol. 1999, 161,
291−314.
(40) Whiticar, M.; Faber, E.; Schoell, M. Biogenic methane formation
in marine and freshwater environments: CO2 reduction vs. acetate
fermentationIsotope evidence. Geochim. Cosmochim. Acta 1986, 50,
693−709.
(41) Schoell, M. Genetic characterization of natural gases. Am. Assoc.
Pet. Geol. Bull. 1983, 67, 2225−2238.
(42) Stahl, W. J. Carbon and nitrogen isotopes in hydrocarbon research
and exploration. Chem. Geol. 1977, 20, 121−149.
(43) Whiticar, M. J. Stable isotope geochemistry of coals, humic
kerogens and related natural gases. Int. J. Coal Geol. 1996, 32, 191−215.
(44) Whiticar, M. J.; Faber, E. Methane oxidation in sediments and
water column environmentsIsotope evidence. Org. Geochem. 1986,
10, 759−768.
(45) Coleman, D. D.; Liu, C.; Riley, K. M. Microbial methane in the
shallow Paleozoic sediments and glacial deposits of the Illinois, USA.
Chem. Geol. 1988, 71, 23−40.
(46) Aravena, R.; Wassenaar, L. I. Dissolved organic carbon and
methane in a regional confined aquifer, southern Ontario, Canada:
Carbon isotope evidence for associated subsurface sources. Appl.
Geochem. 1993, 8, 483−493.
(47) Aravena, R.; Wassenaar, L. I.; Plummer, L. N. Estimating 14
C
groundwater ages in a methanogenic aquifer. Water Resour. Res. 1995,
31, 2307−2317.
(48) Faber, E.; Stahl, W. Geochemical Surface Exploration for
Hydrocarbons in North Sea. Am. Assoc. Pet. Geol. Bull. 1984, 68, 363−
386.
(49) Bernard, B. B.; Brooks, J. M.; Sackett, W. M. Natural gas seepage
in the Gulf of Mexico. Earth Planet. Sci. Lett. 1976, 31, 48−54.
Environmental Science & Technology Article
DOI: 10.1021/acs.est.5b00443
Environ. Sci. Technol. 2015, 49, 4765−4771
4771