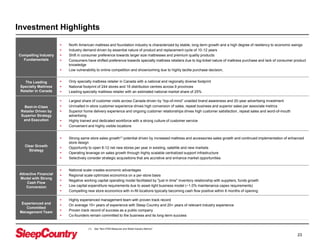
SlideShare a Scribd company logo
1 of 25
Download to read offline
Management Presentation
A Confidential Presentation
Disclaimers
2
Forward-looking Information
This presentation, including, in particular, under the headings entitled “Stable, long-term growth”, “Key drivers of SSS growth”, “Roadmap to growth – Increase accessories sales”, “Roadmap to growth
– Add stores in existing, satellite and new markets”, “Attractive financial model results in strong cash flow conversion”, “National scale has economic benefits”, “Regional store density adds profitability
and barrier to entry”, Select Financial Highlights and Growth Targets” and “Investment Highlights”, contains forward-looking information and forward-looking statements which reflect the current view of
management with respect to the Company’s objectives, plans, goals, strategies, outlook, results of operations, financial and operating performance, prospects and opportunities. Wherever used, the
words “may”, “will”, “anticipate”, “intend”, “estimate”, “expect”, “plan”, “believe” and similar expressions identify forward-looking information and forward-looking statements. Forward-looking information
and forward-looking statements should not be reads as guarantees of future events, performance or results, and will not necessarily be accurate indications of whether, or the times at which, such
events, performance or results will be achieved. All of the information in this presentation containing forward-looking information or forward-looking statements is qualified by these cautionary
statements.
Forward-looking information and forward-looking statements are based on information available to management at the time they are made, underlying estimates, opinions and assumptions made by
management and management’s current good faith belief with respect to future strategies, prospects, events, performance and results, and are subject to inherent risks and uncertainties surrounding
future expectations generally. Such risks and uncertainties include, but are not limited to, those described in the Company’s 2016 annual information form (the “AIF”) filed on February 28, 2017. A copy
of the AIF can be accessed under the Company’s profile on the System for Electronic Document Analysis and Retrieval (SEDAR) at www.sedar.com. Additional risks and uncertainties not presently
known to the Company or that the Company currently believes to be less significant may also adversely affect the Company.
The Company cautions that the list of risk factors and uncertainties described in the AIF is not exhaustive and that should certain risks or uncertainties materialize, or should underlying assumptions
prove incorrect, actual strategies, prospects, events, performance and results may vary significantly from those expected. There can be no assurance that the actual strategies, prospects, results,
performance, events or activities anticipated by the Company will be realized or, even if substantially realized, that they will have the expected consequences to, or effects on, the Company. Readers
are urged to consider the risks, uncertainties and assumptions carefully in evaluating the forward-looking information and forward-looking statements and are cautioned not to place undue reliance on
such information and statements. The Company does not undertake to update any such forward-looking information or forward-looking statements, whether as a result of new information, future
events or otherwise, except as required by applicable laws.
The Company prepares its financial statements in accordance with International Financial Reporting Standards ("IFRS"). In order to provide additional insight into the business, to provide investors with
supplemental measures of its operating performance and to highlight trends in its business that may not otherwise be apparent when relying solely on IFRS financial measures, the Company has also
provided in this presentation certain non-IFRS measures, including "Same Store Sales Growth" or "SSSG", "EBITDA", "Operating EBITDA", "Operating EBITDA Margin" and "Conversion", each as
defined under the heading entitled "Description of Non-IFRS Measures and Retail Industry Metrics" at the end of this presentation. These measures are provided as additional information to
complement IFRS measures by providing further understanding of the Company's results of operations from management's perspective. Management also uses non-IFRS measures in order to
facilitate operating performance comparisons from period to period, to prepare annual operating budgets and forecasts and to determine components of management compensation. The Company
also believes that securities analysts, investors and other interested parties frequently use non-IFRS measures in the evaluation of issuers.
Readers are cautioned that these non-IFRS measures are not recognized under IFRS and do not have a standardized meaning prescribed by IFRS. They are therefore unlikely to be comparable to
similarly titled measures presented by other publicly traded companies. Accordingly, they should not be considered in isolation nor as a substitute for analysis of the Company's financial information
reported under IFRS. For further details concerning how the Company calculates these non-IFRS measures and for reconciliations to the most comparable IFRS measures, please see the Company's
most recent management's discussion and analysis of financial condition and results of operation filed with Canadian securities regulatory authorities and available on SEDAR at www.sedar.com.
Non-IFRS Measures and Retail Industry Metrics
Sleep Country
3
David Friesema Robert Masson Stewart Schaefer
Chief Executive Officer
Chief Financial Officer
& Corporate Secretary
Chief Business
Development Officer
Investment Highlights
4
The Leading Specialty Mattress Retailer in Canada
Best-in-Class Retailer Driven by Superior Strategy and Execution
Clear Growth Strategy
Attractive Financial Model with Strong Cash Flow Conversion
Compelling Industry Fundamentals
Experienced and Committed Management Team
Industry Fundamentals
Stable Growth – Canadian Market
5
(1) Source: Based on survey of the 10 largest mattress manufacturers in Canada.
 Unit demand in Canada has grown at only 1% CAGR over the past 13 years. AUSP has driven most of the growth.
 Necessity purchase not a fashion item; Recurring demand driven by 10-12 year replacement cycle, so even during an economic downturn sales are
typically deferred and not lost
 Consumer preferences evolving toward premium quality, larger mattresses given growing health awareness and preference for high-quality sleep
 Price increases due to inflation are typically passed through to consumers
Canada Mattress and Foundation Wholesale Sales (1)
INCREASE 8.0% 6.6% 4.0% -1.3% -11.3% 3.2% 3.3% 6.1% 6.0% 0.6% 4.9% 6.8%
INCREASE 6.1% 4.1% 4.8% 0.0% -12.9% 4.4% 4.2% 2.2% 2.2% 0.3% -2.5% 2.0% INCREASE 2.8% 2.4% -0.8% -1.3% 1.9% -1.2% -0.9% 3.9% 3.7% 0.3% 7.5% 4.7%
The Leading Specialty Mattress Retailer in Canada
6
 244 stores and 16 distribution centres across 9 provinces (1)
 Has opened 106 stores since the beginning of 2007
 Only specialty mattress retailer with a national and regionally diverse footprint
 Estimated national market share of approx. 25%
(1) Store count as of September 2, 2017.
BC
AB
SK
MB
ON
QC
NL
NB
PE
NS
40
30
6
7
99 953
Sleep Country's National Footprint (# of stores)
LTM (C$ millions)
Sales $553.6
Operating EBITDA $91.1
Best-in-Class Retailer Driven by Superior Strategy and Execution
7
“Best-in-Class” Retailer
Strong Brand Recognition
1
Unrivalled In-Store Customer
Experience
2
Highly Trained and Dedicated
Workforce with a Strong
Culture of Customer Service
4
Superior Home Delivery
Experience and Ongoing
Customer Relationships
3
Differentiated strategy has delivered strong results and momentum
8
Sleep Country Quarterly Sales Growth
(1)
(1) Source: Company report. See ‘‘Non-IFRS Measures and Retail Industry Metrics”.
1.3%
9.1%
11.1%
10.2%
10.5%
7.7%
13.4%
12.9%
11.7%
12.2%
7.7%
9.6%
11.9%
7.5%
5.5%
13.1%
14.7%
13.1%
12.6%
10.6%
17.7%
18.3%
17.1% 17.3%
12.5%
13.7%
15.8%
10.7%
0.0%
2.0%
4.0%
6.0%
8.0%
10.0%
12.0%
14.0%
16.0%
18.0%
20.0%
Q1 Q2 Q3 Q4 Q1 Q2 Q3 Q4 Q1 Q2 Q3 Q4 Q1 Q2
2014 2015 2016 2017
Same Store Sales Growth Total Sales Growth
9
Roadmap to Growth - SSS Growth
Increase Traffic
 Increased marketing investment
 Expand messaging
 Increase market share
Increase Conversion
of Shoppers to Buyers
 Continued focus on hiring the best people
 Additional training initiatives
Higher AUSP
 Continued shift to higher quality mattresses
 Larger sizes are increasing in popularity
Expand Accessory
Sales
 Expand and improve product lines
 Additional marketing messaging
 Enhanced training
 Launch of eCommerce channel
 More details on page 10
Enhanced Store
Design
 Contemporary design creates bright and welcoming atmosphere
 Greater emphasis on accessory displays
 More details on page 11
Roadmap to Growth – Expand Accessories Sales
10
 Bedframes
 Pillows
 Mattress pads
Key Accessories Sleep Country Accessories Revenue
(1)
(C$ millions)
 Sheets
 Duvets
 Headboards and
Footboards
Opportunity to capture market share in an estimated $830 million
highly fragmented yet addressable market in Canada
(1) Source: Company report. 2017 is LTM Q2 2017
15.5% CAGR
Launch of e-commerce with mattress in-a-box
and accessories.
Provide our customer with a
seamless experience across
both channels.
Drive new traffic by targeting
a different demographic. The creation of a new
revenue channel.
Continue to drive traffic to our
stores.
Introducing Bloom, our exclusive mattress in a box that ships
for free right to your door….
Throws
Throws
Online Accessories Expansion – Testing new accessory product categories online
before rolling them out to our stores.
Robes
Snap Beds
Roadmap to Growth – Enhanced Store Design
14
Results for the 54 stores renovated to date show an increase in revenues above our national SSSG
12
10
8
4
10
13
5
13
11
9
2008 2009 2010 2011 2012 2013 2014 2015 2016 YTD 2017
Store Growth
Roadmap to Growth – Add New Stores
15
Significant white space is available given our low store density
Target to open 8 to 12 new stores per year
 Modest net new store investment of approximately $400,000 comprising of capex and working capital investment
 Typically, new in-fill and satellite stores are cash flow positive within 6 and 12 months, respectively
Average
9.5
Store count as of September 2, 2017.
Attractive Financial Model – Recent Results
16
Sales momentum driving increasing EBITDA
Strong historical sales growth through new store openings and same store sales growth
Attractive Financial Model - Low Capital Expenditure Model
17
Maintenance capital expenditures have averaged 1.0% of revenue from 2008 to 2017
(1) Source: Company report.
Sleep Country Maintenance and Growth Capital Expenditures (% of sales) (1)
1.4%
0.8% 0.8% 1.0% 1.3% 1.2%
0.5% 0.8% 1.0% 0.9%
1.1%
0.7% 0.5%
0.9%
1.5% 1.9%
1.3%
2.4%
2.5%
4.7%
2.6%
1.5%
1.2%
1.9%
2.9%
3.1%
1.8%
3.2%
3.5%
5.6%
2008 2009 2010 2011 2012 2013 2014 2015 2016 Q2 2017
Maintenance Growth
Attractive Financial Model - Strong New Store Economics
18
Stores Generate Cash on Cash Payback < 1.5 Years
Representative New Store Investment
($ in thousands)
Average
Investment
Buildout and Equipping Cost Floor
Sample Inventory
$430
50
Less: Tenant Reimbursement
480
(80)
Cash Requirement, Net $400
New Store Results
($ in thousands) Year 1
Sales $1,200 - $1,500
Store 4-Wall Profitability(1)
% of Sales
$317 - $396
26.4%
Annual Cash on Cash Return 79% -100%
Store 4-wall profitability drives improving leverage over market-level costs as store penetration increases
(1) Based on 2016 gross profit margin after taking in to account 3rd party finance charges and mattress recycling cost.
Attractive Financial Model – Conservative Leverage
19
Capital structure provides financial flexibility to grow the business, while providing returns to shareholders
Revolving Credit Facility $119.0
Finance Leases $2.3
Total Long Term Debt $121.3
Net Debt / LTM Operating EBITDA 1.07x
Less: Cash on Hand ($23.7)
Net Debt $97.6
Outstanding Lease Liabilities
Net Debt / EBITDAR
$171.0
2.04x
As at June 30, 2017
(C$ millions)
Attractive Financial Model – Strong Free Cash Flow
20
Negative working capital model, quick ROI on new stores and low leverage provides flexibility for
investments and return to shareholders
As at June 30, 2017
(C$ millions)
Operating EBITDA(1) 91.1
CAPEX(1) 20.7
Interest(2) 3.6
Taxes(3) 20.0
Free Cash Flow available for dividends 46.8
Number of shares outstanding 37.65 million
Dividend - $0.165 per quarter 24.8
Payout Ratio 53.0%
(1) Based on last 12 months ended June 30, 2017.
(2) Pro-forma based on year to date June 30, 2017.
(3) Pro-forma based on 26.5% tax rate.
Select Financial Highlights(1)
21
(1) See “Non-IFRS Measures and Retail Industry Metrics”.
(2) Excludes SG&A expenses added back in the reconciliation of EBITDA to Operating EBITDA.
(C$ million unless otherwise stated) 2015 2016 Q2 2016 Q2 2107
Revenue $456.2 $523.8 $120.2 $133.0
Same Store Sales Growth 11.3% 10.0% 12.2% 7.5%
Net New Stores 13 11 5 5
Gross profit $126.8 $151.4 $33.7 $37.3
Gross Margin 27.8% 28.9% 28.0% 28.1%
SG&A(2) $57.7 $66.4 $15.8 $17.1
% of Sales 12.6% 12.7% 13.2% 12.9%
Operating EBITDA $69.1 $85.0 $17.9 $20.2
Operating EBITDA Margin 15.2% 16.2% 14.9% 15.2%
Adjusted Net Income $39.3 $51.1 $10.0 $11.9
Adjusted Earning per Share 1.05 1.36 0.27 0.32
Proven Management Team committed to growing the business and
shareholder value
22
Member
Years at
Sleep Country
Relevant
Experience
Biography
Dave Friesema
 Chief Executive Officer
20+ 20+  Held numerous senior positions at Sleep Country including Head of Sales, General
Manager and Chief Operating Officer
 Chairman of the Better Sleep Council Canada
 Helped establish and manage mattress retail organizations in the United States
Robert Masson
 Chief Financial Officer and
Corporate Secretary
5 20+  Chief Financial Officer of Second Cup from 2009 to 2013
 Prior to joining Sleep Country, Robert had extensive management experience with several
other public and private companies including, IBM Canada, Manchuwok, Ernst & Young,
Deloitte & Touche and Sappi
Stewart Schaefer
 President, Dormez-vous?
 Chief Business Development
Officer
13 20+  Founded Dormez-vous? in 1994; grew the business to five stores before being acquired by
Sleep Country in 2006
 In 1992, co-founded Heritage Classic Beds, a distributor of metal beds
 Commodity Broker in Chicago from 1986 to 1992, later returning to Montreal to work at
Dean Witter Reynolds and Refco Futures
Dave Howcroft
 Senior Vice President, Sales
20+ 20+  Created programs to consistently build, develop and motivate a first-class sales team
 Instrumental in developing and implementing various sales workshops, training programs
and sales processes
Sieg Will
 Senior Vice President, Operations
17 20+  Instrumental in development and implementation of standard operating policies and
procedures across organization
 Held senior positions with Canadian Tire and PepsiCo in the sales, operations and account
management areas
Eric Solomon
 Senior Vice President,
Merchandising and Marketing
20+ 20+  Instrumental in growing the business by increasing "top-of-mind" brand awareness
 Provides oversight to the marketing department
Stephen Gunn
 Founder & Executive Co-Chair
20+ 20+  Co-founded Sleep Country in 1994
 Co-founded and was President of Kenrick Capital, a private equity firm
 Management Consultant at McKinsey and Company from 1981 to 1987
 Serves on the Board of Directors of Dollarama, Golfsmith International, Cara and
Mastermind Toys
Christine Magee
 Founder & Executive Co-Chair
20+ 20+  Co-founded Sleep Country in 1994
 Senior Manager of Corporate and Commercial Lending with National Bank from 1985 to
1994
 Serves on the Board of Directors of Sirius XM Canada, Trillium Health Partners and the
Advisory Board of the Ivey School of Business
Investment Highlights
23
Compelling Industry
Fundamentals
 North American mattress and foundation industry is characterized by stable, long-term growth and a high degree of resiliency to economic swings
 Industry demand driven by essential nature of product and replacement cycle of 10-12 years
 Shift in consumer preference towards larger size mattresses and premium quality products
 Consumers have shifted preference towards specialty mattress retailers due to big-ticket nature of mattress purchase and lack of consumer product
knowledge
 Low vulnerability to online competition and showrooming due to highly tactile purchase decision,
The Leading
Specialty Mattress
Retailer in Canada
 Only specialty mattress retailer in Canada with a national and regionally diverse footprint
 National footprint of 244 stores and 16 distribution centres across 9 provinces
 Leading specialty mattress retailer with an estimated national market share of 25%
Best-in-Class
Retailer Driven by
Superior Strategy
and Execution
 Largest share of customer visits across Canada driven by “top-of-mind” unaided brand awareness and 20-year advertising investment
 Unrivalled in-store customer experience drives high conversion of sales, repeat business and superior sales per associate metrics
 Superior home delivery experience and ongoing customer relationships drives high customer satisfaction, repeat sales and word-of-mouth
advertising
 Highly trained and dedicated workforce with a strong culture of customer service
 Convenient and highly visible locations
Clear Growth
Strategy
 Strong same store sales growth(1) potential driven by increased mattress and accessories sales growth and continued implementation of enhanced
store design
 Opportunity to open 8-12 net new stores per year in existing, satellite and new markets
 Operating leverage on sales growth through highly scalable centralized support infrastructure
 Selectively consider strategic acquisitions that are accretive and enhance market opportunities
Attractive Financial
Model with Strong
Cash Flow
Conversion
 National scale creates economic advantages
 Regional scale optimizes economics on a per-store basis
 Negative working capital operating model facilitated by "just in time" inventory relationship with suppliers, funds growth
 Low capital expenditure requirements due to asset-light business model (~1.0% maintenance capex requirements)
 Compelling new store economics with in-fill locations typically becoming cash flow positive within 6 months of opening
Experienced and
Committed
Management Team
 Highly experienced management team with proven track record
 On average 15+ years of experience with Sleep Country and 20+ years of relevant industry experience
 Proven track record of success as a public company
 Co-founders remain committed to the business and its long-term success
(1) See “Non-IFRS Measures and Retail Industry Metrics”.
Description of Non-IFRS Measures and Retail Industry Metrics
24
This presentation makes reference to certain non-IFRS measures including:
“AUSP” is defined as the average unit selling price of a mattress and foundation set.
“EBITDA” is defined as net earnings (loss) from continuing operations before: (i) net interest expense and other financing charges; (ii) income taxes; (iii)
depreciation of property, plant and equipment; and (iv) amortization of other assets.
“Conversion” is defined as the number of customers who entered a store and made a purchase divided by the total number of customers who entered the store
(expressed as a percentage).
“Operating EBITDA” is defined as EBITDA adjusted for: (i) reduction in management bonuses; (ii) reduction in management compensation; (iii) certain non-
recurring items (shareholder reorganization, professional fees and customer deposit breakages and other provision); and (iv) share based compensation.
“Same Store Sales Growth” or “SSSG” is a retail industry metric used to compare sales derived from the established stores of certain period over the same
period in prior year. SSSG helps to explain what portion of sales growth can be attributed to growth in established stores and what portion can be attributed to the
opening of the new stores. Sleep Country calculates SSSG as the percentage increase or decrease in sales of stores opened for at least 12 complete months
relative to the same period in the prior year.
These measures are not recognized measures under IFRS and do not have a standardized meaning prescribed by IFRS. They are therefore unlikely to be
comparable to similarly titled measures presented by other publicly traded companies. Accordingly, they should not be considered in isolation nor as a substitute
for analysis of the Company’s financial information reported under IFRS. For further details concerning how the Company calculates these non-IFRS measures
and for reconciliations to the most comparable IFRS measures, please see the Company's most recent management's discussion and analysis of financial
condition and results of operation filed with Canadian securities regulatory authorities and available on SEDAR at www.sedar.com.
Sleep country   draft roadshow presentation

More Related Content

What's hot

Strategic Portfolio Management PowerPoint Presentation Slides
Strategic Portfolio Management PowerPoint Presentation SlidesStrategic Portfolio Management PowerPoint Presentation Slides
Strategic Portfolio Management PowerPoint Presentation SlidesSlideTeam
 
A Financial Review: Pharmaceuticals Industry
A Financial Review: Pharmaceuticals IndustryA Financial Review: Pharmaceuticals Industry
A Financial Review: Pharmaceuticals IndustryRoby Camagong
 
_ C@p_T3st
_ C@p_T3st_ C@p_T3st
_ C@p_T3stflipdemo
 
Conquest Quarterly Performance Report 4Q15
Conquest Quarterly Performance Report 4Q15Conquest Quarterly Performance Report 4Q15
Conquest Quarterly Performance Report 4Q15RC_Stewart
 
Sfs ir handout June 2018 v1
Sfs ir handout June 2018 v1Sfs ir handout June 2018 v1
Sfs ir handout June 2018 v1SmartFinalIR
 
SFS IR Handout May 2018 v6
SFS IR Handout May 2018 v6SFS IR Handout May 2018 v6
SFS IR Handout May 2018 v6SmartFinalIR
 
AmCham Taipei 2016 Business Climate Survey - Full results Jan 19
AmCham Taipei 2016 Business Climate Survey - Full results Jan 19AmCham Taipei 2016 Business Climate Survey - Full results Jan 19
AmCham Taipei 2016 Business Climate Survey - Full results Jan 19Gordon Stewart
 
us-fsi-private-equity-growth-in-transition
us-fsi-private-equity-growth-in-transitionus-fsi-private-equity-growth-in-transition
us-fsi-private-equity-growth-in-transitionJ. Lynette DeWitt
 
SFS IR Presentation Sept 2018
SFS IR Presentation Sept 2018SFS IR Presentation Sept 2018
SFS IR Presentation Sept 2018SmartFinalIR
 
2015Q2 SCFG Commentary_with Snapshot
2015Q2 SCFG Commentary_with Snapshot2015Q2 SCFG Commentary_with Snapshot
2015Q2 SCFG Commentary_with SnapshotDrew Beja
 
ib-pulse-check-executive-summary
ib-pulse-check-executive-summaryib-pulse-check-executive-summary
ib-pulse-check-executive-summaryEoghan Trehy
 
Vocera investordeck december web
Vocera investordeck  december webVocera investordeck  december web
Vocera investordeck december webvocera2016ir
 
The Deloitte CFO Survey: 2013 Q3 results
The Deloitte CFO Survey: 2013 Q3 resultsThe Deloitte CFO Survey: 2013 Q3 results
The Deloitte CFO Survey: 2013 Q3 resultsDeloitte UK
 

What's hot (18)

Jpm 2015 final2
Jpm 2015 final2Jpm 2015 final2
Jpm 2015 final2
 
Strategic Portfolio Management PowerPoint Presentation Slides
Strategic Portfolio Management PowerPoint Presentation SlidesStrategic Portfolio Management PowerPoint Presentation Slides
Strategic Portfolio Management PowerPoint Presentation Slides
 
A Financial Review: Pharmaceuticals Industry
A Financial Review: Pharmaceuticals IndustryA Financial Review: Pharmaceuticals Industry
A Financial Review: Pharmaceuticals Industry
 
_ C@p_T3st
_ C@p_T3st_ C@p_T3st
_ C@p_T3st
 
2018 Shareholders Meeting - Management Presentation
2018 Shareholders Meeting - Management Presentation2018 Shareholders Meeting - Management Presentation
2018 Shareholders Meeting - Management Presentation
 
Conquest Quarterly Performance Report 4Q15
Conquest Quarterly Performance Report 4Q15Conquest Quarterly Performance Report 4Q15
Conquest Quarterly Performance Report 4Q15
 
Sfs ir handout June 2018 v1
Sfs ir handout June 2018 v1Sfs ir handout June 2018 v1
Sfs ir handout June 2018 v1
 
SFS IR Handout May 2018 v6
SFS IR Handout May 2018 v6SFS IR Handout May 2018 v6
SFS IR Handout May 2018 v6
 
It’s No More BRICs as Usual
It’s No More BRICs as UsualIt’s No More BRICs as Usual
It’s No More BRICs as Usual
 
AmCham Taipei 2016 Business Climate Survey - Full results Jan 19
AmCham Taipei 2016 Business Climate Survey - Full results Jan 19AmCham Taipei 2016 Business Climate Survey - Full results Jan 19
AmCham Taipei 2016 Business Climate Survey - Full results Jan 19
 
us-fsi-private-equity-growth-in-transition
us-fsi-private-equity-growth-in-transitionus-fsi-private-equity-growth-in-transition
us-fsi-private-equity-growth-in-transition
 
SFS IR Presentation Sept 2018
SFS IR Presentation Sept 2018SFS IR Presentation Sept 2018
SFS IR Presentation Sept 2018
 
2015Q2 SCFG Commentary_with Snapshot
2015Q2 SCFG Commentary_with Snapshot2015Q2 SCFG Commentary_with Snapshot
2015Q2 SCFG Commentary_with Snapshot
 
ib-pulse-check-executive-summary
ib-pulse-check-executive-summaryib-pulse-check-executive-summary
ib-pulse-check-executive-summary
 
Vocera investordeck december web
Vocera investordeck  december webVocera investordeck  december web
Vocera investordeck december web
 
GSk financial statement analysis
GSk financial statement analysisGSk financial statement analysis
GSk financial statement analysis
 
The Deloitte CFO Survey: 2013 Q3 results
The Deloitte CFO Survey: 2013 Q3 resultsThe Deloitte CFO Survey: 2013 Q3 results
The Deloitte CFO Survey: 2013 Q3 results
 
Q12015 deck final
Q12015 deck finalQ12015 deck final
Q12015 deck final
 

Similar to Sleep country draft roadshow presentation

Sleep country scotia back to school conference 2016
Sleep country scotia back to school conference 2016Sleep country scotia back to school conference 2016
Sleep country scotia back to school conference 2016SleepCountry
 
Sleep country draft roadshow presentation - updated as at dec 31 2015 v8
Sleep country   draft roadshow presentation - updated as at dec 31 2015 v8Sleep country   draft roadshow presentation - updated as at dec 31 2015 v8
Sleep country draft roadshow presentation - updated as at dec 31 2015 v8SleepCountry
 
Shopify q1 2017 investor deck
Shopify q1 2017 investor deckShopify q1 2017 investor deck
Shopify q1 2017 investor deckshopifyInvestors
 
Shopify Investor Deck
Shopify Investor DeckShopify Investor Deck
Shopify Investor Deckcraze3
 
Smart & Final Investor Relations Handout September 2017
Smart & Final Investor Relations Handout September 2017Smart & Final Investor Relations Handout September 2017
Smart & Final Investor Relations Handout September 2017SmartFinalIR
 
Sfs ir handout_september_2017
Sfs ir handout_september_2017Sfs ir handout_september_2017
Sfs ir handout_september_2017Sara Lenz, PMP
 
Investor presentation november 2016 final
Investor presentation   november 2016 finalInvestor presentation   november 2016 final
Investor presentation november 2016 finalInvestorCanadianTire
 
Csod investor deck_first_quarter_2014_final
Csod investor deck_first_quarter_2014_finalCsod investor deck_first_quarter_2014_final
Csod investor deck_first_quarter_2014_finalircornerstone
 
Shopify Investor Deck - August 2016
Shopify Investor Deck - August 2016Shopify Investor Deck - August 2016
Shopify Investor Deck - August 2016shopifyInvestors
 
Kraft Heinz Presentation at the 2024 CAGNY.pdf
Kraft Heinz Presentation at the 2024 CAGNY.pdfKraft Heinz Presentation at the 2024 CAGNY.pdf
Kraft Heinz Presentation at the 2024 CAGNY.pdfNeil Kimberley
 

Similar to Sleep country draft roadshow presentation (20)

Sleep country scotia back to school conference 2016
Sleep country scotia back to school conference 2016Sleep country scotia back to school conference 2016
Sleep country scotia back to school conference 2016
 
Sleep country draft roadshow presentation - updated as at dec 31 2015 v8
Sleep country   draft roadshow presentation - updated as at dec 31 2015 v8Sleep country   draft roadshow presentation - updated as at dec 31 2015 v8
Sleep country draft roadshow presentation - updated as at dec 31 2015 v8
 
Q1 2017 investor deck
Q1 2017 investor deckQ1 2017 investor deck
Q1 2017 investor deck
 
Q1 2017 investor deck
Q1 2017 investor deckQ1 2017 investor deck
Q1 2017 investor deck
 
Q1 2017 investor deck
Q1 2017 investor deck Q1 2017 investor deck
Q1 2017 investor deck
 
Shopify q1 2017 investor deck
Shopify q1 2017 investor deckShopify q1 2017 investor deck
Shopify q1 2017 investor deck
 
Shopify Investor Deck
Shopify Investor DeckShopify Investor Deck
Shopify Investor Deck
 
Investor deck q2 2017 (1)
Investor deck q2 2017 (1)Investor deck q2 2017 (1)
Investor deck q2 2017 (1)
 
Smart & Final Investor Relations Handout September 2017
Smart & Final Investor Relations Handout September 2017Smart & Final Investor Relations Handout September 2017
Smart & Final Investor Relations Handout September 2017
 
Sfs ir handout_september_2017
Sfs ir handout_september_2017Sfs ir handout_september_2017
Sfs ir handout_september_2017
 
Investor presentation november 2016 final
Investor presentation   november 2016 finalInvestor presentation   november 2016 final
Investor presentation november 2016 final
 
Q4 2016 investor deck pdf
Q4 2016 investor deck pdfQ4 2016 investor deck pdf
Q4 2016 investor deck pdf
 
Q4 2016 investor deck
Q4 2016 investor deckQ4 2016 investor deck
Q4 2016 investor deck
 
Csod investor deck_first_quarter_2014_final
Csod investor deck_first_quarter_2014_finalCsod investor deck_first_quarter_2014_final
Csod investor deck_first_quarter_2014_final
 
March 2017 investor deck (final)
March 2017 investor deck (final)March 2017 investor deck (final)
March 2017 investor deck (final)
 
Shopify Investor Deck - August 2016
Shopify Investor Deck - August 2016Shopify Investor Deck - August 2016
Shopify Investor Deck - August 2016
 
CSOD Investor Deck
CSOD Investor DeckCSOD Investor Deck
CSOD Investor Deck
 
Kraft Heinz Presentation at the 2024 CAGNY.pdf
Kraft Heinz Presentation at the 2024 CAGNY.pdfKraft Heinz Presentation at the 2024 CAGNY.pdf
Kraft Heinz Presentation at the 2024 CAGNY.pdf
 
Investor deck q2 2017
Investor deck q2 2017Investor deck q2 2017
Investor deck q2 2017
 
Investor deck q2 2018
Investor deck q2 2018Investor deck q2 2018
Investor deck q2 2018
 

Recently uploaded

VIP 7001035870 Find & Meet Hyderabad Call Girls Banjara Hills high-profile Ca...
VIP 7001035870 Find & Meet Hyderabad Call Girls Banjara Hills high-profile Ca...VIP 7001035870 Find & Meet Hyderabad Call Girls Banjara Hills high-profile Ca...
VIP 7001035870 Find & Meet Hyderabad Call Girls Banjara Hills high-profile Ca...aditipandeya
 
Teck Investor Presentation, April 24, 2024
Teck Investor Presentation, April 24, 2024Teck Investor Presentation, April 24, 2024
Teck Investor Presentation, April 24, 2024TeckResourcesLtd
 
CALL ON ➥8923113531 🔝Call Girls Vineet Khand Lucknow best Night Fun service 🧦
CALL ON ➥8923113531 🔝Call Girls Vineet Khand Lucknow best Night Fun service  🧦CALL ON ➥8923113531 🔝Call Girls Vineet Khand Lucknow best Night Fun service  🧦
CALL ON ➥8923113531 🔝Call Girls Vineet Khand Lucknow best Night Fun service 🧦anilsa9823
 
VIP Kolkata Call Girl Rishra 👉 8250192130 Available With Room
VIP Kolkata Call Girl Rishra 👉 8250192130  Available With RoomVIP Kolkata Call Girl Rishra 👉 8250192130  Available With Room
VIP Kolkata Call Girl Rishra 👉 8250192130 Available With Roomdivyansh0kumar0
 
Corporate Presentation Probe May 2024.pdf
Corporate Presentation Probe May 2024.pdfCorporate Presentation Probe May 2024.pdf
Corporate Presentation Probe May 2024.pdfProbe Gold
 
slideshare Call girls Noida Escorts 9999965857 henakhan
slideshare Call girls Noida Escorts 9999965857 henakhanslideshare Call girls Noida Escorts 9999965857 henakhan
slideshare Call girls Noida Escorts 9999965857 henakhanhanshkumar9870
 
Enjoy Night⚡Call Girls Udyog Vihar Gurgaon >༒8448380779 Escort Service
Enjoy Night⚡Call Girls Udyog Vihar Gurgaon >༒8448380779 Escort ServiceEnjoy Night⚡Call Girls Udyog Vihar Gurgaon >༒8448380779 Escort Service
Enjoy Night⚡Call Girls Udyog Vihar Gurgaon >༒8448380779 Escort ServiceDelhi Call girls
 
VIP 7001035870 Find & Meet Hyderabad Call Girls Miyapur high-profile Call Girl
VIP 7001035870 Find & Meet Hyderabad Call Girls Miyapur high-profile Call GirlVIP 7001035870 Find & Meet Hyderabad Call Girls Miyapur high-profile Call Girl
VIP 7001035870 Find & Meet Hyderabad Call Girls Miyapur high-profile Call Girladitipandeya
 
Malad Escorts, (Pooja 09892124323), Malad Call Girls Service
Malad Escorts, (Pooja 09892124323), Malad Call Girls ServiceMalad Escorts, (Pooja 09892124323), Malad Call Girls Service
Malad Escorts, (Pooja 09892124323), Malad Call Girls ServicePooja Nehwal
 
VIP Amritsar Call Girl 7001035870 Enjoy Call Girls With Our Escorts
VIP Amritsar Call Girl 7001035870 Enjoy Call Girls With Our EscortsVIP Amritsar Call Girl 7001035870 Enjoy Call Girls With Our Escorts
VIP Amritsar Call Girl 7001035870 Enjoy Call Girls With Our Escortssonatiwari757
 
Q3 FY24 Earnings Conference Call Presentation
Q3 FY24 Earnings Conference Call PresentationQ3 FY24 Earnings Conference Call Presentation
Q3 FY24 Earnings Conference Call PresentationSysco_Investors
 
Collective Mining | Corporate Presentation - May 2024
Collective Mining | Corporate Presentation - May 2024Collective Mining | Corporate Presentation - May 2024
Collective Mining | Corporate Presentation - May 2024CollectiveMining1
 
Short-, Mid-, and Long-term gxxoals.pptx
Short-, Mid-, and Long-term gxxoals.pptxShort-, Mid-, and Long-term gxxoals.pptx
Short-, Mid-, and Long-term gxxoals.pptxHenryBriggs2
 
High Profile Call Girls Kolkata Gayatri 🤌 8250192130 🚀 Vip Call Girls Kolkata
High Profile Call Girls Kolkata Gayatri 🤌  8250192130 🚀 Vip Call Girls KolkataHigh Profile Call Girls Kolkata Gayatri 🤌  8250192130 🚀 Vip Call Girls Kolkata
High Profile Call Girls Kolkata Gayatri 🤌 8250192130 🚀 Vip Call Girls Kolkataanamikaraghav4
 
《加州大学圣克鲁兹分校学位证书复制》Q微信741003700美国学历疑难问题指南|挂科被加州大学圣克鲁兹分校劝退没有毕业证怎么办?《UCSC毕业证购买|加...
《加州大学圣克鲁兹分校学位证书复制》Q微信741003700美国学历疑难问题指南|挂科被加州大学圣克鲁兹分校劝退没有毕业证怎么办?《UCSC毕业证购买|加...《加州大学圣克鲁兹分校学位证书复制》Q微信741003700美国学历疑难问题指南|挂科被加州大学圣克鲁兹分校劝退没有毕业证怎么办?《UCSC毕业证购买|加...
《加州大学圣克鲁兹分校学位证书复制》Q微信741003700美国学历疑难问题指南|挂科被加州大学圣克鲁兹分校劝退没有毕业证怎么办?《UCSC毕业证购买|加...wyqazy
 
Call Girls Chandigarh Just Call 8868886958 Top Class Call Girl Service Available
Call Girls Chandigarh Just Call 8868886958 Top Class Call Girl Service AvailableCall Girls Chandigarh Just Call 8868886958 Top Class Call Girl Service Available
Call Girls Chandigarh Just Call 8868886958 Top Class Call Girl Service AvailableSheetaleventcompany
 

Recently uploaded (20)

VIP 7001035870 Find & Meet Hyderabad Call Girls Banjara Hills high-profile Ca...
VIP 7001035870 Find & Meet Hyderabad Call Girls Banjara Hills high-profile Ca...VIP 7001035870 Find & Meet Hyderabad Call Girls Banjara Hills high-profile Ca...
VIP 7001035870 Find & Meet Hyderabad Call Girls Banjara Hills high-profile Ca...
 
Teck Investor Presentation, April 24, 2024
Teck Investor Presentation, April 24, 2024Teck Investor Presentation, April 24, 2024
Teck Investor Presentation, April 24, 2024
 
CALL ON ➥8923113531 🔝Call Girls Vineet Khand Lucknow best Night Fun service 🧦
CALL ON ➥8923113531 🔝Call Girls Vineet Khand Lucknow best Night Fun service  🧦CALL ON ➥8923113531 🔝Call Girls Vineet Khand Lucknow best Night Fun service  🧦
CALL ON ➥8923113531 🔝Call Girls Vineet Khand Lucknow best Night Fun service 🧦
 
VIP Kolkata Call Girl Rishra 👉 8250192130 Available With Room
VIP Kolkata Call Girl Rishra 👉 8250192130  Available With RoomVIP Kolkata Call Girl Rishra 👉 8250192130  Available With Room
VIP Kolkata Call Girl Rishra 👉 8250192130 Available With Room
 
Call Girls Service Green Park @9999965857 Delhi 🫦 No Advance VVIP 🍎 SERVICE
Call Girls Service Green Park @9999965857 Delhi 🫦 No Advance  VVIP 🍎 SERVICECall Girls Service Green Park @9999965857 Delhi 🫦 No Advance  VVIP 🍎 SERVICE
Call Girls Service Green Park @9999965857 Delhi 🫦 No Advance VVIP 🍎 SERVICE
 
Corporate Presentation Probe May 2024.pdf
Corporate Presentation Probe May 2024.pdfCorporate Presentation Probe May 2024.pdf
Corporate Presentation Probe May 2024.pdf
 
slideshare Call girls Noida Escorts 9999965857 henakhan
slideshare Call girls Noida Escorts 9999965857 henakhanslideshare Call girls Noida Escorts 9999965857 henakhan
slideshare Call girls Noida Escorts 9999965857 henakhan
 
Enjoy Night⚡Call Girls Udyog Vihar Gurgaon >༒8448380779 Escort Service
Enjoy Night⚡Call Girls Udyog Vihar Gurgaon >༒8448380779 Escort ServiceEnjoy Night⚡Call Girls Udyog Vihar Gurgaon >༒8448380779 Escort Service
Enjoy Night⚡Call Girls Udyog Vihar Gurgaon >༒8448380779 Escort Service
 
VIP 7001035870 Find & Meet Hyderabad Call Girls Miyapur high-profile Call Girl
VIP 7001035870 Find & Meet Hyderabad Call Girls Miyapur high-profile Call GirlVIP 7001035870 Find & Meet Hyderabad Call Girls Miyapur high-profile Call Girl
VIP 7001035870 Find & Meet Hyderabad Call Girls Miyapur high-profile Call Girl
 
Malad Escorts, (Pooja 09892124323), Malad Call Girls Service
Malad Escorts, (Pooja 09892124323), Malad Call Girls ServiceMalad Escorts, (Pooja 09892124323), Malad Call Girls Service
Malad Escorts, (Pooja 09892124323), Malad Call Girls Service
 
VIP Amritsar Call Girl 7001035870 Enjoy Call Girls With Our Escorts
VIP Amritsar Call Girl 7001035870 Enjoy Call Girls With Our EscortsVIP Amritsar Call Girl 7001035870 Enjoy Call Girls With Our Escorts
VIP Amritsar Call Girl 7001035870 Enjoy Call Girls With Our Escorts
 
Q3 FY24 Earnings Conference Call Presentation
Q3 FY24 Earnings Conference Call PresentationQ3 FY24 Earnings Conference Call Presentation
Q3 FY24 Earnings Conference Call Presentation
 
Call Girls 🫤 Nehru Place ➡️ 9999965857 ➡️ Delhi 🫦 Russian Escorts FULL ENJOY
Call Girls 🫤 Nehru Place ➡️ 9999965857  ➡️ Delhi 🫦  Russian Escorts FULL ENJOYCall Girls 🫤 Nehru Place ➡️ 9999965857  ➡️ Delhi 🫦  Russian Escorts FULL ENJOY
Call Girls 🫤 Nehru Place ➡️ 9999965857 ➡️ Delhi 🫦 Russian Escorts FULL ENJOY
 
Russian Call Girls Rohini Sector 3 💓 Delhi 9999965857 @Sabina Modi VVIP MODEL...
Russian Call Girls Rohini Sector 3 💓 Delhi 9999965857 @Sabina Modi VVIP MODEL...Russian Call Girls Rohini Sector 3 💓 Delhi 9999965857 @Sabina Modi VVIP MODEL...
Russian Call Girls Rohini Sector 3 💓 Delhi 9999965857 @Sabina Modi VVIP MODEL...
 
Collective Mining | Corporate Presentation - May 2024
Collective Mining | Corporate Presentation - May 2024Collective Mining | Corporate Presentation - May 2024
Collective Mining | Corporate Presentation - May 2024
 
Short-, Mid-, and Long-term gxxoals.pptx
Short-, Mid-, and Long-term gxxoals.pptxShort-, Mid-, and Long-term gxxoals.pptx
Short-, Mid-, and Long-term gxxoals.pptx
 
(👉゚9999965857 ゚)👉 VIP Call Girls Greater Noida 👉 Delhi 👈 : 9999 Cash Payment...
(👉゚9999965857 ゚)👉 VIP Call Girls Greater Noida  👉 Delhi 👈 : 9999 Cash Payment...(👉゚9999965857 ゚)👉 VIP Call Girls Greater Noida  👉 Delhi 👈 : 9999 Cash Payment...
(👉゚9999965857 ゚)👉 VIP Call Girls Greater Noida 👉 Delhi 👈 : 9999 Cash Payment...
 
High Profile Call Girls Kolkata Gayatri 🤌 8250192130 🚀 Vip Call Girls Kolkata
High Profile Call Girls Kolkata Gayatri 🤌  8250192130 🚀 Vip Call Girls KolkataHigh Profile Call Girls Kolkata Gayatri 🤌  8250192130 🚀 Vip Call Girls Kolkata
High Profile Call Girls Kolkata Gayatri 🤌 8250192130 🚀 Vip Call Girls Kolkata
 
《加州大学圣克鲁兹分校学位证书复制》Q微信741003700美国学历疑难问题指南|挂科被加州大学圣克鲁兹分校劝退没有毕业证怎么办?《UCSC毕业证购买|加...
《加州大学圣克鲁兹分校学位证书复制》Q微信741003700美国学历疑难问题指南|挂科被加州大学圣克鲁兹分校劝退没有毕业证怎么办?《UCSC毕业证购买|加...《加州大学圣克鲁兹分校学位证书复制》Q微信741003700美国学历疑难问题指南|挂科被加州大学圣克鲁兹分校劝退没有毕业证怎么办?《UCSC毕业证购买|加...
《加州大学圣克鲁兹分校学位证书复制》Q微信741003700美国学历疑难问题指南|挂科被加州大学圣克鲁兹分校劝退没有毕业证怎么办?《UCSC毕业证购买|加...
 
Call Girls Chandigarh Just Call 8868886958 Top Class Call Girl Service Available
Call Girls Chandigarh Just Call 8868886958 Top Class Call Girl Service AvailableCall Girls Chandigarh Just Call 8868886958 Top Class Call Girl Service Available
Call Girls Chandigarh Just Call 8868886958 Top Class Call Girl Service Available
 

Sleep country draft roadshow presentation

  • 2. Disclaimers 2 Forward-looking Information This presentation, including, in particular, under the headings entitled “Stable, long-term growth”, “Key drivers of SSS growth”, “Roadmap to growth – Increase accessories sales”, “Roadmap to growth – Add stores in existing, satellite and new markets”, “Attractive financial model results in strong cash flow conversion”, “National scale has economic benefits”, “Regional store density adds profitability and barrier to entry”, Select Financial Highlights and Growth Targets” and “Investment Highlights”, contains forward-looking information and forward-looking statements which reflect the current view of management with respect to the Company’s objectives, plans, goals, strategies, outlook, results of operations, financial and operating performance, prospects and opportunities. Wherever used, the words “may”, “will”, “anticipate”, “intend”, “estimate”, “expect”, “plan”, “believe” and similar expressions identify forward-looking information and forward-looking statements. Forward-looking information and forward-looking statements should not be reads as guarantees of future events, performance or results, and will not necessarily be accurate indications of whether, or the times at which, such events, performance or results will be achieved. All of the information in this presentation containing forward-looking information or forward-looking statements is qualified by these cautionary statements. Forward-looking information and forward-looking statements are based on information available to management at the time they are made, underlying estimates, opinions and assumptions made by management and management’s current good faith belief with respect to future strategies, prospects, events, performance and results, and are subject to inherent risks and uncertainties surrounding future expectations generally. Such risks and uncertainties include, but are not limited to, those described in the Company’s 2016 annual information form (the “AIF”) filed on February 28, 2017. A copy of the AIF can be accessed under the Company’s profile on the System for Electronic Document Analysis and Retrieval (SEDAR) at www.sedar.com. Additional risks and uncertainties not presently known to the Company or that the Company currently believes to be less significant may also adversely affect the Company. The Company cautions that the list of risk factors and uncertainties described in the AIF is not exhaustive and that should certain risks or uncertainties materialize, or should underlying assumptions prove incorrect, actual strategies, prospects, events, performance and results may vary significantly from those expected. There can be no assurance that the actual strategies, prospects, results, performance, events or activities anticipated by the Company will be realized or, even if substantially realized, that they will have the expected consequences to, or effects on, the Company. Readers are urged to consider the risks, uncertainties and assumptions carefully in evaluating the forward-looking information and forward-looking statements and are cautioned not to place undue reliance on such information and statements. The Company does not undertake to update any such forward-looking information or forward-looking statements, whether as a result of new information, future events or otherwise, except as required by applicable laws. The Company prepares its financial statements in accordance with International Financial Reporting Standards ("IFRS"). In order to provide additional insight into the business, to provide investors with supplemental measures of its operating performance and to highlight trends in its business that may not otherwise be apparent when relying solely on IFRS financial measures, the Company has also provided in this presentation certain non-IFRS measures, including "Same Store Sales Growth" or "SSSG", "EBITDA", "Operating EBITDA", "Operating EBITDA Margin" and "Conversion", each as defined under the heading entitled "Description of Non-IFRS Measures and Retail Industry Metrics" at the end of this presentation. These measures are provided as additional information to complement IFRS measures by providing further understanding of the Company's results of operations from management's perspective. Management also uses non-IFRS measures in order to facilitate operating performance comparisons from period to period, to prepare annual operating budgets and forecasts and to determine components of management compensation. The Company also believes that securities analysts, investors and other interested parties frequently use non-IFRS measures in the evaluation of issuers. Readers are cautioned that these non-IFRS measures are not recognized under IFRS and do not have a standardized meaning prescribed by IFRS. They are therefore unlikely to be comparable to similarly titled measures presented by other publicly traded companies. Accordingly, they should not be considered in isolation nor as a substitute for analysis of the Company's financial information reported under IFRS. For further details concerning how the Company calculates these non-IFRS measures and for reconciliations to the most comparable IFRS measures, please see the Company's most recent management's discussion and analysis of financial condition and results of operation filed with Canadian securities regulatory authorities and available on SEDAR at www.sedar.com. Non-IFRS Measures and Retail Industry Metrics
  • 3. Sleep Country 3 David Friesema Robert Masson Stewart Schaefer Chief Executive Officer Chief Financial Officer & Corporate Secretary Chief Business Development Officer
  • 4. Investment Highlights 4 The Leading Specialty Mattress Retailer in Canada Best-in-Class Retailer Driven by Superior Strategy and Execution Clear Growth Strategy Attractive Financial Model with Strong Cash Flow Conversion Compelling Industry Fundamentals Experienced and Committed Management Team
  • 5. Industry Fundamentals Stable Growth – Canadian Market 5 (1) Source: Based on survey of the 10 largest mattress manufacturers in Canada.  Unit demand in Canada has grown at only 1% CAGR over the past 13 years. AUSP has driven most of the growth.  Necessity purchase not a fashion item; Recurring demand driven by 10-12 year replacement cycle, so even during an economic downturn sales are typically deferred and not lost  Consumer preferences evolving toward premium quality, larger mattresses given growing health awareness and preference for high-quality sleep  Price increases due to inflation are typically passed through to consumers Canada Mattress and Foundation Wholesale Sales (1) INCREASE 8.0% 6.6% 4.0% -1.3% -11.3% 3.2% 3.3% 6.1% 6.0% 0.6% 4.9% 6.8% INCREASE 6.1% 4.1% 4.8% 0.0% -12.9% 4.4% 4.2% 2.2% 2.2% 0.3% -2.5% 2.0% INCREASE 2.8% 2.4% -0.8% -1.3% 1.9% -1.2% -0.9% 3.9% 3.7% 0.3% 7.5% 4.7%
  • 6. The Leading Specialty Mattress Retailer in Canada 6  244 stores and 16 distribution centres across 9 provinces (1)  Has opened 106 stores since the beginning of 2007  Only specialty mattress retailer with a national and regionally diverse footprint  Estimated national market share of approx. 25% (1) Store count as of September 2, 2017. BC AB SK MB ON QC NL NB PE NS 40 30 6 7 99 953 Sleep Country's National Footprint (# of stores) LTM (C$ millions) Sales $553.6 Operating EBITDA $91.1
  • 7. Best-in-Class Retailer Driven by Superior Strategy and Execution 7 “Best-in-Class” Retailer Strong Brand Recognition 1 Unrivalled In-Store Customer Experience 2 Highly Trained and Dedicated Workforce with a Strong Culture of Customer Service 4 Superior Home Delivery Experience and Ongoing Customer Relationships 3
  • 8. Differentiated strategy has delivered strong results and momentum 8 Sleep Country Quarterly Sales Growth (1) (1) Source: Company report. See ‘‘Non-IFRS Measures and Retail Industry Metrics”. 1.3% 9.1% 11.1% 10.2% 10.5% 7.7% 13.4% 12.9% 11.7% 12.2% 7.7% 9.6% 11.9% 7.5% 5.5% 13.1% 14.7% 13.1% 12.6% 10.6% 17.7% 18.3% 17.1% 17.3% 12.5% 13.7% 15.8% 10.7% 0.0% 2.0% 4.0% 6.0% 8.0% 10.0% 12.0% 14.0% 16.0% 18.0% 20.0% Q1 Q2 Q3 Q4 Q1 Q2 Q3 Q4 Q1 Q2 Q3 Q4 Q1 Q2 2014 2015 2016 2017 Same Store Sales Growth Total Sales Growth
  • 9. 9 Roadmap to Growth - SSS Growth Increase Traffic  Increased marketing investment  Expand messaging  Increase market share Increase Conversion of Shoppers to Buyers  Continued focus on hiring the best people  Additional training initiatives Higher AUSP  Continued shift to higher quality mattresses  Larger sizes are increasing in popularity Expand Accessory Sales  Expand and improve product lines  Additional marketing messaging  Enhanced training  Launch of eCommerce channel  More details on page 10 Enhanced Store Design  Contemporary design creates bright and welcoming atmosphere  Greater emphasis on accessory displays  More details on page 11
  • 10. Roadmap to Growth – Expand Accessories Sales 10  Bedframes  Pillows  Mattress pads Key Accessories Sleep Country Accessories Revenue (1) (C$ millions)  Sheets  Duvets  Headboards and Footboards Opportunity to capture market share in an estimated $830 million highly fragmented yet addressable market in Canada (1) Source: Company report. 2017 is LTM Q2 2017 15.5% CAGR
  • 11. Launch of e-commerce with mattress in-a-box and accessories. Provide our customer with a seamless experience across both channels. Drive new traffic by targeting a different demographic. The creation of a new revenue channel. Continue to drive traffic to our stores.
  • 12. Introducing Bloom, our exclusive mattress in a box that ships for free right to your door….
  • 13. Throws Throws Online Accessories Expansion – Testing new accessory product categories online before rolling them out to our stores. Robes Snap Beds
  • 14. Roadmap to Growth – Enhanced Store Design 14 Results for the 54 stores renovated to date show an increase in revenues above our national SSSG
  • 15. 12 10 8 4 10 13 5 13 11 9 2008 2009 2010 2011 2012 2013 2014 2015 2016 YTD 2017 Store Growth Roadmap to Growth – Add New Stores 15 Significant white space is available given our low store density Target to open 8 to 12 new stores per year  Modest net new store investment of approximately $400,000 comprising of capex and working capital investment  Typically, new in-fill and satellite stores are cash flow positive within 6 and 12 months, respectively Average 9.5 Store count as of September 2, 2017.
  • 16. Attractive Financial Model – Recent Results 16 Sales momentum driving increasing EBITDA Strong historical sales growth through new store openings and same store sales growth
  • 17. Attractive Financial Model - Low Capital Expenditure Model 17 Maintenance capital expenditures have averaged 1.0% of revenue from 2008 to 2017 (1) Source: Company report. Sleep Country Maintenance and Growth Capital Expenditures (% of sales) (1) 1.4% 0.8% 0.8% 1.0% 1.3% 1.2% 0.5% 0.8% 1.0% 0.9% 1.1% 0.7% 0.5% 0.9% 1.5% 1.9% 1.3% 2.4% 2.5% 4.7% 2.6% 1.5% 1.2% 1.9% 2.9% 3.1% 1.8% 3.2% 3.5% 5.6% 2008 2009 2010 2011 2012 2013 2014 2015 2016 Q2 2017 Maintenance Growth
  • 18. Attractive Financial Model - Strong New Store Economics 18 Stores Generate Cash on Cash Payback < 1.5 Years Representative New Store Investment ($ in thousands) Average Investment Buildout and Equipping Cost Floor Sample Inventory $430 50 Less: Tenant Reimbursement 480 (80) Cash Requirement, Net $400 New Store Results ($ in thousands) Year 1 Sales $1,200 - $1,500 Store 4-Wall Profitability(1) % of Sales $317 - $396 26.4% Annual Cash on Cash Return 79% -100% Store 4-wall profitability drives improving leverage over market-level costs as store penetration increases (1) Based on 2016 gross profit margin after taking in to account 3rd party finance charges and mattress recycling cost.
  • 19. Attractive Financial Model – Conservative Leverage 19 Capital structure provides financial flexibility to grow the business, while providing returns to shareholders Revolving Credit Facility $119.0 Finance Leases $2.3 Total Long Term Debt $121.3 Net Debt / LTM Operating EBITDA 1.07x Less: Cash on Hand ($23.7) Net Debt $97.6 Outstanding Lease Liabilities Net Debt / EBITDAR $171.0 2.04x As at June 30, 2017 (C$ millions)
  • 20. Attractive Financial Model – Strong Free Cash Flow 20 Negative working capital model, quick ROI on new stores and low leverage provides flexibility for investments and return to shareholders As at June 30, 2017 (C$ millions) Operating EBITDA(1) 91.1 CAPEX(1) 20.7 Interest(2) 3.6 Taxes(3) 20.0 Free Cash Flow available for dividends 46.8 Number of shares outstanding 37.65 million Dividend - $0.165 per quarter 24.8 Payout Ratio 53.0% (1) Based on last 12 months ended June 30, 2017. (2) Pro-forma based on year to date June 30, 2017. (3) Pro-forma based on 26.5% tax rate.
  • 21. Select Financial Highlights(1) 21 (1) See “Non-IFRS Measures and Retail Industry Metrics”. (2) Excludes SG&A expenses added back in the reconciliation of EBITDA to Operating EBITDA. (C$ million unless otherwise stated) 2015 2016 Q2 2016 Q2 2107 Revenue $456.2 $523.8 $120.2 $133.0 Same Store Sales Growth 11.3% 10.0% 12.2% 7.5% Net New Stores 13 11 5 5 Gross profit $126.8 $151.4 $33.7 $37.3 Gross Margin 27.8% 28.9% 28.0% 28.1% SG&A(2) $57.7 $66.4 $15.8 $17.1 % of Sales 12.6% 12.7% 13.2% 12.9% Operating EBITDA $69.1 $85.0 $17.9 $20.2 Operating EBITDA Margin 15.2% 16.2% 14.9% 15.2% Adjusted Net Income $39.3 $51.1 $10.0 $11.9 Adjusted Earning per Share 1.05 1.36 0.27 0.32
  • 22. Proven Management Team committed to growing the business and shareholder value 22 Member Years at Sleep Country Relevant Experience Biography Dave Friesema  Chief Executive Officer 20+ 20+  Held numerous senior positions at Sleep Country including Head of Sales, General Manager and Chief Operating Officer  Chairman of the Better Sleep Council Canada  Helped establish and manage mattress retail organizations in the United States Robert Masson  Chief Financial Officer and Corporate Secretary 5 20+  Chief Financial Officer of Second Cup from 2009 to 2013  Prior to joining Sleep Country, Robert had extensive management experience with several other public and private companies including, IBM Canada, Manchuwok, Ernst & Young, Deloitte & Touche and Sappi Stewart Schaefer  President, Dormez-vous?  Chief Business Development Officer 13 20+  Founded Dormez-vous? in 1994; grew the business to five stores before being acquired by Sleep Country in 2006  In 1992, co-founded Heritage Classic Beds, a distributor of metal beds  Commodity Broker in Chicago from 1986 to 1992, later returning to Montreal to work at Dean Witter Reynolds and Refco Futures Dave Howcroft  Senior Vice President, Sales 20+ 20+  Created programs to consistently build, develop and motivate a first-class sales team  Instrumental in developing and implementing various sales workshops, training programs and sales processes Sieg Will  Senior Vice President, Operations 17 20+  Instrumental in development and implementation of standard operating policies and procedures across organization  Held senior positions with Canadian Tire and PepsiCo in the sales, operations and account management areas Eric Solomon  Senior Vice President, Merchandising and Marketing 20+ 20+  Instrumental in growing the business by increasing "top-of-mind" brand awareness  Provides oversight to the marketing department Stephen Gunn  Founder & Executive Co-Chair 20+ 20+  Co-founded Sleep Country in 1994  Co-founded and was President of Kenrick Capital, a private equity firm  Management Consultant at McKinsey and Company from 1981 to 1987  Serves on the Board of Directors of Dollarama, Golfsmith International, Cara and Mastermind Toys Christine Magee  Founder & Executive Co-Chair 20+ 20+  Co-founded Sleep Country in 1994  Senior Manager of Corporate and Commercial Lending with National Bank from 1985 to 1994  Serves on the Board of Directors of Sirius XM Canada, Trillium Health Partners and the Advisory Board of the Ivey School of Business
  • 23. Investment Highlights 23 Compelling Industry Fundamentals  North American mattress and foundation industry is characterized by stable, long-term growth and a high degree of resiliency to economic swings  Industry demand driven by essential nature of product and replacement cycle of 10-12 years  Shift in consumer preference towards larger size mattresses and premium quality products  Consumers have shifted preference towards specialty mattress retailers due to big-ticket nature of mattress purchase and lack of consumer product knowledge  Low vulnerability to online competition and showrooming due to highly tactile purchase decision, The Leading Specialty Mattress Retailer in Canada  Only specialty mattress retailer in Canada with a national and regionally diverse footprint  National footprint of 244 stores and 16 distribution centres across 9 provinces  Leading specialty mattress retailer with an estimated national market share of 25% Best-in-Class Retailer Driven by Superior Strategy and Execution  Largest share of customer visits across Canada driven by “top-of-mind” unaided brand awareness and 20-year advertising investment  Unrivalled in-store customer experience drives high conversion of sales, repeat business and superior sales per associate metrics  Superior home delivery experience and ongoing customer relationships drives high customer satisfaction, repeat sales and word-of-mouth advertising  Highly trained and dedicated workforce with a strong culture of customer service  Convenient and highly visible locations Clear Growth Strategy  Strong same store sales growth(1) potential driven by increased mattress and accessories sales growth and continued implementation of enhanced store design  Opportunity to open 8-12 net new stores per year in existing, satellite and new markets  Operating leverage on sales growth through highly scalable centralized support infrastructure  Selectively consider strategic acquisitions that are accretive and enhance market opportunities Attractive Financial Model with Strong Cash Flow Conversion  National scale creates economic advantages  Regional scale optimizes economics on a per-store basis  Negative working capital operating model facilitated by "just in time" inventory relationship with suppliers, funds growth  Low capital expenditure requirements due to asset-light business model (~1.0% maintenance capex requirements)  Compelling new store economics with in-fill locations typically becoming cash flow positive within 6 months of opening Experienced and Committed Management Team  Highly experienced management team with proven track record  On average 15+ years of experience with Sleep Country and 20+ years of relevant industry experience  Proven track record of success as a public company  Co-founders remain committed to the business and its long-term success (1) See “Non-IFRS Measures and Retail Industry Metrics”.
  • 24. Description of Non-IFRS Measures and Retail Industry Metrics 24 This presentation makes reference to certain non-IFRS measures including: “AUSP” is defined as the average unit selling price of a mattress and foundation set. “EBITDA” is defined as net earnings (loss) from continuing operations before: (i) net interest expense and other financing charges; (ii) income taxes; (iii) depreciation of property, plant and equipment; and (iv) amortization of other assets. “Conversion” is defined as the number of customers who entered a store and made a purchase divided by the total number of customers who entered the store (expressed as a percentage). “Operating EBITDA” is defined as EBITDA adjusted for: (i) reduction in management bonuses; (ii) reduction in management compensation; (iii) certain non- recurring items (shareholder reorganization, professional fees and customer deposit breakages and other provision); and (iv) share based compensation. “Same Store Sales Growth” or “SSSG” is a retail industry metric used to compare sales derived from the established stores of certain period over the same period in prior year. SSSG helps to explain what portion of sales growth can be attributed to growth in established stores and what portion can be attributed to the opening of the new stores. Sleep Country calculates SSSG as the percentage increase or decrease in sales of stores opened for at least 12 complete months relative to the same period in the prior year. These measures are not recognized measures under IFRS and do not have a standardized meaning prescribed by IFRS. They are therefore unlikely to be comparable to similarly titled measures presented by other publicly traded companies. Accordingly, they should not be considered in isolation nor as a substitute for analysis of the Company’s financial information reported under IFRS. For further details concerning how the Company calculates these non-IFRS measures and for reconciliations to the most comparable IFRS measures, please see the Company's most recent management's discussion and analysis of financial condition and results of operation filed with Canadian securities regulatory authorities and available on SEDAR at www.sedar.com.