
![ANATOMY OF DECISION TREE
4
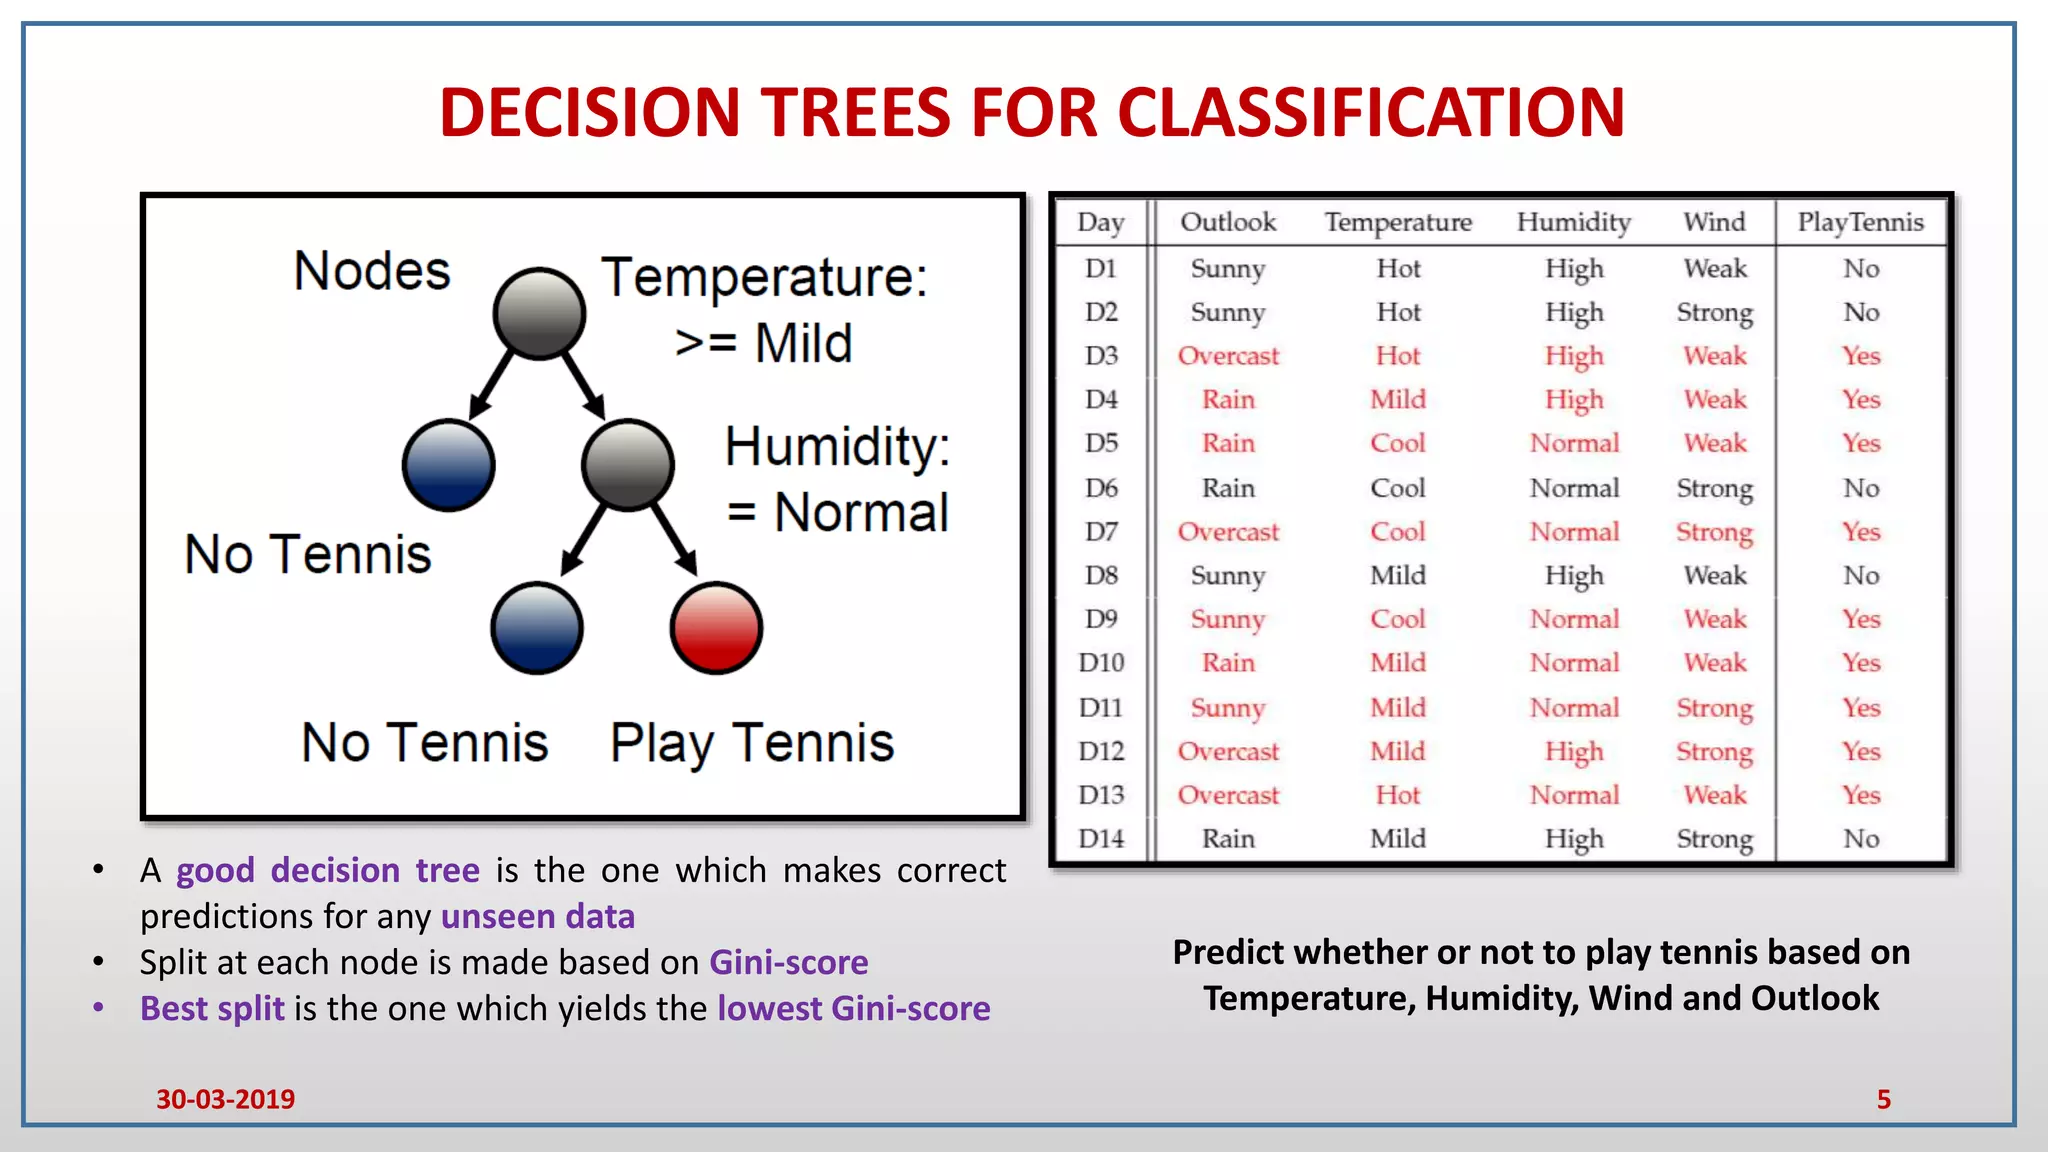
• Trees that predict categorical results are
called as decision trees
• At each node certain set of rules should be
satisfied
• Output from each node will be a Boolean
(True/False)
• Splitting is a process of dividing a node into
two or more sub nodes
• Root node represents the entire population
• When sub nodes split into further sub
nodes then it’s a decision node
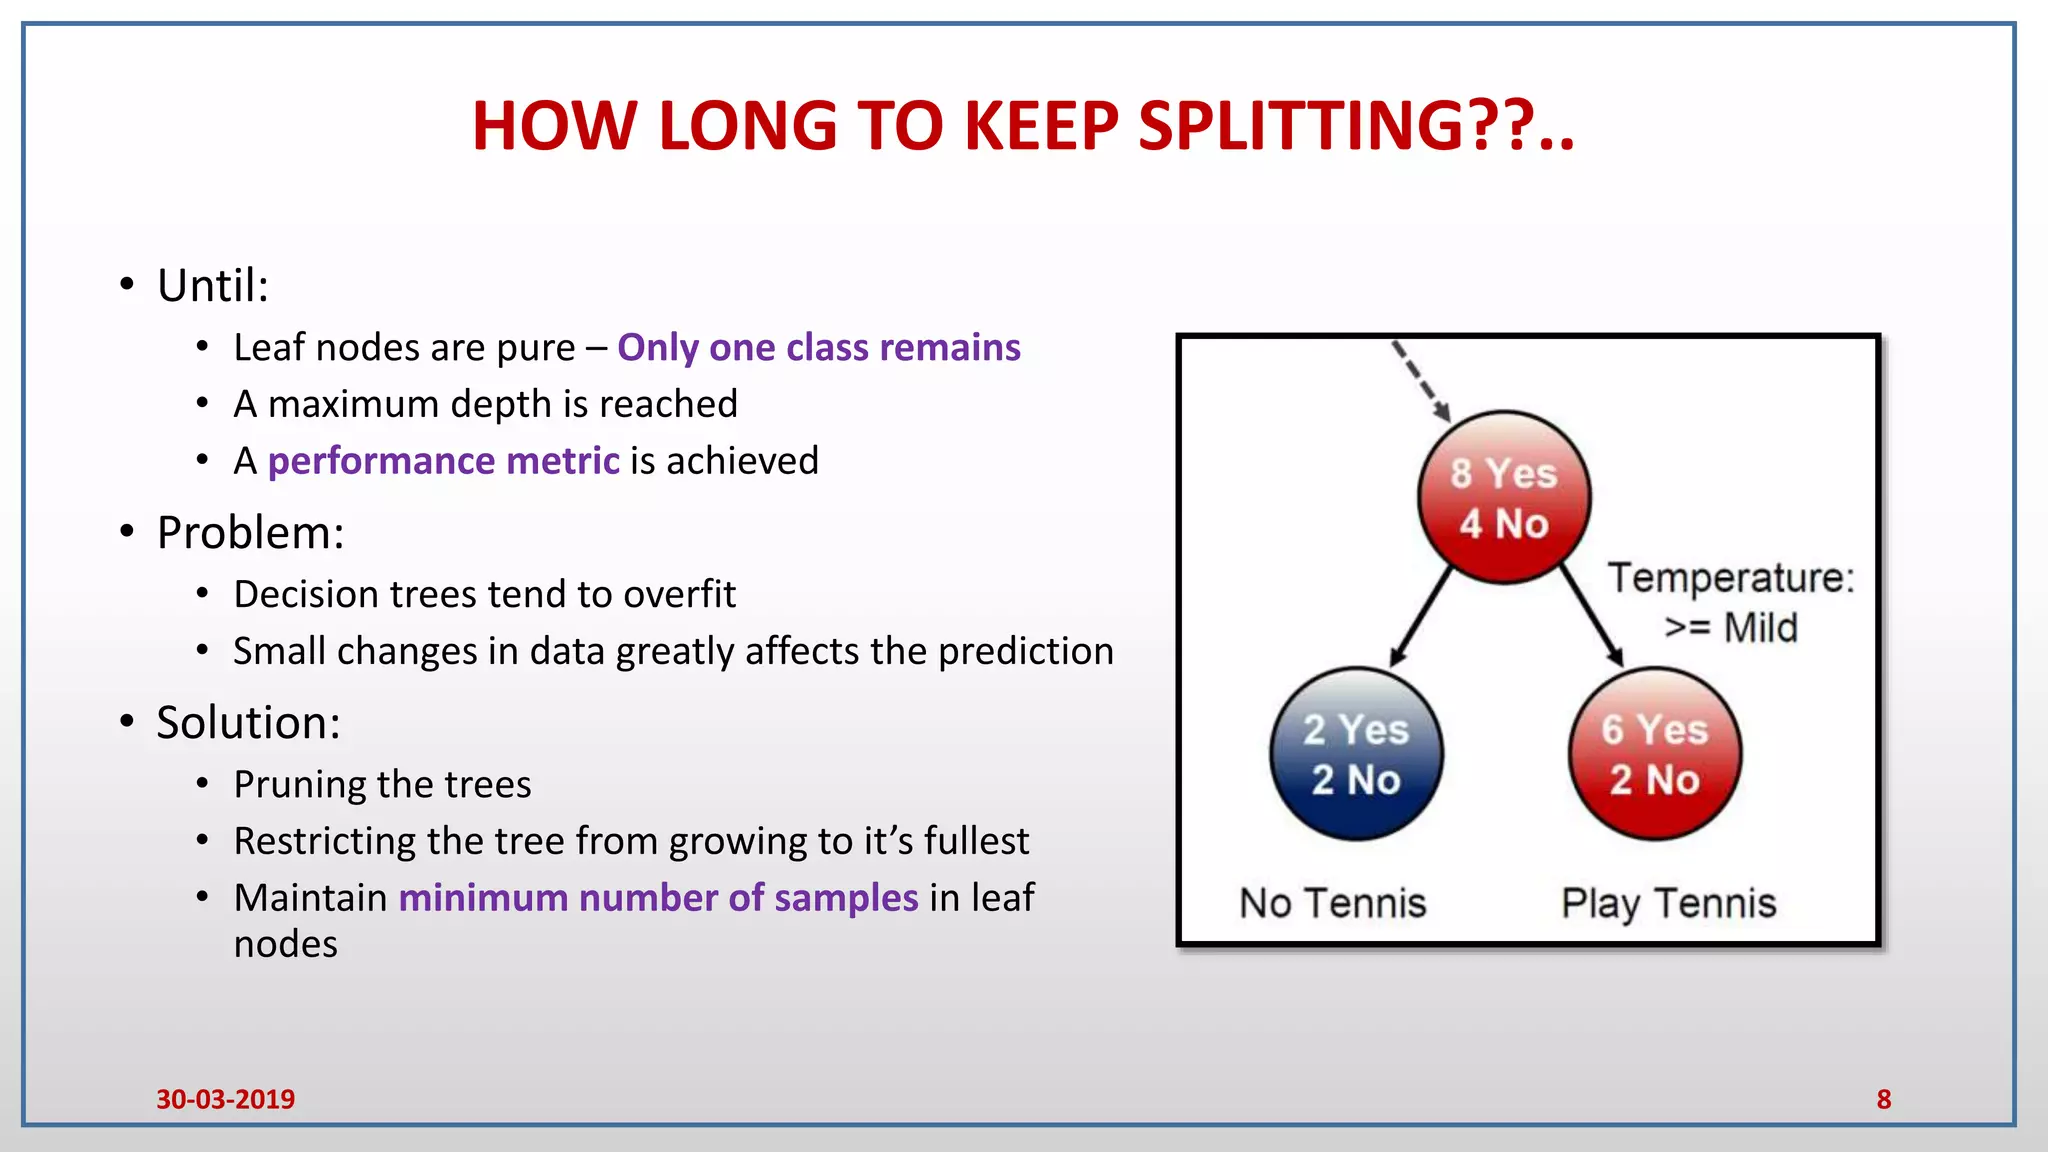
• Nodes that do not split are called as
terminal nodes/leaf nodes
ROOT NODE
DECISION NODE
LEAF NODE
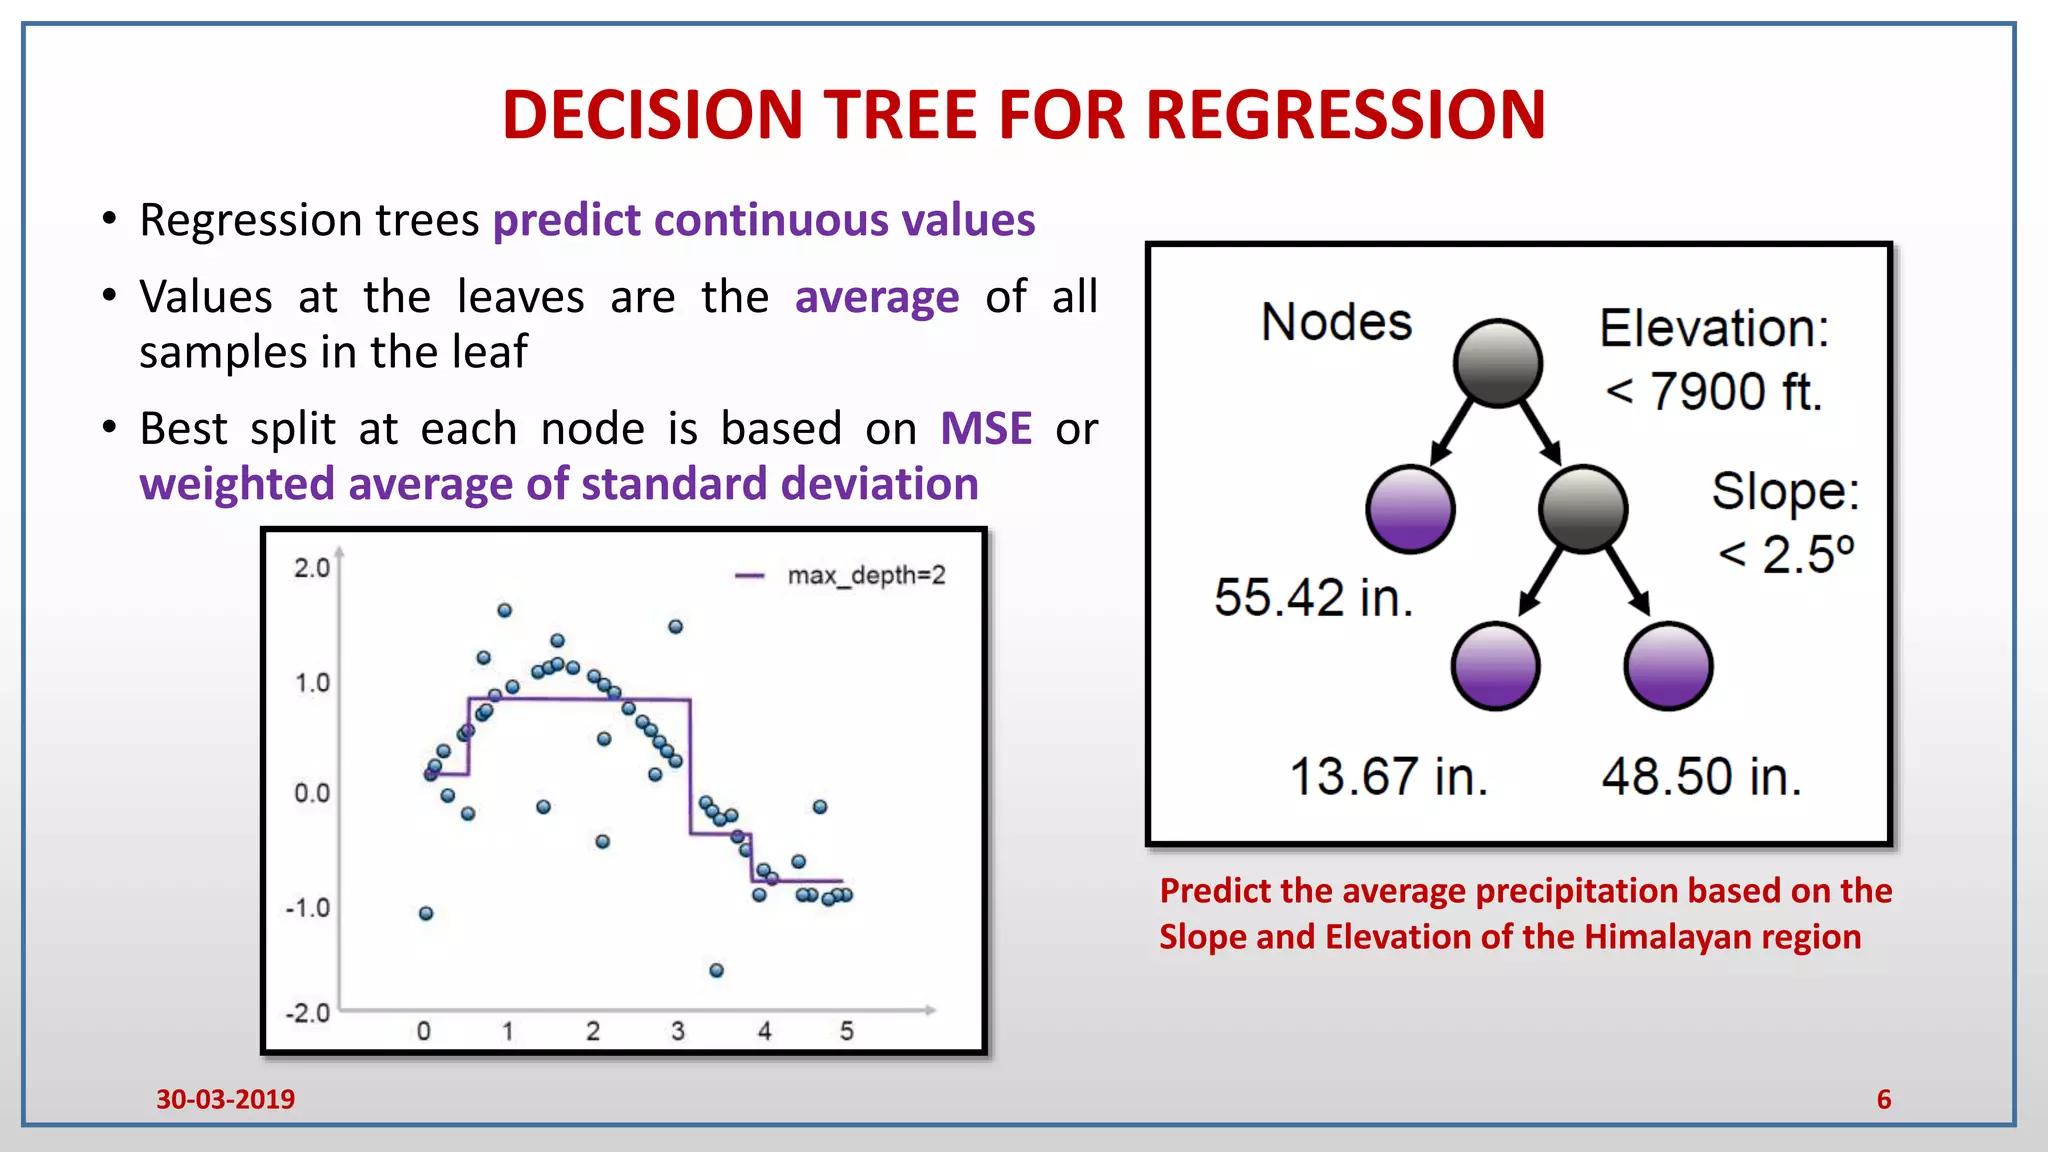
Decision tree for Regression dataset
X[i] :- Input variables in the dataset
MSE :- Mean Squared Error of all samples in a node
Samples :- Total number of samples in a node
Value :- Average value of all samples corresponding to
an output variable in a node
30-03-2019](https://image.slidesharecdn.com/introductiontorandomforestandgradientboostingmethods-alecture-190402015955/75/Introduction-to-random-forest-and-gradient-boosting-methods-a-lecture-4-2048.jpg)
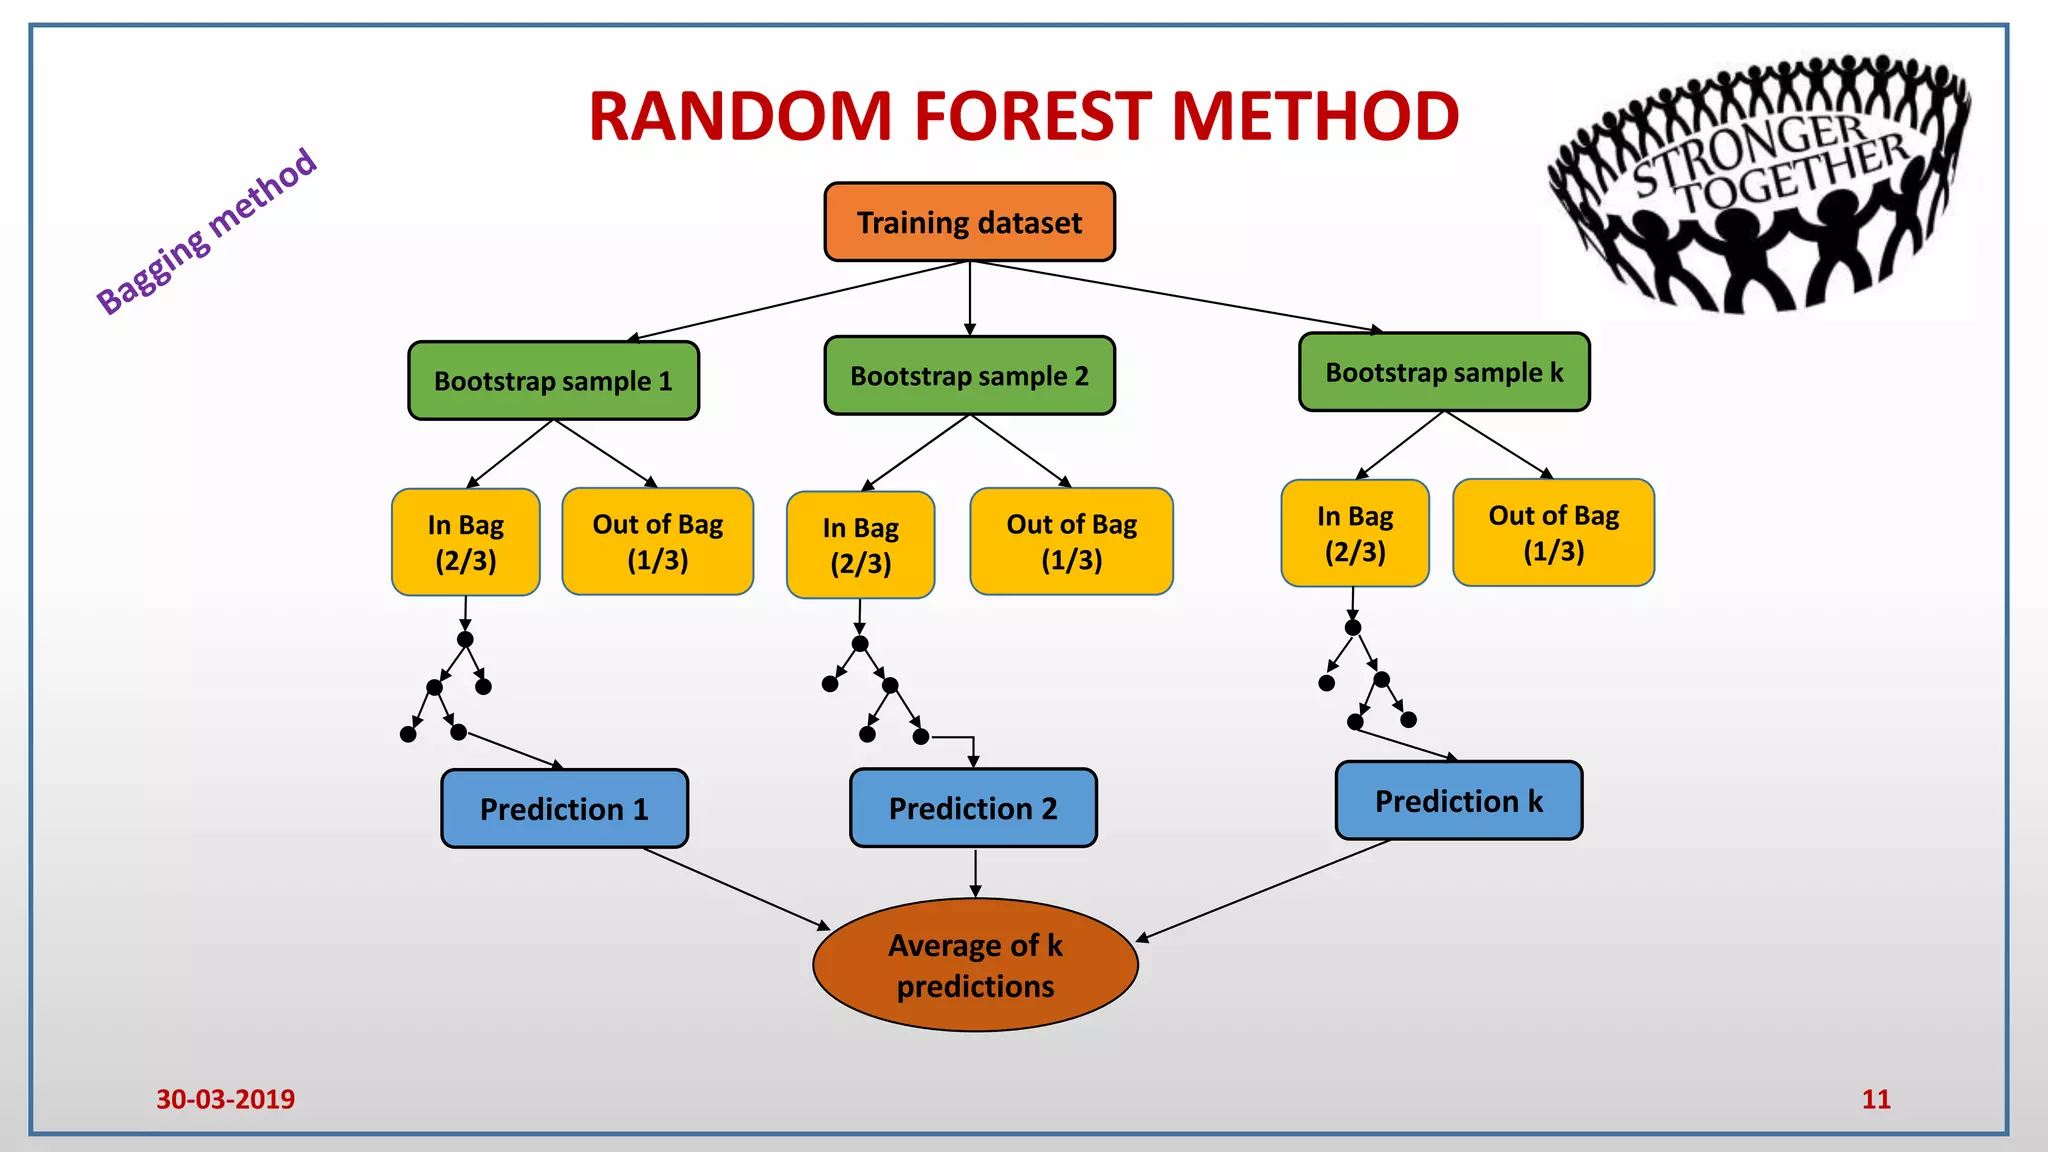
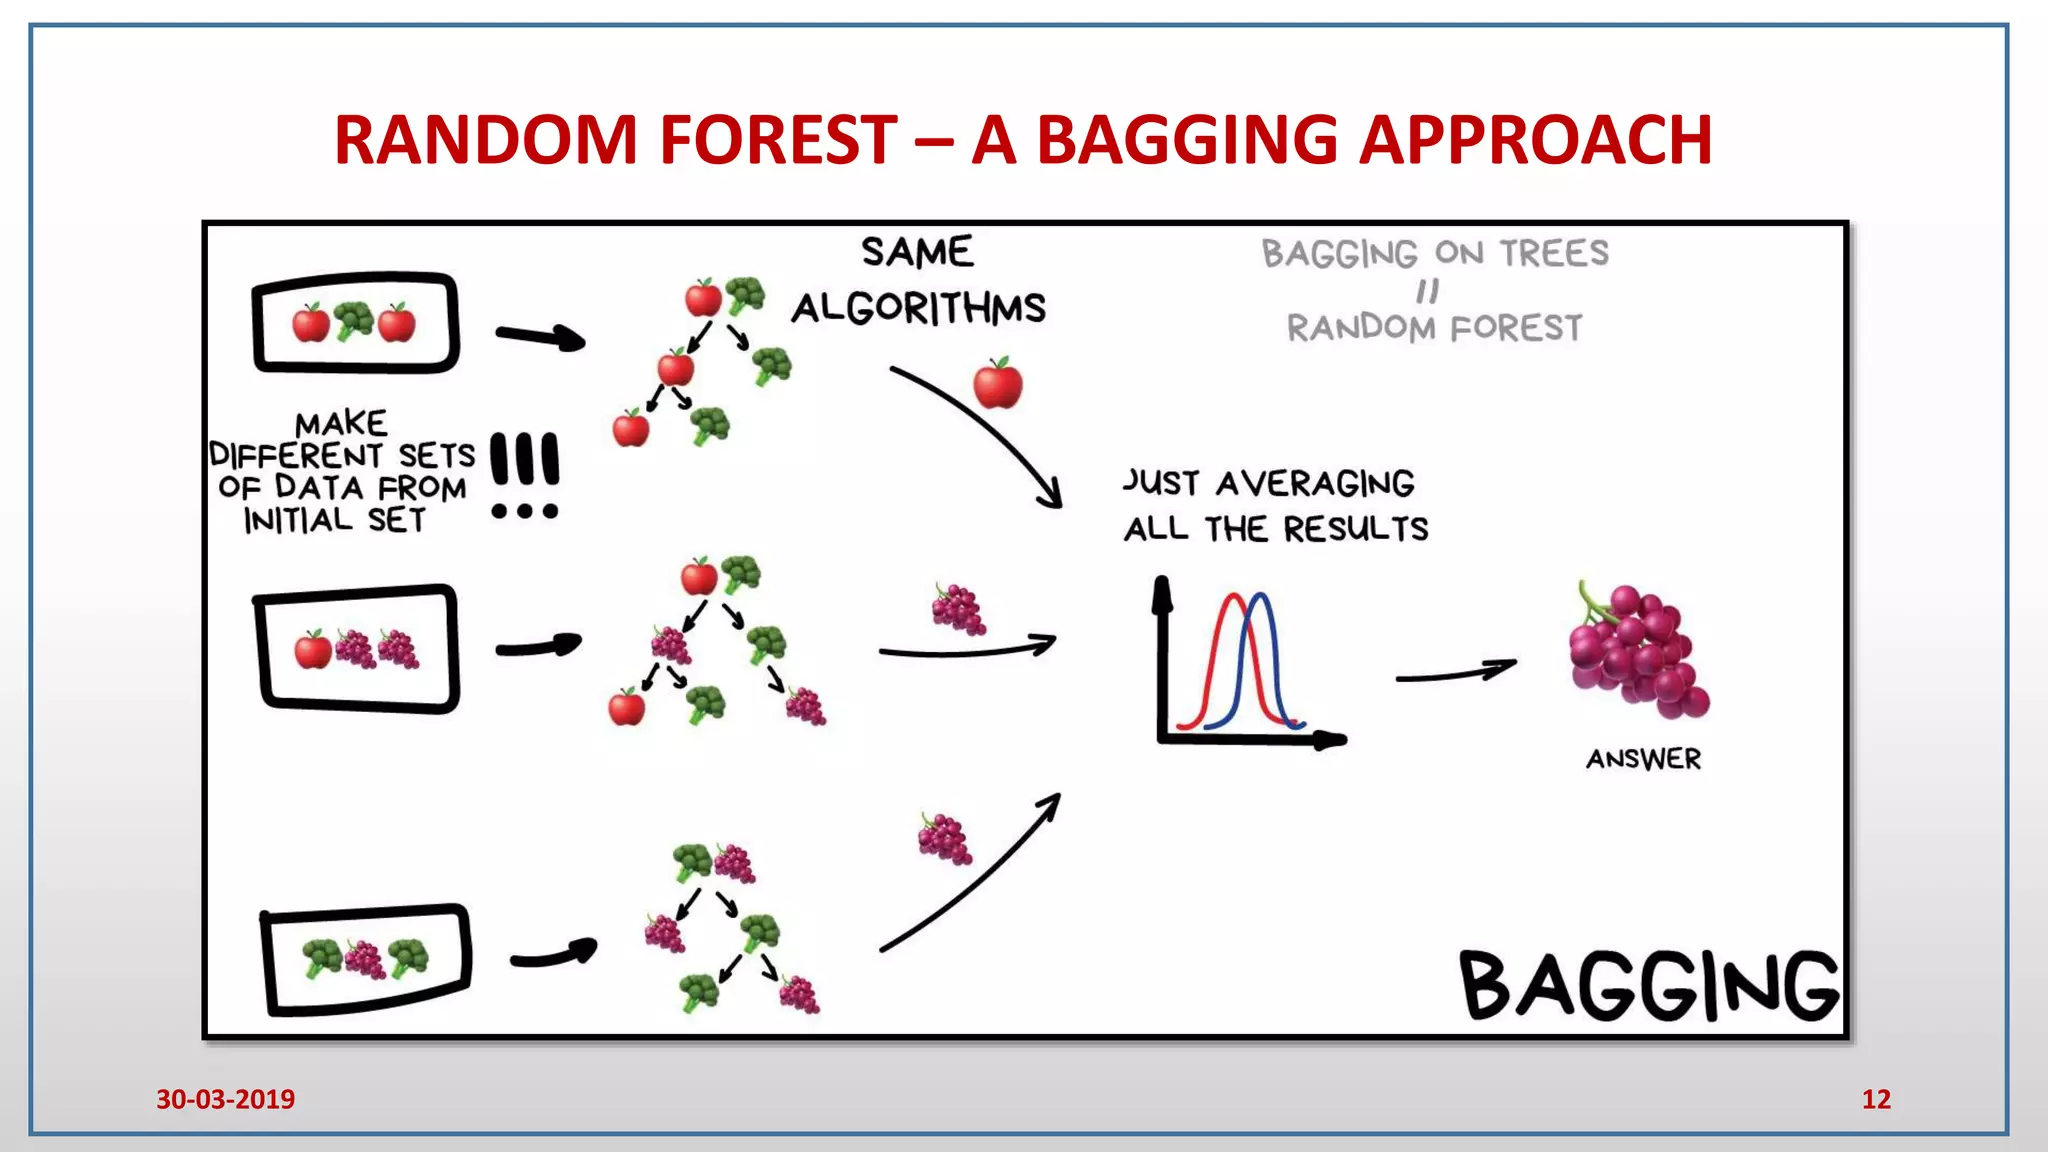
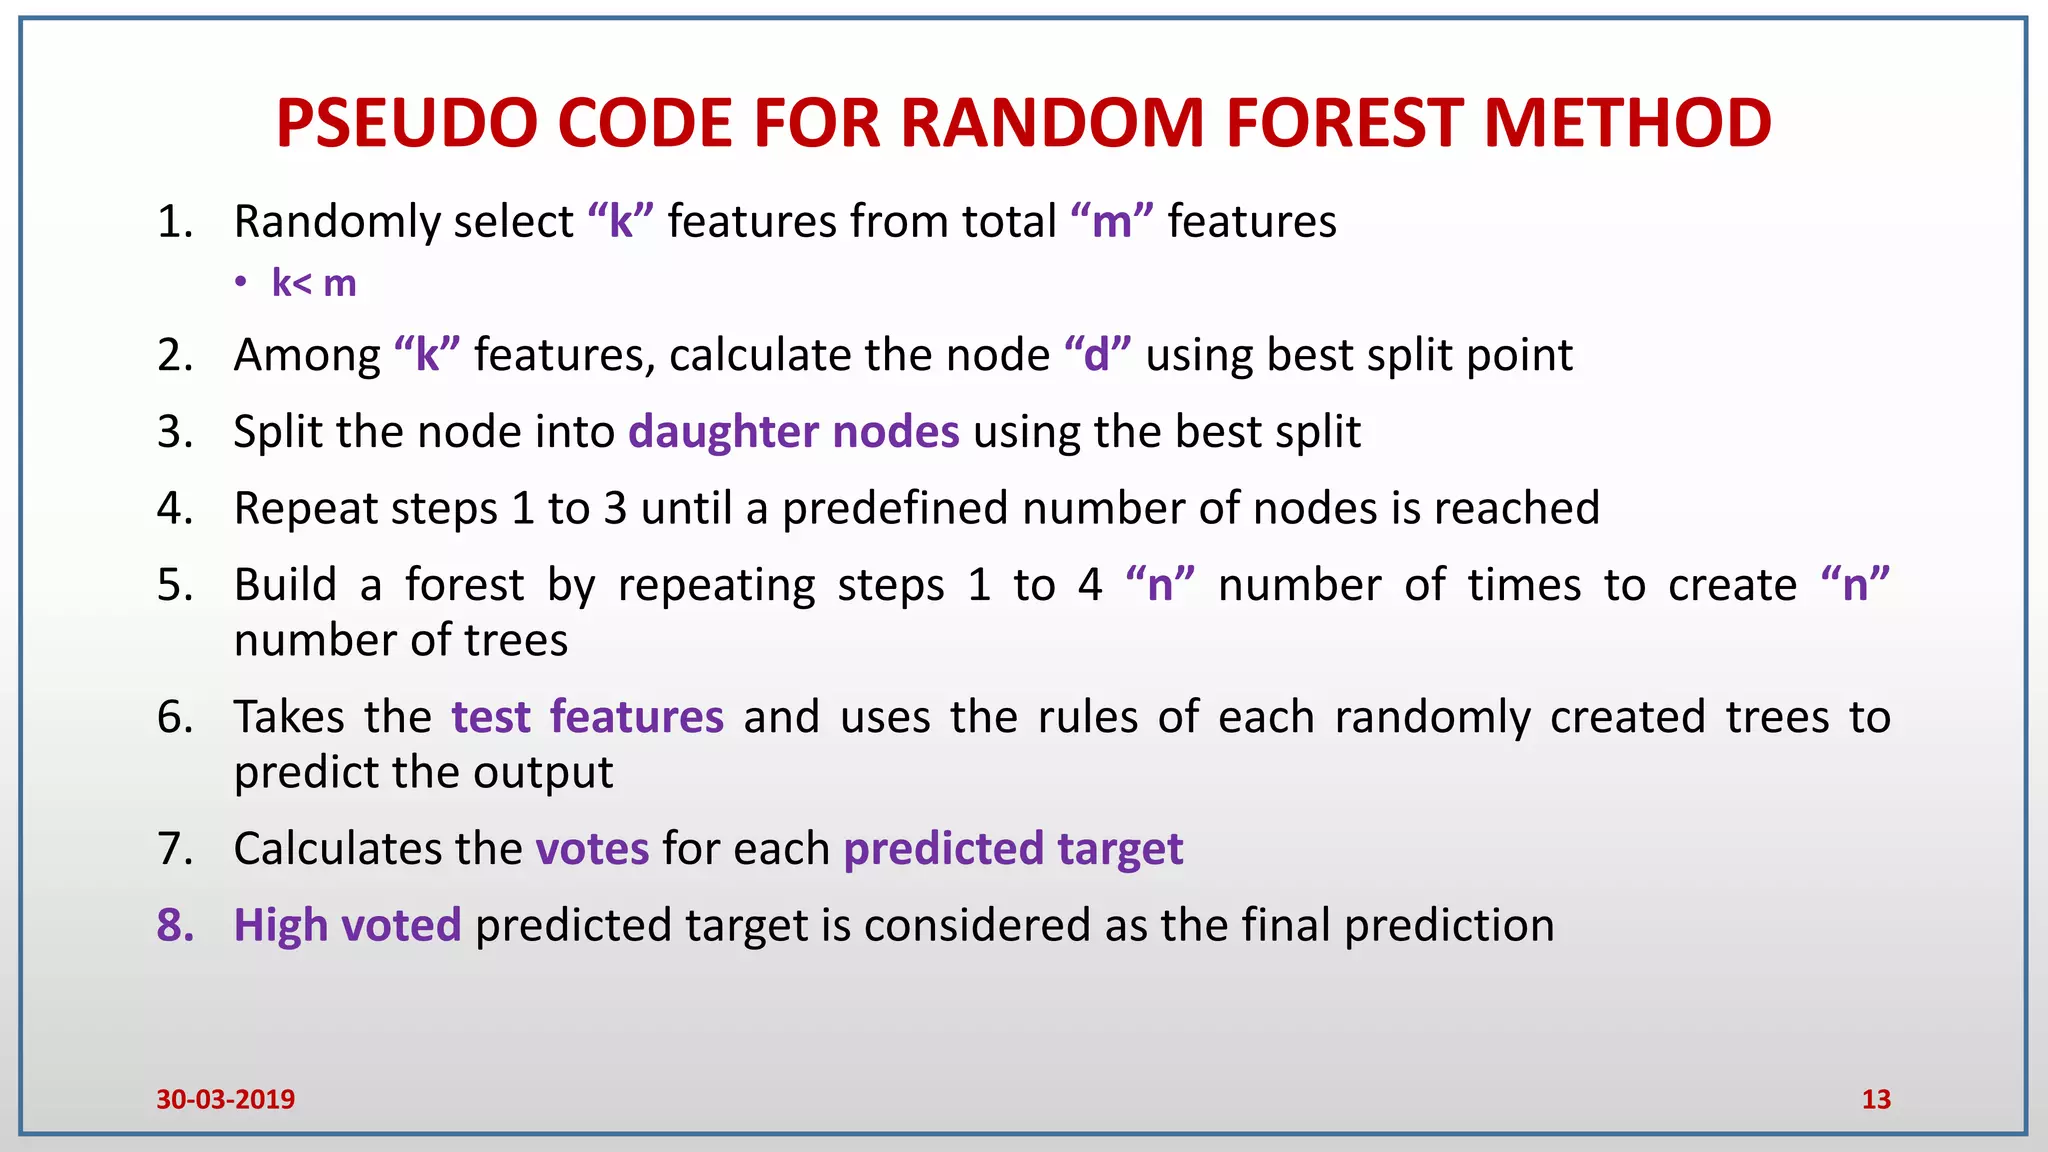
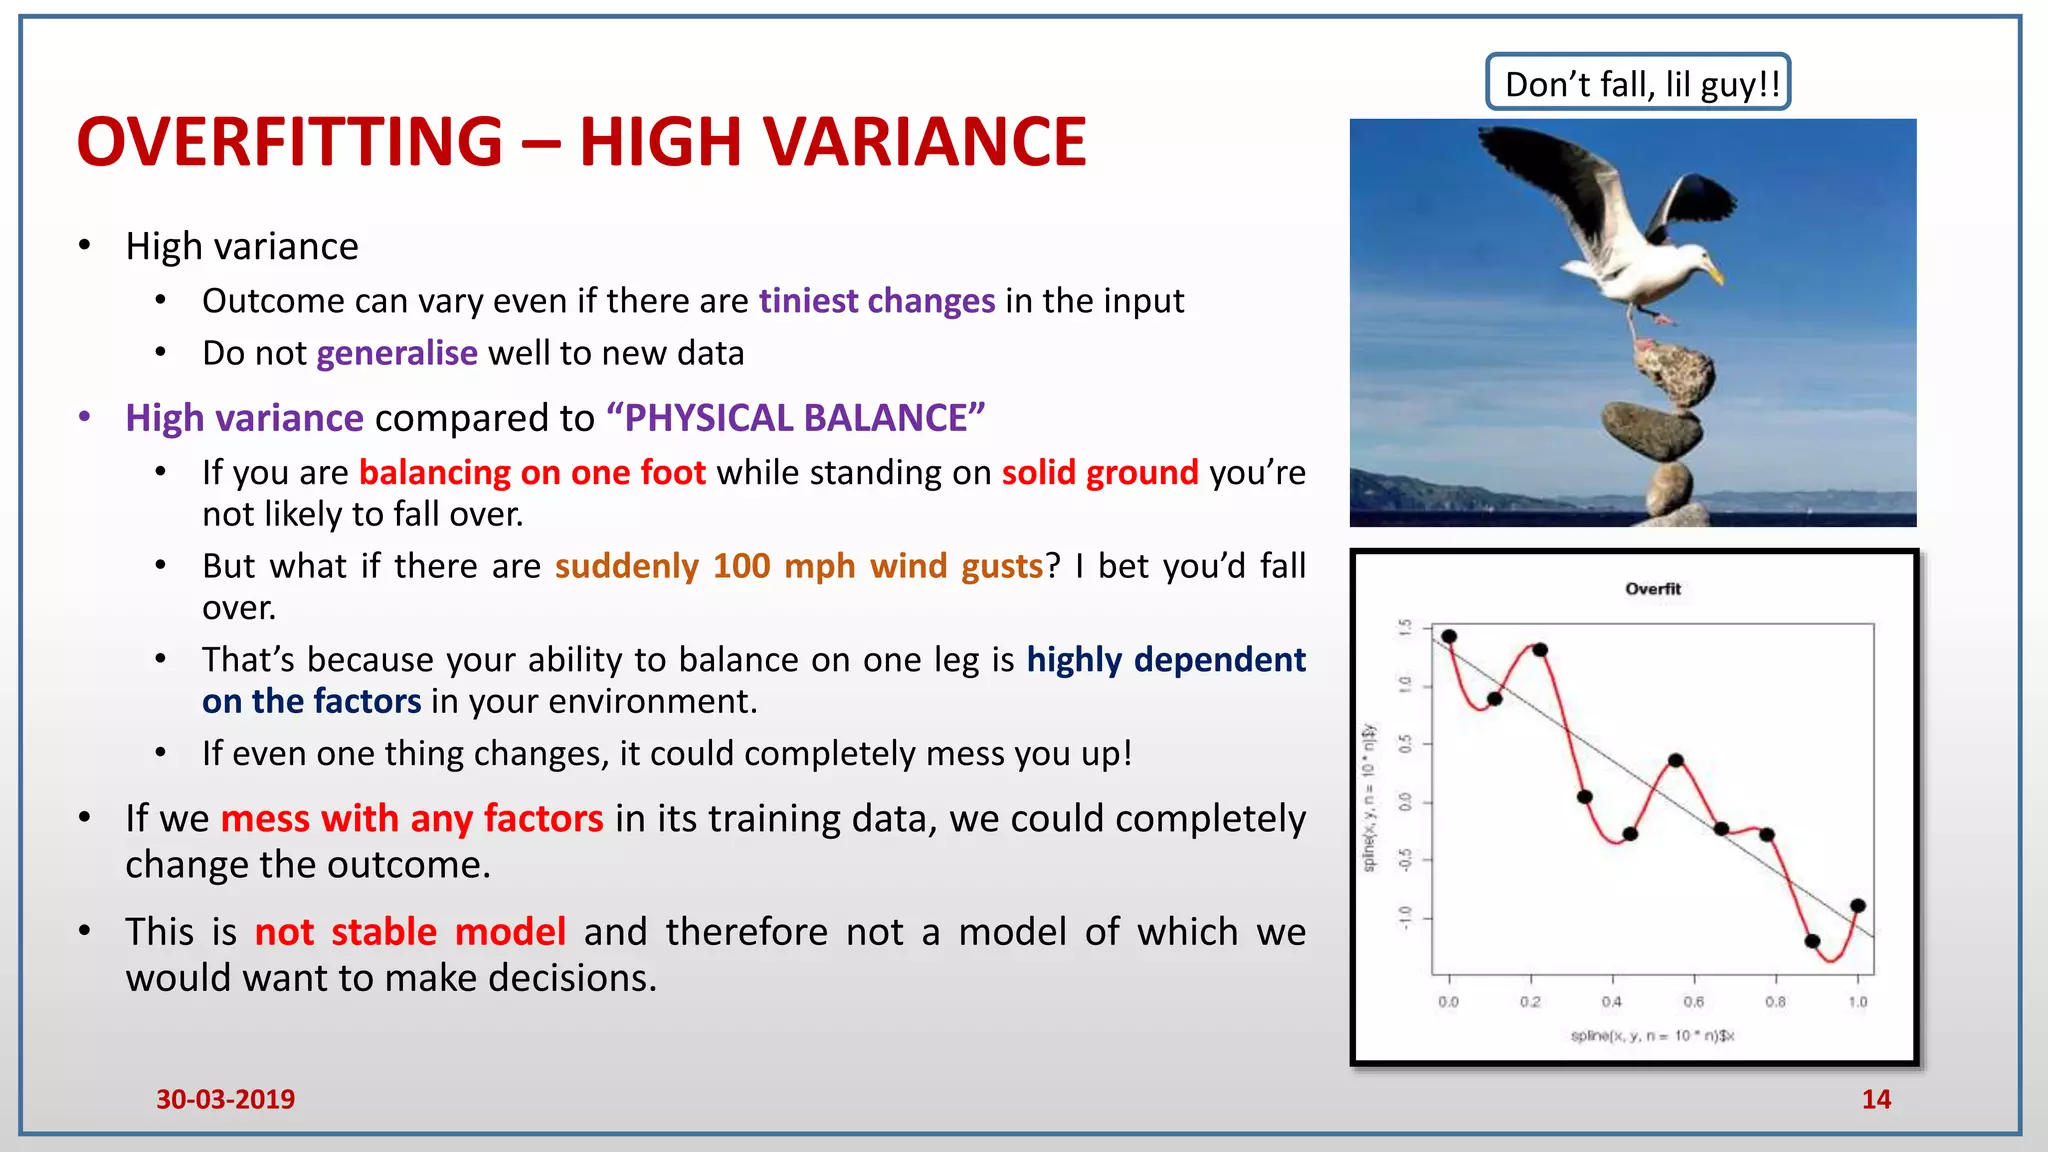

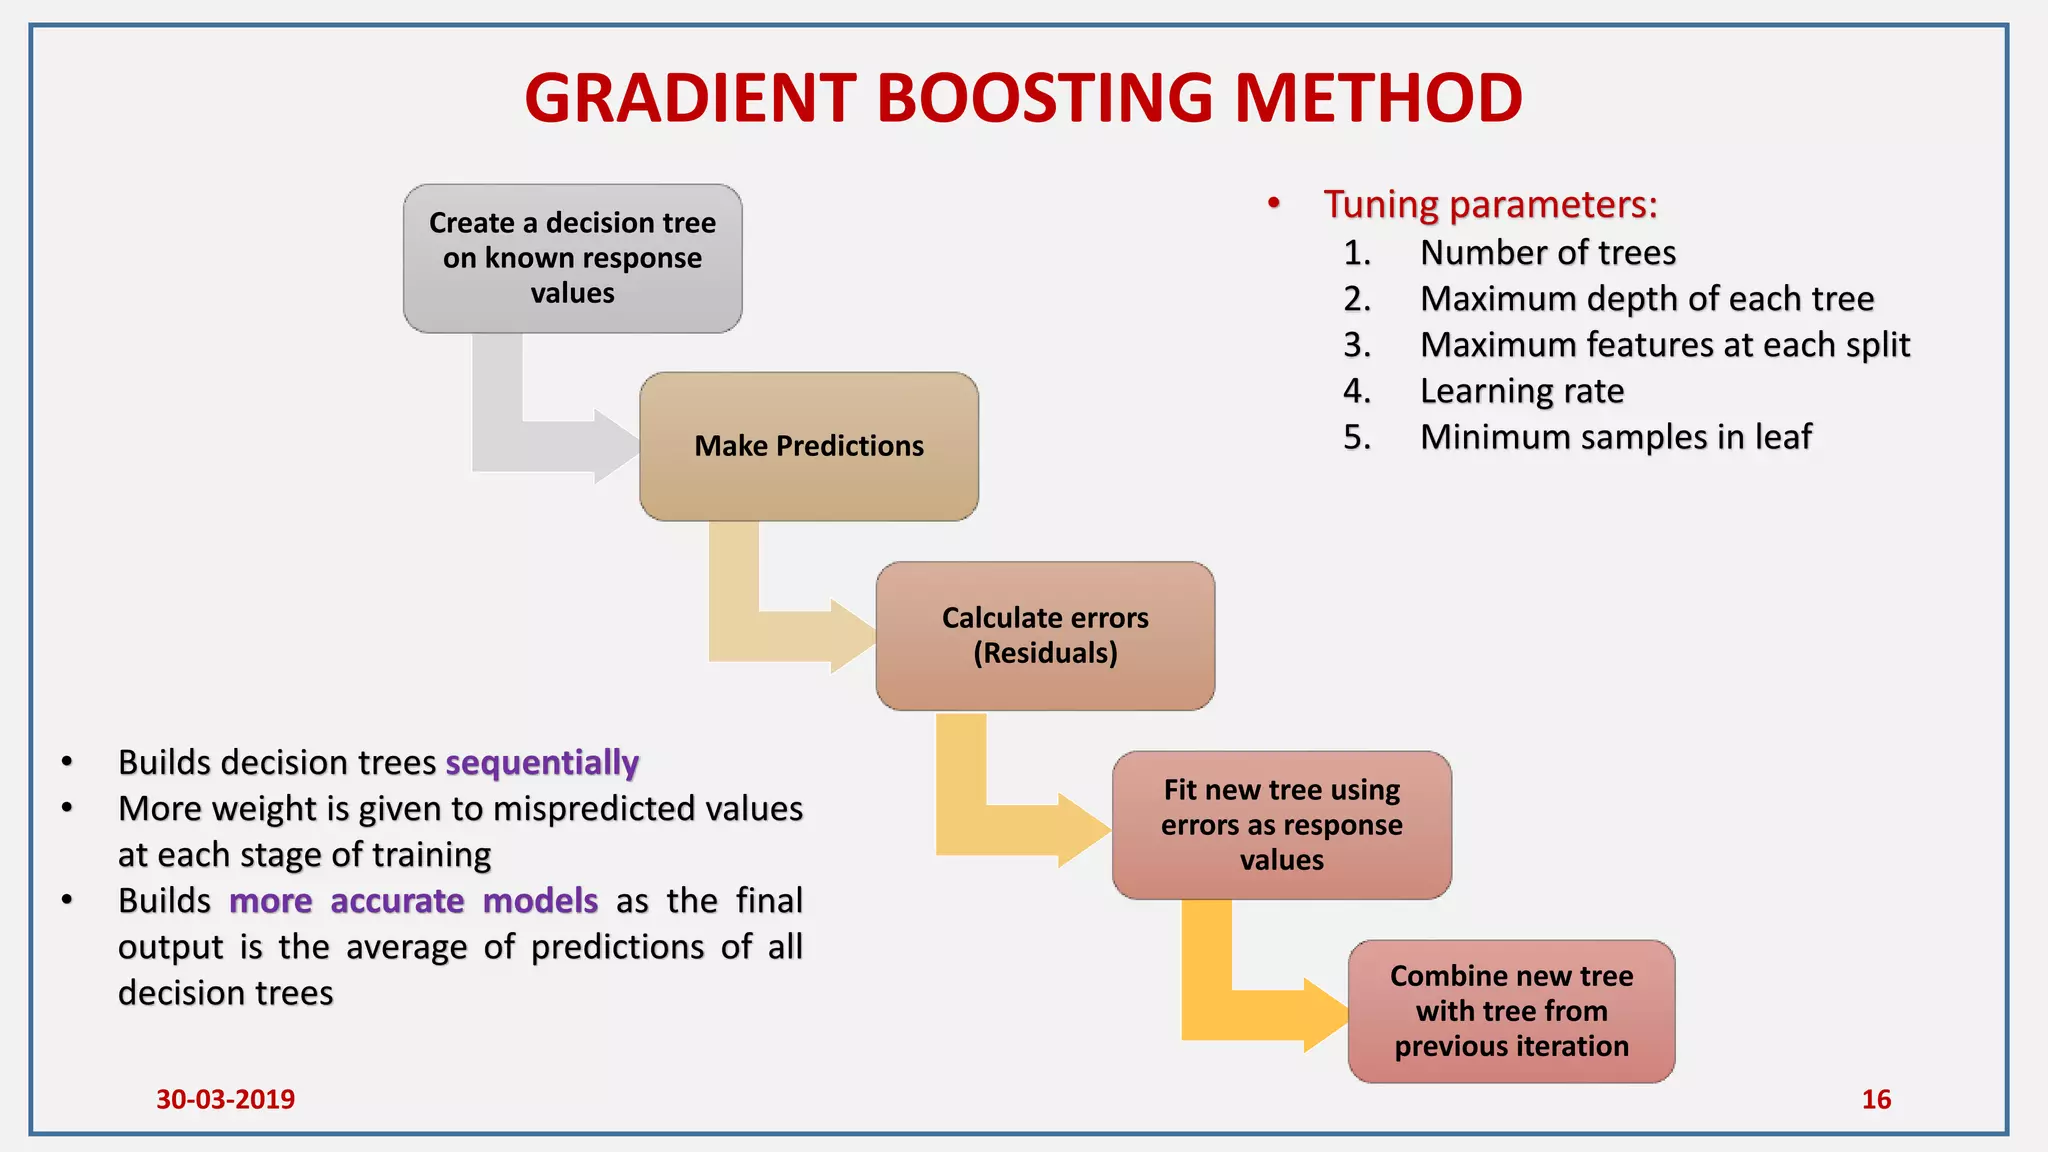

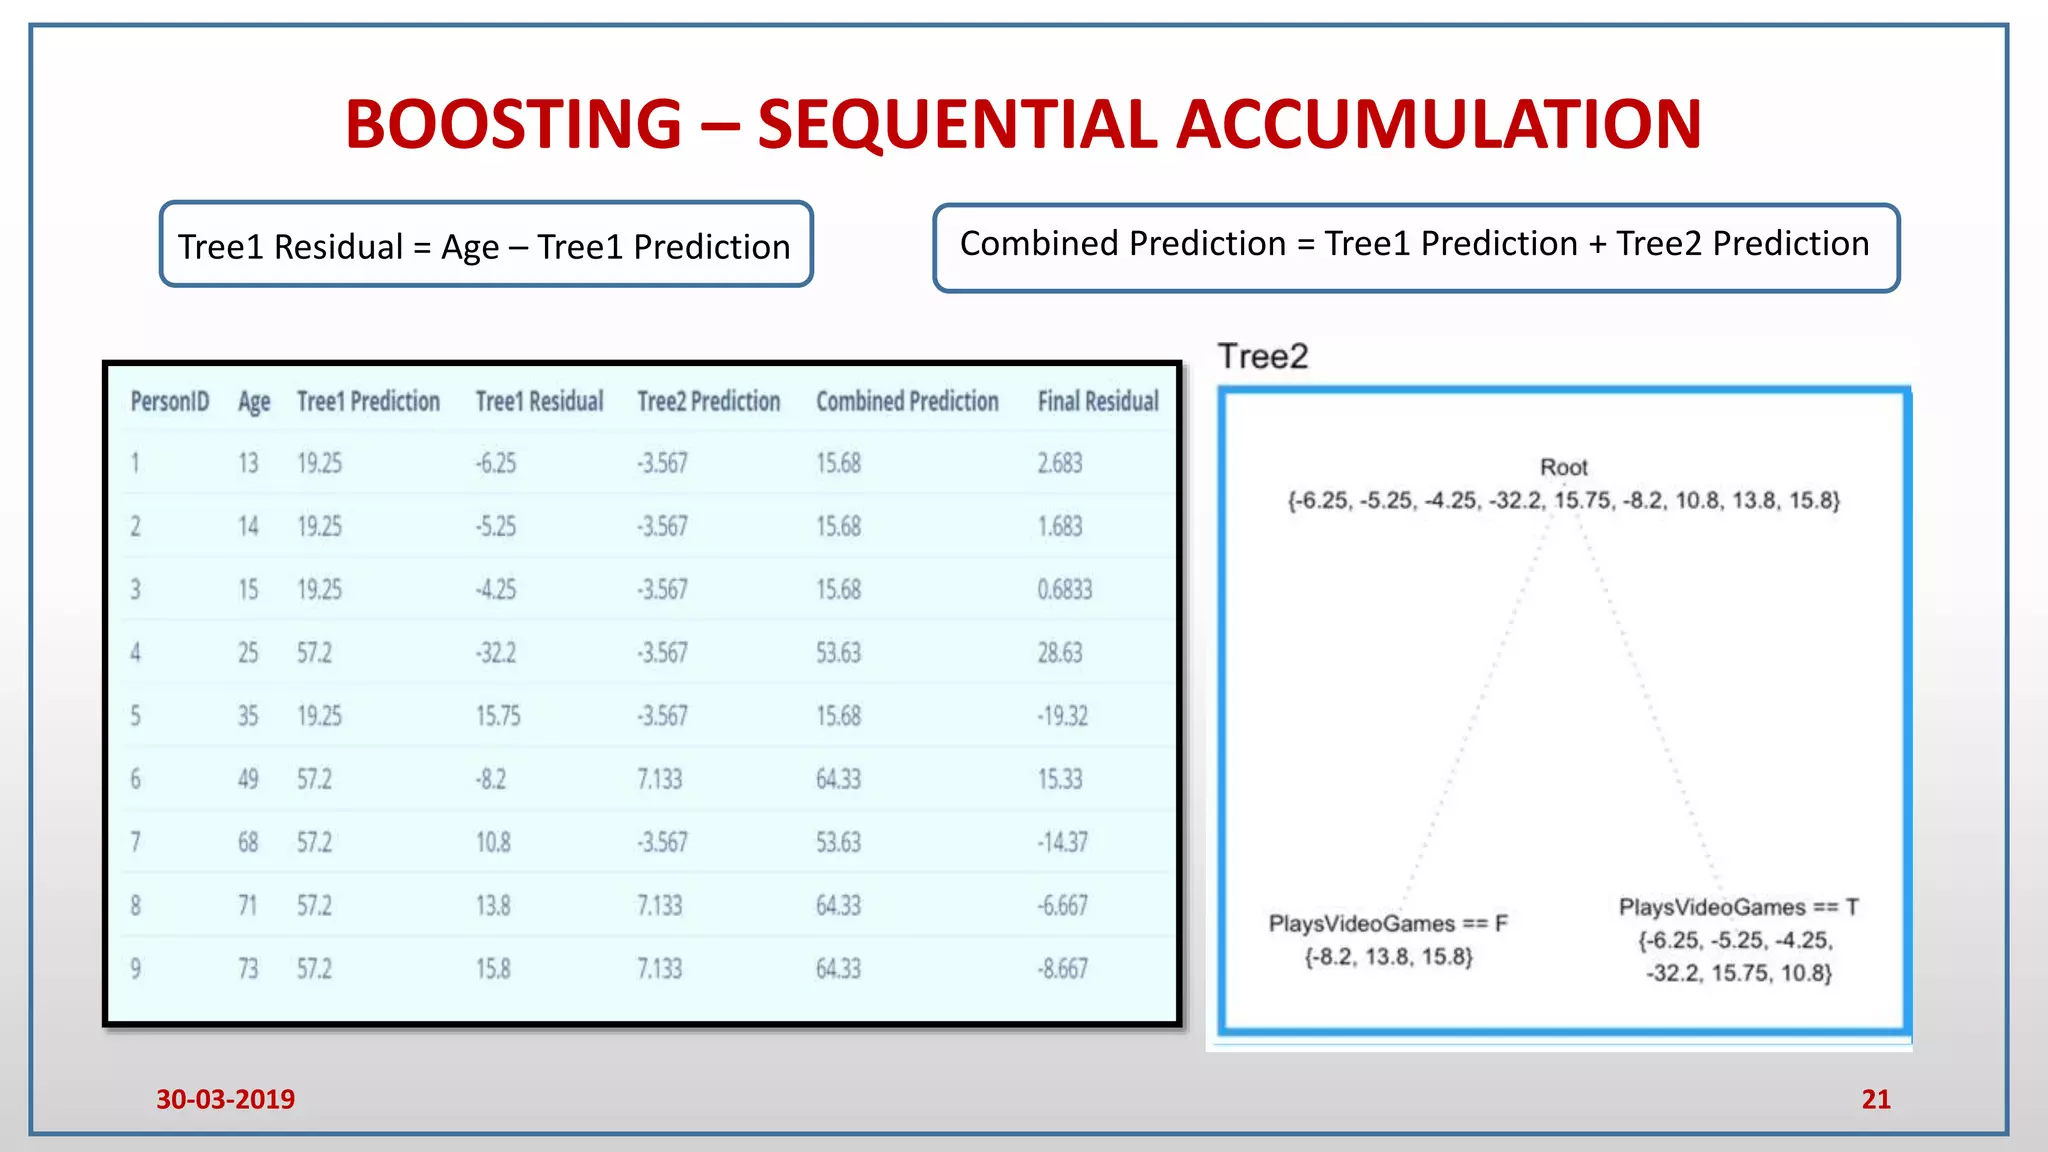

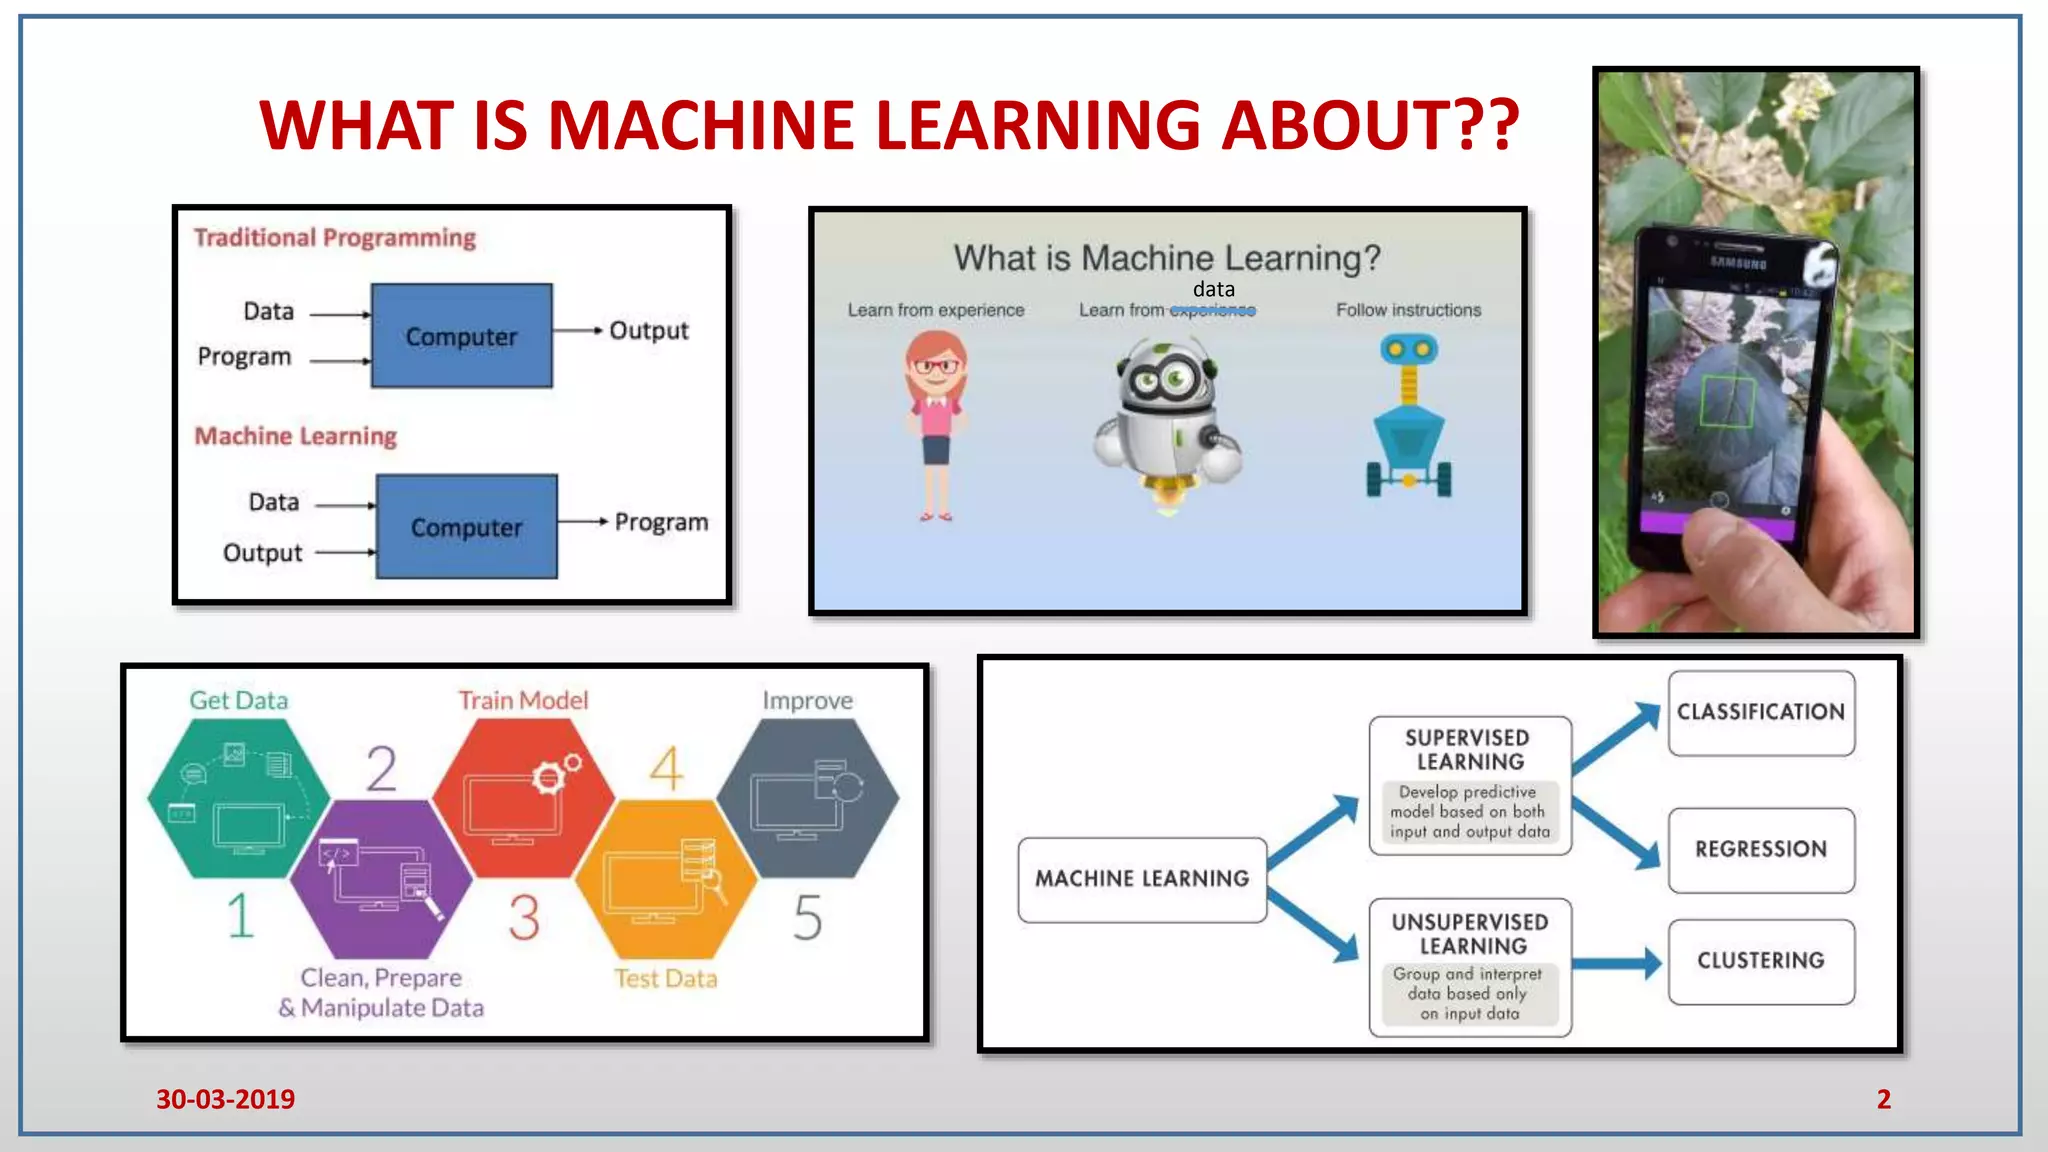
This document provides an introduction to random forest and gradient boosting methods, explaining the anatomy and functioning of decision trees, including their application in classification and regression tasks. It discusses the advantages and disadvantages of decision trees, the process of ensemble learning through bagging and boosting, and the practical applications of these methods in fields like banking and medicine. The document also details the pseudo code for both random forest and gradient boosting approaches.


![[DSC Europe 25] Uros Pesic - The Reality of AI in Marketing.pdf](https://cdn.slidesharecdn.com/ss_thumbnails/rtkodnmtycovsllvzsyn-9-251215095918-b0c6bfe3-thumbnail.jpg?width=640&height=640&fit=bounds)
![[DSC Europe 25] Danica Soc - The Science Behind Marketing: Experimentation me...](https://cdn.slidesharecdn.com/ss_thumbnails/c0nofsggs9gw5ucmallr-3-251216103155-56bd64d1-thumbnail.jpg?width=640&height=640&fit=bounds)


![[DSC Europe 25] Tatevik Maytesyan - How to actually use AI in marketing: gett...](https://cdn.slidesharecdn.com/ss_thumbnails/tjo626lsqdgfntbgl2mw-4-251216103155-e36cd239-thumbnail.jpg?width=640&height=640&fit=bounds)
![[DSC Europe 25] Jovan Bogicevic - Legacy to AI-Driven Defense: Transforming D...](https://cdn.slidesharecdn.com/ss_thumbnails/rsarluadt563hntyfc8q-3-251211083849-3e7bc4c0-thumbnail.jpg?width=640&height=640&fit=bounds)


![[DSC Europe 25] Dusan Nesic - Securing Tomorrow’s Infrastructure: Why Cyber-P...](https://cdn.slidesharecdn.com/ss_thumbnails/qikbszfftyowjm2q6duw-1-251211083848-8f2ead6b-thumbnail.jpg?width=640&height=640&fit=bounds)

![[DSC Europe 25] Dunja Adzic Jovanovic - AI and Cybersecurity: Defending Data ...](https://cdn.slidesharecdn.com/ss_thumbnails/o1zylpbhrtwnixxq2xj8-7-251211083048-185086f6-thumbnail.jpg?width=640&height=640&fit=bounds)


![[DSC Europe 25] Katherine Forrest - AI NOW: Understanding the Velocity of Cha...](https://cdn.slidesharecdn.com/ss_thumbnails/wvvbruqfrci0sfq9xwgb-4-251212104007-e5ad1987-thumbnail.jpg?width=640&height=640&fit=bounds)

![[DSC Europe 25] Hans Kleinsman - The Compliance Gearbox: How Tax Tech Mediate...](https://cdn.slidesharecdn.com/ss_thumbnails/dxdytie1toel0hr90bjs-2-251212103250-174fdbe7-thumbnail.jpg?width=640&height=640&fit=bounds)
![[DSC Europe 25] Jon Dajci - Bridging TradFi and DeFi: Building the Future of ...](https://cdn.slidesharecdn.com/ss_thumbnails/fqmhfvlbqhkihjvqvhmu-7-251211083849-6af7e325-thumbnail.jpg?width=640&height=640&fit=bounds)