1. Page 1 of 33
Magnitude and quality of cytokine and chemokine storm during acute infection1
distinguish non-progressive and progressive simian immunodeficiency virus2
infections of nonhuman primates3
4
5
Running title: Cytokine responses in acute SIV infection6
7
Sheila M. Keating,a,b,#
John W. Heitman,a
Shiquan Wu,a
Xutao Deng,a
Andrea R. Stacey,c1
8
Roland C. Zahn,d,2
Maurus de la Rosa,d,3
Samantha L. Finstad,d,4
Jeffrey D. Lifson,e
9
Michael Piatak, Jr.,e,5
Marie-Claire Gauduin,f
Benedikt M. Kessler,c,g
Nicola Ternette,c,g
10
Angela Carville,h,6
R. Paul Johnson,i,7
Ronald C. Desrosiers,j,8
Norman L. Letvin,d,5
11
Persephone Borrow,c
Philip J. Norrisa,b,k,%
, and Joern E. Schmitzd,9,%
12
13
a
Blood Systems Research Institute, San Francisco, CA, USA, Departments of b
Laboratory14
Medicine and k
Medicine, University of California, San Francisco, CA, USA;15
c
Nuffield Department of Clinical Medicine and g
Target Discovery Institute, University of16
Oxford, UK;17
d
Center for Virology and Vaccine Research, Beth Israel Deaconess Medical Center,18
Harvard University, Boston, MA, USA;19
e
AIDS and Cancer Virus Program, Leidos Biomedical Research, Inc., Frederick National20
Laboratory, Frederick, MD, USA;21
f
Texas Biomedical Research Institute, Department of Virology and Immunology22
and Southwest National Primate Research Center, San Antonio, Texas, USA;23
Departments of h
Primate Resources, i
Immunology and j
Microbiology, New England Primate24
Research Center, Southborough, MA, USA;25
26
1
Current address: Immunocore, Abingdon, UK27
2
Current address: Janssen Infectious Diseases and Vaccines, Leiden, The Netherlands28
3
Current address: Baxter Innovations GmbH, Wien, Austria29
4
Current address: National Institutes of Health, National Cancer Institute, Bethesda, USA30
5
deceased31
6
Current address: Biomedical Research Models, Worcester, USA32
7
Current address: Yerkes National Primate Research Center, Emory University, Atlanta,33
USA34
8
Current address: University of Miami Miller School of Medicine, Miami, USA35
9
Current address: Fraunhofer Institute for Molecular Biology and Applied Ecology IME,36
Aachen, Germany37
38
%
PJN and JES contributed equally to this work.39
40
#
Address correspondence to Sheila M. Keating, Blood Systems Research Institute, 27041
Masonic Avenue, San Francisco, CA 94127. Email: skeating@bloodsystems.org42
43
2. Page 2 of 33
Word count for abstract: 232; Word count for text: 513744
45
3. Page 3 of 33
ABSTRACT46
Acute HIV infection represents a period of intense immune perturbation and activation of47
the host immune system. Study of the eclipse and viral expansion phases of infection is48
difficult in humans, but studies in non-progressive and progressive nonhuman primate49
infection models can provide significant insight into critical events occurring during this50
time. Cytokines, chemokines and other soluble immune factors were measured in51
longitudinal samples from rhesus macaques infected with either SIVmac251 (progressive52
infection) or SIVmac239Δnef (attenuated / non-progressive infection), and from African53
green monkeys infected with SIVsab9315BR (non-pathogenic infection). Levels of acute-54
phase peak viral replication were highest in SIVmac251 infection, but correlated positively55
with viremia at 100 days post-infection in all three infection models. SIVmac251 infection56
was associated with stronger corresponding acute-phase cytokine/chemokine responses57
than the non-progressive infections. Production of IL-15, IL-18, IFN-γ, G-CSF, MCP-1,58
MIP-1β and SAA during acute SIVmac251 infection, but not SIVmac239Δnef or59
SIVsab9315BR infection, correlated positively with chronic viremia at 100 days post60
infection. Acute-phase production of MCP-1 correlated with day 100 viremia in both non-61
progressive infections. Finally, a positive correlation between the acute-phase area under62
the curve (AUC) IL-6 and sCD40L and chronic viremia was only observed in the non-63
progressive infections models. While we observed dynamic acute inflammatory immune64
responses in both progressive and non-progressive SIV infections, the responses in the65
non-progressive infections were not only lower in magnitude but also qualitatively different66
biomarkers of disease progression.67
68
69
4. Page 4 of 33
IMPORTANCE70
71
NHP models of HIV infection constitute a powerful tool to study viral pathogenesis to gain72
critical information for a better understanding of HIV infection in humans. Here, we studied73
progressive and non-progressive SIV infection models in both natural and non-natural host74
NHP species. Regardless of the pathogenicity of the virus infection or NHP species75
studied, the magnitude of viremia, as measured by area under the curve during the first 476
weeks of infection, positively correlated with viremia in chronic infection. The magnitude of77
cytokine and chemokine responses during primary infection also correlated positively with78
both acute-phase and chronic viremia. However, the pattern and levels of specific79
cytokines and chemokines produced differed between non-progressive and progressive80
SIV infection models. The qualitative differences in the early immune response in81
pathogenic and non-pathogenic infections identified here correlate with and may provide82
insights into the basis of differences in the subsequent course of disease.83
84
5. Page 5 of 33
INTRODUCTION85
86
Acute HIV infection lasts only for a few weeks, but the dynamics of virus/host87
interactions during this period can have lasting consequences through the course of88
infection (26, 43). Understanding the early immune responses, including the identity,89
kinetics, and magnitude of production of soluble mediators of inflammation, may shed light90
on how these early responses can impact subsequent course of the infection.91
Although the identification of infected humans during the eclipse period of HIV92
infection is extremely difficult (13), a study conducted on plasma donor panels effectively93
described the kinetics of systemic cytokine immune responses during the days to weeks94
following HIV transmission (39). Rapid elevations in cytokines including IFN-α and IL-1595
were reported prior to peak viremia in acute infection, while slightly slower, more sustained96
elevations were observed in other analytes including IL-6, IL-8, IL-18, and IFN-γ along with97
a later-peaking increase in IL-10. There was also a biphasic increase in acute phase98
proteins, including serum amyloid A (SAA), indicating an early response to infection99
followed by further acute-phase protein induction coinciding with production of pro-100
inflammatory cytokines TNF-α, IL-6 and IL-22 (20). While these studies give valuable101
insight into the chronology of immune induction during acute HIV infection, it is not known102
how these cytokine responses relate to the subsequent disease course as long term103
virologic and clinical follow up was not available for these individuals.104
The potential functional effects of cytokines on the immune system and HIV105
replication are complex. Many cytokines are pleiotropic and can even have opposing106
effects, simultaneously promoting suppression of virus replication and enabling virus107
6. Page 6 of 33
replication by immune activation (e.g., IL-15 or TNF-α). Only very few cytokine responses108
are thought to have an overall beneficial effect for the HIV-infected individual (reviewed in109
(18). Nonhuman primate (NHP) models of HIV infection enable study of the relationship110
between viral replication and cytokine responses under controlled experimental settings111
(12). These models include simian immunodeficiency virus (SIV) infection of Asian112
macaques that are non-natural hosts of SIV, such as SIVmac infection of Indian rhesus113
macaques (RM) and infection of species that are endemic natural hosts of SIVs, such as114
SIVagm infection of African green monkeys (AGM) (38). The course of experimental SIV115
infection is variable in RM and depends on the particular virus strain used for infection.116
Similar to untreated HIV infection in humans, experimental SIVmac251 infection of RM is117
highly pathogenic, resulting in a rapid increase in viremia followed by partial containment118
but ongoing viral replication. It is associated with pathological immune activation,119
progressive decline of CD4+
T cell populations and eventually there is a complete loss of120
viral containment with development of clinically apparent immunodeficiency manifested by121
AIDS defining conditions including opportunistic infections, wasting and death (22). In122
contrast, infections of RM with live attenuated viruses such as SIVmac239Δnef are123
generally much less pathogenic (11). Viremia is more efficiently contained resulting in a124
very low chronic phase viremia that is maintained either indefinitely or for prolonged125
periods of time. In contrast to SIV infections of non-natural hosts, SIV infections in natural126
NHP hosts such as SIVagm infection of AGM do not typically result in serious disease (38).127
Although chronic phase viral replication and viremia are only partially contained, the loss of128
CD4+
T cells is transient, immune activation is limited to primary infection, and progression129
to AIDS does not occur.130
7. Page 7 of 33
Progressive SIV infection in RM results in increased expression of markers for cell131
activation and proliferation along with sustained production of cytokines, including type I132
IFN (28, 36). Heightened T cell turnover occurs in response to viral infection and, in the133
presence of persistent pro-inflammatory cytokines, results in loss of memory T cells (30,134
33). A number of similarities between non-progressive and progressive SIV infections have135
been identified, including an initial type I IFN response accompanying the increase in acute136
viremia (30). However, natural hosts are able to down-modulate the virus-associated137
immune activation, including resolution of type I IFN up-regulation. Natural hosts are also138
able to maintain functional mucosal immunity including preservation of T regulatory and139
Th17 cells, maintenance of gut mucosal integrity with no increased microbial translocation,140
and limited systemic immune activation in chronic infection (31). A comparison of141
transcriptional profiles of non-progressive and progressive SIV infections has revealed142
differences in transcriptional kinetics in lymphoid tissues (21). The gene expression143
patterns in progressive infection exhibit a shift toward general Th1 immune responses with144
strong and sustained IFN type I and II responses, loss of T regulatory cells and loss of145
control of T cell activation (4, 10, 19). Although the magnitude of systemic immune146
activation at the time of acute infection is comparable between non-progressive and147
progressive SIV infections at the gene expression level, cytokine/chemokine protein levels148
have not been extensively tested (21).149
The ability to measure multiple protein analytes simultaneously and sensitively by150
cytokine bead multiplex assay has allowed a more comprehensive approach to the study of151
inflammatory mediators in acute viral infections (2, 16, 39). Cytokine multiplex assays have152
been developed using antibodies against human cytokines that were found to be cross-153
8. Page 8 of 33
reactive against NHP analytes. Here, we investigated the magnitude of changes in plasma154
levels of 25 analytes following progressive infection of RM with SIVmac251 and non-155
progressive infections of RM with SIVmac239Δnef and AGM with SIVsab9315BR. Our156
analysis reveals differences in acute phase levels of several cytokines in non-progressive157
and progressive SIV infections and shows which patterns of cytokine production in acute158
infection correlate with chronic phase viremia.159
160
9. Page 9 of 33
MATERIALS AND METHODS161
162
Animals and Viruses163
A total of 19 sabaeus AGM (Chlorocebus sabaeus) were studied for baseline164
cytokine/chemokine levels. The animals were either imported from St. Kitts in the165
Caribbean or were purchased from the New Iberia Research Center, Louisiana. Six of166
these sabaeus AGM were studied after infection with an equivalent of 143ng p27 tissue167
culture supernatant of Molt4(cl8) cells infected with SIVsab9315BR. Cell-free virus was168
originally isolated from cerebrospinal fluid (CSF) and homogenized brain and LN tissues of169
AGM 9315 at the time of necropsy(7). All AGM were maintained in accordance with the170
guidelines of the Committee on the Care and Use of Laboratory Animals under an NIAID-171
approved animal study protocol, and all studies and procedures were reviewed and172
approved by the Institutional Animal Care and Use Committees of the NIH and Harvard173
University. The 6 SIVsab9315BR-infected AGM were part of the control group for a study to174
compare B and T cell depletion during acute infection (44). These animals received175
intravenous 50 mg/kg IgG (Gammaguard®, provided as IgIV; NIH Nonhuman Primate176
Reagent Resource) one week prior to infection. The AGM infected with SIVsab9315BR177
were bled prior to infection and at multiple time points throughout the course of acute and178
chronic infection.179
A total of 74 RM were studied for baseline cytokine and chemokine calculations. Ten180
RM were infected with SIVmac251 by i.v. route at a dose equivalent of 0.15 ng SIV p27181
Gag per RM. Ten additional RM were infected with SIVmac239Δnef by i.v. route at a dose182
equivalent of 50 ng SIV p27 Gag per animal. The infected RM were bled prior to infection183
10. Page 10 of 33
and at multiple time points throughout the course of acute and chronic infection. All184
SIVmac251- and SIVmac239Δnef-infected RM animals received monoclonal IV IgG prior to185
infection (50 mg human immunoglobulin IgIV; NIH Nonhuman Primate Reagent Resource),186
as these animals were part of control groups in experimental studies (J.E. Schmitz;187
unpublished observations). All RM were maintained in accordance with the guidance of the188
Standing Committee on Animals for the Harvard Medical School and the Guide for the Care189
and Use of Laboratory Animals (1). Although the SIVmac239Δnef-infected RM involved in190
this study were maintained with standard research and veterinary practices, additional191
aspects of the SIVmac239Δnef-experiment that are not pertinent for this manuscript were192
not included in the protocol and, thus, were not contemporaneously approved by the HMS193
IACUC. When the investigators and the IACUC realized this protocol error, the IACUC194
determined that the unapproved procedures in question in all likelihood would have been195
approved if they had been described in the protocol.196
197
Cell Stimulation198
Peripheral blood mononuclear cells (PBMC) from HIV-negative humans (n=8), SIV-199
negative RM (n=11) and AGM (n=6) were cultured in RPMI with 10% FCS alone or with200
phytohemagglutinin M (Sigma, Atlanta, GA) (PHA-M, 5μg/mL), lipopolysaccharide (Sigma)201
(LPS, 1ng/mL), phorbol 12-myristate 13-acetate (Sigma) (PMA, 10ng/mL)/Ionomycin202
(Sigma) (calcium ionophore; 1μg/mL) or the imidazoquinoline TLR7/8 agonist CLO-97203
(Invitrogen, San Diego, CA) (2.5 μg/mL). The supernatants from unstimulated, PHA-M,204
LPS, and PMA/Ionomycin stimulated cells were harvested after 24 hours of incubation, and205
CLO-97 stimulated cells after 18 hours. The human samples were collected with informed206
11. Page 11 of 33
consent under a protocol approved by the University of California, San Francisco (UCSF)207
Committee on Human Research.208
209
Determination of plasma virus levels210
Plasma virus levels of SIVmac251 and SIVmac239Δnef were determined by a real-time211
reverse transcription-PCR assay, essentially as described previously (Quantitative212
Molecular Diagnostic Section, AIDS Vaccine Program, NCI-Frederick, Frederick, MD; limit213
of detection as used in the present studies, 60 RNA copies/ml) (9). SIVsab9315BR plasma214
RNA levels in sabaeus AGM were quantified by the Ultrasense One-Step Quantitative RT-215
PCR System (Invitrogen Corp., Carlsbad, CA), as described previously (44).216
217
Cytokine/chemokine Analysis218
Twenty-three cytokines/chemokines were measured using the nonhuman primate cytokine219
Milliplex kit (Millipore, Billerica, MA) according to the manufacturer's instructions. This panel220
measured IL-1β, IL-1 receptor antagonist (ra), IL-2, IL-4, IL-5, IL-6, IL-8, IL-10, IL-12/23221
(p40), IL-13, IL-15, IL-17, IL-18, IFN-γ, G-CSF, GM-CSF, MCP-1, MIP-1α, MIP-1β, TNF-α,222
TGF-α, sCD40L, and VEGF. The analyte detection ranged from 0.64 to 10,000 pg/mL.223
Plasma or PBMC supernatant was incubated overnight with antibody-coupled beads224
followed by incubation with biotinylated detection antibody, and finally, incubation with225
streptavidin-PE. Each sample was assayed in duplicate, and cytokine standards and226
controls supplied by the manufacturer were run on each plate. Multi-analyte profiling was227
performed using a Luminex-100 system; data were analyzed using Bio-Plex manager228
software (Bio-Rad, Hercules, CA). Analytes determined to be out of range below the229
12. Page 12 of 33
standard by Bio-Plex were assigned values of half the difference between the lowest230
standard and zero. Human IFN-α was measured by ELISA (PBL Interferon Source, New231
Jersey). Levels of SAA were measured using a colorimetric ELISA (Multispecies SAA232
ELISA kit, Tridelta Development Ltd., County Kildare, Ireland). Diluted plasma samples233
were assayed in duplicate; concentrations were calculated from the standard curve234
obtained with a mixture of standards from different species such as bovine, porcine,235
canine, feline and equine provided with the kit.236
237
Statistical Analysis238
In the validation experiment, supernatants from PBMC that were stimulated in culture were239
compared for differences in analyte levels by Kruskal Wallis ANOVA with Dunn’s multiple240
comparison tests. Increased expression of cytokines/chemokines after infection was241
identified by establishing a threshold of reactivity. To determine this threshold, baseline242
plasma levels of all analytes were measured in uninfected animals; the upper 95%243
confidence limit of the mean analyte value for uninfected animals was determined. This244
criterion, in addition to two-fold baseline value and greater than 5 pg/mL, were used to245
establish the threshold of response. In the overall cytokine/chemokine analysis, only246
analytes that were elevated in 50% or more animals per group were considered positive for247
the group. In individual cytokine/chemokine analyses, comparisons were made between248
analyte and viremia for each animal. Analyte levels were compared between two groups by249
Mann-Whitney test or between multiple groups by one-way ANOVA followed by Tukey250
Honestly Significant Differences (HSD). Linear regression was performed by Spearman251
test to compare peak plasma viremia or area under the curve (AUC) for the first 4 weeks252
13. Page 13 of 33
with chronic day 98 or 100 viremia (grouped as day 100). Linear regression by Spearman253
test was also performed to compare analyte (AUC or peak) concentration over the first four254
weeks with viremia in chronic infection. Throughout analyses, P-values were computed and255
then adjusted into FDR (False Discovery Rates) by the Benjamini and Hochberg controlling256
procedure (3). Statistical significance was indicated by P value <0.05 and FDR <0.1. The257
statistical software R/Bioconductor (Version 2.15.1 with gdata, gee, ggplot2, grid, lattice,258
lme4, multtest, npmc, outliers, pwr, stats) and GraphPad Prism version 6.0 were utilized for259
analyses.260
261
262
263
14. Page 14 of 33
RESULTS264
265
Recognition of RM and AGM analytes by cytokine/chemokine assays266
To evaluate the consistency of recognition of each analyte across primate species in the267
assays, we first validated the assays. As gold standard primate-specific cytokines are268
currently not available, we performed an in-house validation of the assays using269
supernatants from human and NHP PBMC stimulated in vitro with compounds that elicit a270
broad spectrum of cytokines/chemokines. We assessed the ability of the Millipore 23-plex271
NHP cytokine panel and a human IFN-α ELISA to recognize RM and AGM cytokines and272
chemokines. Assay validation using supernatants from two PBMC samples from each of273
seven different primate species stimulated with LPS and PHA-M to signal through TLR-4274
and CD3, respectively, had been previously performed by Millipore according to the user275
guide provided for this assay. The current validation expanded on the prior work and276
included the additional stimulants PMA/Ionomycin and CLO-97 to stimulate via protein277
kinase C and TLR-7/8, respectively, to maximize the diversity of cytokines/chemokines278
produced. The Milliplex NHP panel identified elevations in every analyte in response to at279
least one of the stimuli employed in the supernatants from human PBMCs; for the vast280
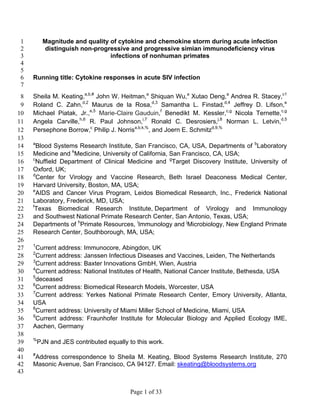
majority of the analytes this was also the case in both RM and AGM (Table 1). The heat281
map summarizes the responses across the primate species and the stimulants (Figure 1).282
Although the Luminex and ELISA assays were able to detect most cytokines and283
chemokines in the panel in both NHP species and humans, in vitro stimulation of PBMC did284
not lead to detection of a significant increase over the unstimulated controls in levels of285
some analytes in one or both of the NHP species. Measurements of IL-10, IL-15, MCP-1,286
15. Page 15 of 33
and TGF-α in supernatants from in vitro activated PBMC from AGM did not show any287
significant increase. In RM, all chemokines/cytokines except for IL-15 (Luminex) and IFN-α288
(ELISA) rose significantly after in vitro stimulation of PBMC compared to unstimulated289
controls, although lack of statistically significant differences from baseline was due to only290
two samples being available for testing. Failure to detect elevations in a particular analyte291
in this experiment may indicate that the analyte was not detected by the assay; but could292
also indicate that the analyte was not produced after in vitro PBMC stimulation in the293
species concerned. Notably, some of the analytes in which elevations were not detected294
following in vitro stimulation of PBMCs were subsequently detected in NHP plasma295
samples, showing that the assay was able to detect them, but suggesting that they were296
not substantially up-regulated after in vitro stimulation; this was observed for MCP-1, IL-10297
and IL-15, possibly due to the fact that the in vitro stimulation conditions selected did not298
reflect in vivo immune induction. As the majority of cytokines and chemokines examined299
were detected in both RM and AGM, we included all analytes in our subsequent analysis.300
SAA was not evaluated in the validation experiments. To minimize species related variation301
in the detection of SAA levels, a multi-species based ELISA assay was used in which the302
data were normalized against a standard mixture containing SAA derived from multiple303
species.304
305
Comparison of viral dynamics in SIVmac251- and SIVmac239Δnef-infected RM and306
SIVsab9315BR-infected AGM307
Previous investigations have shown a significant correlation between magnitude of peak308
viremia and day 100 post-infection viremia of SIVmac251-infected RM (40); similarly, our309
16. Page 16 of 33
data also indicated a significant correlation (P=0.03). Notably, we observed that the first 4-310
week AUC viremia and day 100 post-infection in SIVmac251-infected RM were significantly311
correlated (P = 0.03; Figure 2A and B). A comparison of RM infected with SIVmac251 to312
RM infected with SIVmac239Δnef or SIVsab9315BR-infected AGM revealed a similar313
dynamic response with peak viremia at 2 weeks followed by a steady decline to a setpoint314
viremia in the non-progressive infections, although both non-progressive infections were315
characterized by somewhat lower median peak and day 100 post-infection viremia than the316
pathogenic infection (Figure 2A). Despite the non-pathogenic nature of SIVsab9315BR in317
AGM, a significant correlation was observed between the first 4-week AUC and day 100318
post-infection viremia in SIVsab9315BR-infected AGM (P=0.03; Figure 2A and B). In319
contrast to the other two infections, there was not a significant correlation between the first320
4-week AUC and day 100 post-infection viremia in SIVmac239Δnef infected RM, but321
potentially a trend for a positive correlation (P=0.16; Figure 2A and B).322
323
Elevations in plasma levels of more cytokines and chemokines are detected after324
progressive SIV infection325
To determine the baseline plasma levels of our cytokine/chemokine, we measured plasma326
analyte levels in 74 RM and 19 AGM that were all SIV negative. Elevations in each analyte327
above the species baseline were then evaluated over time in each infection model. Of the328
25 analytes tested, 19, 5 and 13 analytes were elevated in SIVmac251-infected RM,329
SIVmac239Δnef-infected RM, and SIVsab9315BR-infected AGM at any time point,330
respectively. More analytes showed detectable elevations in SIVmac251-infected RM331
compared to SIVmac239Δnef-infected RM or SIVsab9315BR-infected AGM (Table 2,332
17. Page 17 of 33
P<0.0001 and P=0.004, respectively). The cytokines and chemokines exhibiting an333
elevation in each animal model at serial time points after infection are shown in Figure 3.334
Of note, the analytes that were elevated in both SIVmac251- and SIVsab9315BR-infected335
animals were G-CSF, IFN-γ, IL-1β, IL-1ra, IL-6, IL-8, IL-10, IL-15, MCP-1, MIP-1α, sCD40L336
and IFN-α. GM-CSF, IL-8, IL-15, MCP-1 and sCD40L were elevated in SIVmac239Δnef337
infection and IL-2, MIP-1β, TNF-α, VEGF, and IL-18 were uniquely recognized in338
SIVmac251 while IL-5 was only recognized in SIVsab9315BR infection.339
340
Many cytokines were not elevated in acute SIV infection341
A number of analytes never crossed the threshold used to define a positive response342
during the course of acute infection. If fewer than 50% animals exhibited a positive343
response for a given analyte, up-regulation of that analyte was determined to be negative344
for the group. Increases were not detected for 6 of 25 analytes (IL-4, IL-5, IL-12, IL-13, IL-345
17, and TGF-α) following SIVmac251 infection of RM, 20 of 25 analytes (G-CSF, IFN-γ, IL-346
1β, IL-1ra, IL-2, IL-4, IL-5, IL-6, IL-10, IL-12, IL-13, IL-17, MIP-1β, MIP-1α, TGF-α, TNF-α,347
VEGF, IL-18, IFN-α, and SAA) following SIVmac239Δnef infection of RM, and 11 of 25348
analytes (GM-CSF, IL-2, IL-4, IL-12, IL-13, IL-17, MIP-1β, TGF-α, TNF-α, VEGF, and IL-18)349
following SIVsab9315BR infection of AGM. Regardless of NHP species or virus infection,350
we did not detect significant elevations in IL-4, IL-12, IL-13, IL-17 and TGF-α. Of note, each351
of these analytes except for TGF-α was detectable in both NHP species in our assay352
validation work (Table 1), demonstrating that apart from TGF-α the lack of detectable353
elevation was not due to the inability of the assay to detect the analyte. MIP-1β, VEGF and354
IL-18 did not increase after SIVsab9315BR infection of AGM and SIVmac239Δnef infection355
18. Page 18 of 33
of RM. The only cytokines that were not detected in the validation studies and not356
detectably increased in SIV-infected NHP were GM-CSF and TGF-α in AGM.357
358
Peak cytokine responses are of higher magnitude after SIVmac251 infection359
In addition to differences in the breadth of responses detected, progressive vs. non-360
progressive infections might differ in peak magnitude or timing of responses. To compare361
peak analyte levels, we focused on factors that were up-regulated after infection and did362
not significantly differ between the groups at baseline. Analyte levels in the SIVmac251-363
and SIVmac239Δnef-infected RM groups were not significantly different at baseline (Figure364
4). However, IL-5 and MCP-1 were expressed at significantly higher baseline levels while365
IL-8 and IL-15 were expressed at significantly lower baseline levels in AGM compared to366
RM, and were thus excluded from comparative analysis. We first compared analyte367
increases in RM SIVmac251 infection and AGM SIVsab9315BR infection. Of the factors368
that were elevated in both comparison groups (Table 3), we found higher peak levels of369
IFN-γ, IL-1β, IL-1ra, IL-5, IL-8, IL-10, MIP-1α and IFN-α after SIVmac251 infection370
compared to SIVsab9315BR infection. SAA, IL-2, and IL-6 did not significantly differ at their371
peak response. G-CSF, GM-CSF, IL-2, IL-4, IL-12, IL-13, IL-17, MIP-1β, TGF-α, TNF-α,372
VEGF, IL-18 and sCD40L were not compared due to low or no responses in373
SIVsab9315BR- and/or RM SIVmac251-infected animals. Of the factors elevated in RM,374
GM-CSF, IFN-γ, IL-1β, IL-1ra, IL-5, IL-6, IL-10, IL-15, MCP-1, MIP-1 α, MIP-1β, TNF- α,375
VEGF, IFN-α and SAA peak levels were higher in SIVmac251-infected RM. Interestingly, a376
higher peak concentration of IL-8 in SIVmac239Δnef-infected animals occurred at day 56,377
after the peak of most other cytokine responses. Finally, sCD40L was higher in378
19. Page 19 of 33
SIVsab9315BR than in SIVmac239Δnef infection. Within and across NHP species, peak379
levels of a number of analytes showing elevated levels were notably higher in the380
progressive than in non-progressive infections, attesting to the robustness of this381
observation.382
383
384
Relationship between the peak viremia and peak cytokine responses during acute385
infection386
We hypothesized that acute viral replication could be associated with the strongest387
cytokine responses, and so we examined the correlation between peak cytokine levels and388
peak viremia during acute infection. No significant correlations were observed between389
peak cytokine responses and peak viremia in SIVmac251- and SIVmac239Δnef-infected390
RM (data not shown). In contrast, SIVsab9315BR infection of AGM was associated with a391
significant correlation between peak MCP-1 responses and peak viremia (P=0.006). To392
determine the relationship between the general cytokine response over the first 4 weeks393
and peak viremia, we performed a correlation analysis between the cytokine 4-week AUC394
and peak viremia. We found a significant positive correlation in SIVmac239Δnef-infected395
animals for IL-8 (P=0.04), a trend for positive correlation for MCP-1 (P=0.06), and a trend396
for a negative correlation for GM-CSF (P=0.05). However, this analysis did not result in397
significant correlations in the SIVmac251 or SIVsab9315BR-infected animals.398
399
Early cytokine responses correlate with chronic viremia at day 100400
20. Page 20 of 33
Early cytokine responses were analyzed to identify a potential association with chronic401
viremia. The magnitude of the AUC cytokine responses of each individual animal over the402
first 4 weeks of infection was compared with the magnitude of chronic viremia at day 100403
(Table 4). A number of individual cytokine responses in SIVmac251-infected RM404
significantly correlated with chronic viremia, including G-CSF, IFN-γ, IL-15, MIP-1β and IL-405
18. In contrast, in the same analysis MCP-1 and sCD40L showed a significant correlation406
in SIVmac239Δnef-infected RM, and IL-6 and MCP-1 in AGM infected with SIVsab9315BR.407
Additionally, a number of other cytokine responses during acute SIV infection were408
associated with viremia. A trend (P values between 0.05 and 0.2) was detected for the409
following analytes: sCD40L, IL-1β and IL-8 in SIVsab9315BR-infected AGM; and VEGF, IL-410
10, IL-6, and MIP-1α in SIVmac251-infected RM (Table 4). Of note, all correlations411
detected were positive, i.e. a relatively higher magnitude of cytokine responses during early412
infection correlated with a higher magnitude of viremia at day 100.413
414
415
21. Page 21 of 33
DISCUSSION416
In this study, we set out to explore the relationship between cytokines/chemokines417
during early infection and viral measurements during the chronic phase of infection.418
Cytokines/chemokines were used as biomarkers of the systemic immune response during419
acute infection to investigate their association with establishing virus/host balance affecting420
long term viral replication levels, based on correlations with chronic phase viremia. We421
used a cross-species application of human- and primate-specific ELISA and multiplex422
assays to study the induction of soluble immune mediators in acute and early SIV infection423
in models that do (SIVmac251-infected RM) or do not (SIVsab9315BR-infected AGM or424
SIVmac239Δnef-infected RM) typically show progressive disease leading to AIDS. A425
significantly higher magnitude and breadth of up-regulation of soluble immune factors was426
detected in RM infected with SIVmac251 compared to RM infected with SVImac239Δnef or427
AGM infected with SIVsab9315BR. In all three SIV infection models, the magnitude of peak428
viremia did not correlate with the levels of soluble immune markers investigated during the429
first 4 weeks after infection. However, we observed in all three infection models that chronic430
viremia was correlated with the levels of several soluble immune markers detected during431
the first four weeks of infection. A predominantly pro-inflammatory signature profile was432
observed in progressive infection; this was in contrast to the monocyte chemotactic433
cytokine signature detected in the non-progressive SIV infection models.434
During this study we encountered a few technical challenges. For each animal, only435
a single pre-infection time point was available, which provided only limited information436
about the steady state cytokine/chemokine levels for baseline determination. This was437
overcome by measuring analytes in a large number of uninfected animals, and using the438
22. Page 22 of 33
data to establish a baseline analyte level for each animal species. Before comparing the439
different infection models in two NHP species, we needed to confirm that the assays could440
detect these analytes across species. During the validation study, we established assay441
detection efficacy and found that the majority of the detection reagents were species cross-442
reactive. Nevertheless, it was difficult to determine if antibody-analyte binding was better in443
one species than another or whether variations in results were due to differences in levels444
of analyte production and/or re-absorption after stimulation of PBMC. This reveals a need445
for species-specific monoclonal antibodies and cytokine standards to be made to correctly446
quantify analyte concentrations for each species. Several analytes that showed better447
detection in the validation study in AGM were in fact expressed at higher levels in RM after448
SIV infection, including IL-5, IL-8, IL-1ra, IL-15, IL-18 and IFN-α, which strongly suggests449
that these analytes were indeed produced in greater quantities during pathogenic infection.450
As expected, the dynamics of the three viral infections were similar, while the451
progressive SIVmac251 infection model resulted in higher peak and chronic viremia than452
the two non-progressive infection models. As reported previously, SIVmac251 peak viremia453
was correlated with chronic viremia (40). This was also true for the non-progressive SIV454
infection in AGM. While not statistically significant, our data suggested a trend for a positive455
correlation between peak viremia and day 100 viremia in SIVmac239Δnef-infected RM.456
Thus, the magnitude of primary viremia appears to be associated with the magnitude of457
chronic viremia, regardless of the relative pathogenicity of SIV or the NHP species458
investigated.459
Although we hypothesized that the inflammatory cytokine response would coincide460
and correlate with peak viremia, we did not find this to be true in RM and found that only in461
23. Page 23 of 33
MCP-1 correlated SIVsab9315BR peak viremia in AGM (P=0.006). In addition, peak462
viremia of SIVmac239Δnef showed weak and borderline positive correlations with the 4463
week AUC for MCP-1 and IL-8 and negative correlation with 4 week AUC for GM-CSF.464
One of the main objectives of this study was to determine if any acute cytokine profiles465
were associated with chronic levels of viral replication. Comparing 4-week AUC cytokine466
levels in acute infection with setpoint levels of persisting viremia, we found that467
inflammatory cytokines IL-15, IL-18 and IFN-γ positively correlated with viral setpoint in RM468
SIVmac251 infection. IL-15 and IL-18 promote activation of innate subsets and adaptive469
responses indirectly enhancing virus control while simultaneously driving CD4+
T cell470
activation that promote stimulation and expansion of memory subsets of CD4+
T cells471
providing potential reservoirs for viral expansion (29, 35); this may explain their positive472
correlation with chronic viremia. IFN-γ is a key component in the maturation of the T cell473
response during acute infection and is associated with the activation of CD8+
T cells and474
the anti-viral NK cell response (23, 24). Several studies have shown that higher levels of475
IFN-γ secreting antigen-specific T cells were associated with better control of SIV infection476
in RM (5), and IFN-γ may be important in enhancing the expansion of a memory477
populations of immune cells for aiding long-term viral control (35). Given these potentially478
beneficial effects, the positive correlation of IFN-γ with viral setpoint was unexpected. In479
humans, IFN-γ, IL-12p40 and IL-12p70 responses were associated with a lower viral set480
point, while IL-7 and IL-15 were associated with higher setpoint (5, 35).481
The only analyte showing increases during in the acute phase of infection and482
correlation with setpoint viremia in all three SIV-infection models was MCP-1, a marker of483
systemic monocyte macrophage trafficking. When the virus targets the CNS within days of484
24. Page 24 of 33
infection, SIV-infected astrocytes produce the chemokine MCP-1 that is responsible for485
recruiting monocytes in SIV neuroinvasion and establishing the infected SIV reservoir in the486
brain(8). Suppressing monocyte activation in an acute infection model would be an487
attractive target to determine the relationship between monocyte activation and subsequent488
viral setpoint.489
Another inflammatory cytokine, IL-6, uniquely correlated with viral setpoint in AGM,490
while sCD40L uniquely correlated with viral setpoint in SIVmac239Δnef-infected RM.491
Interestingly, IL-6 production is associated with severe pathogenicity in HIV infection in492
humans and SIV infection in RM (6, 14, 25, 34). For example, SIVsmmPBj8 infection of RM493
results in death within a few weeks and induces significant IL-6 production which may be a494
cause or effect of the pathogenic course of infection (42). It is currently unknown why IL-6495
production in AGM does not lead to pathogenicity. One can only speculate whether IL-6496
production may in fact be beneficial for AGM. Given its pleotropic effects, IL-6 may be497
involved in the induction of regulatory B cells and thus restrain excessive immune498
activation, as recently described by Rosser et al. (37).499
Acute SIV infection in both natural and non-natural hosts elicits a massive depletion500
of mucosal CD4+
T cells. There is only a transient increase in inflammatory responses501
coinciding with acute viremia and eventually CD4+
T cell levels return to normal (15, 32).502
Although non-progressive SIV infection does not exhibit the same mucosal inflammation as503
progressive infection, recent work has shown that this non-progressive equilibrium can be504
disrupted in AGM using an experimental model of colitis resulting in gut-associated505
microbial translocation, macrophage accumulation, immune activation, significantly506
elevated viral load and continued decline of CD4+
T cells, similar to progressive infection507
25. Page 25 of 33
(17, 41). Reduction of this inflammatory response by treating with IL-21 supports508
maintenance of mucosal Th17 cells preventing microbial translocation and inflammation in509
progressive infection (27). The initial inflammatory responses in both groups and the510
differences in outcome could be related to how the infection seeds at the mucosa and the511
immune responses present that induces or prevent immune dysfunction; this may be an512
innate immune difference in the animal species. Monocyte chemotactic factors (MCP-1 and513
IL-8) and inflammatory cytokine production (i.e. IL-1β, IL-6, TNF-α and IL-18) in514
progressive infections could stem from this initial inflammatory cascade at the mucosal515
level; investigation into the mucosal immune response of non-progressive hosts may shed516
light on some of these differences.517
In summary, we observed higher levels of virus replication associated with a higher-518
magnitude of cytokine/chemokine response in progressive infection, and hypothesize that519
excessive early cytokine release may contribute to further immune activation and virus520
replication, setting the stage for subsequent disease progression. However, since we only521
performed correlation analyses of the magnitude of cytokine responses and viremia in the522
three SIV infection models, the mechanistic basis for the difference between progressive523
and non-progressive disease course still remains elusive. In the future, interventional in524
vivo studies will have to be performed to determine whether the qualitative and quantitative525
differences in cytokine/chemokine responses contribute to the non-pathogenic nature in526
non-progressive SIV infection.527
528
529
530
531
26. Page 26 of 33
Acknowledgments532
This work was supported by NIH, NIAID, Division of AIDS, grant AI0678501 (CHAVI,533
Center for HIV AIDS Vaccine Immunology) (B.M.K., P.B., N.L.L., P.J.N., J.E.S.) and534
AI065335 (J.E.S.) and in part with federal funds from the NCI/NIH under Contract No.535
HHSN261200800001E. This publication was made possible with help from the Harvard536
University Center for AIDS Research (CFAR), an NIH funded program (P30-AI060354),537
which is supported by the following NIH co-funding and participating institutes and centers:538
NIAID, NCI, NICHD, NHLBI, NIDA, NIMH, NIA, NIDDK, NIGMS, FIC, and OAR. P.B. is a539
Jenner Institute Investigator.540
541
27. Page 27 of 33
FIGURE LEGENDS542
543
Figure 1. Heat map illustrating normalized data from the validation study. PBMC from544
naïve rhesus macaques (n=11) and naïve AGM (n=6) were cultured in RPMI only or545
stimulated with PHA, LPS, PMA/Ionomycin, or CLO-97. The median fold-change in levels546
of each analyte was calculated as stimulated over unstimulated and normalized to the547
highest response across both species and stimulation conditions. The spectrum of median548
fold-change is represented by the red as the maximum response and blue as the minimum549
response across both types of NHP for each analyte.550
551
Figure 2. Dynamics of SIV viremia and correlation of peak and setpoint viremia. RM552
were infected with SIVmac251 (n=10) or with SIVmac239Δnef (n=10); AGM were infected553
with SIVsab9315BR (n=6). (A) Magnitude of SIV viremia in the first 100 days post554
challenge. Individual animals are depicted by broken lines; the solid lines represent the555
median values. (B) Pearson correlation of area under the curve (AUC) viremia during the556
first 4 weeks following SIV infection versus setpoint viremia at 100 days after infection.557
558
Figure 3. Graphic representation of the analytes up-regulated in the different SIV559
infection models. Positive cytokine and chemokine responses were defined in each560
animal as levels >95% confidence interval above the baseline mean for each species561
tested, 2× the baseline value for each individual animal, and >5 pg/ml. If more than 50%562
animals exhibited a positive response for a given analyte, up-regulation of that analyte was563
determined to be positive for the group. The positive responses observed in each SIV564
28. Page 28 of 33
model are denoted in the circles for AGM sab9135BR (red), RM SIVmac251 (blue) and RM565
SIVmac239Δnef (green). The common responses are represented in the intersection of the566
SIV model circles. The cytokines that were not found to be up-regulated in any of the567
infection models are outside of all three circles.568
569
Figure 4. Magnitude of analyte elevations over time after SIV infection. Group median570
plasma concentrations of 15 of the 25 analytes measured are shown over time; RM571
SIVmac251 (blue), RM SIVmac239Δnef (green), AGM SIVsab9315BR (red). Analytes that572
did not rise to more than 5 pg/mL at any time point and twice the median baseline are not573
shown. Serum amyloid A levels were measured during the first 5 weeks of infection in RM574
infected with SIVmac251 (n=10), RM infected with SIVmac239Δnef (n=9), and AGM575
infected with SIVsab9315BR (n=6). One of the SIVmac239Δnef-infected RM was not576
included in the SAA evaluation due to too low sample volume.577
578
579
29. Page 29 of 33
580
581
582
583
584
References585
1. 2011. Guide for the Care and Use of Laboratory Animals, 8th ed, Washington (DC).586
2. Almansa, R., M. Sanchez-Garcia, A. Herrero, S. Calzada, V. Roig, J. Barbado, L.587
Rico, F. Bobillo, J. M. Eiros, V. Iglesias, R. O. de Lejarazu, and J. F. Bermejo-588
Martin. 2011. Host response cytokine signatures in viral and nonviral acute589
exacerbations of chronic obstructive pulmonary disease. Journal of interferon & cytokine590
research : the official journal of the International Society for Interferon and Cytokine591
Research 31:409-413.592
3. Benjamini, Y. 2010. Discovering the false discovery rate. Journal of the Royal Statistical593
Society, Series B 72:405-416.594
4. Bosinger, S. E., K. A. Hosiawa, M. J. Cameron, D. Persad, L. Ran, L. Xu, M. R.595
Boulassel, M. Parenteau, J. Fournier, E. W. Rud, and D. J. Kelvin. 2004. Gene596
expression profiling of host response in models of acute HIV infection. J Immunol597
173:6858-6863.598
5. Boyer, J. D., P. C. Maciag, R. Parkinson, L. Wu, M. G. Lewis, D. B. Weiner, and Y.599
Paterson. 2006. Rhesus macaques with high levels of vaccine induced IFN-gamma600
producing cells better control viral set-point following challenge with SIV239. Vaccine601
24:4498-4502.602
6. Breen, E. C., A. R. Rezai, K. Nakajima, G. N. Beall, R. T. Mitsuyasu, T. Hirano, T.603
Kishimoto, and O. Martinez-Maza. 1990. Infection with HIV is associated with604
elevated IL-6 levels and production. J Immunol 144:480-484.605
7. Broussard, S. R., S. I. Staprans, R. White, E. M. Whitehead, M. B. Feinberg, and J.606
S. Allan. 2001. Simian immunodeficiency virus replicates to high levels in naturally607
infected African green monkeys without inducing immunologic or neurologic disease.608
Journal of virology 75:2262-2275.609
8. Clements, J. E., J. L. Mankowski, L. Gama, and M. C. Zink. 2008. The accelerated610
simian immunodeficiency virus macaque model of human immunodeficiency virus-611
associated neurological disease: from mechanism to treatment. Journal of neurovirology612
14:309-317.613
9. Cline, A. N., J. W. Bess, M. Piatak, Jr., and J. D. Lifson. 2005. Highly sensitive SIV614
plasma viral load assay: practical considerations, realistic performance expectations, and615
application to reverse engineering of vaccines for AIDS. Journal of medical primatology616
34:303-312.617
10. Cumont, M. C., O. Diop, B. Vaslin, C. Elbim, L. Viollet, V. Monceaux, S. Lay, G.618
Silvestri, R. Le Grand, M. Muller-Trutwin, B. Hurtrel, and J. Estaquier. 2008. Early619
divergence in lymphoid tissue apoptosis between pathogenic and nonpathogenic simian620
immunodeficiency virus infections of nonhuman primates. Journal of virology 82:1175-621
1184.622
30. Page 30 of 33
11. Daniel, M. D., F. Kirchhoff, S. C. Czajak, P. K. Sehgal, and R. C. Desrosiers. 1992.623
Protective effects of a live attenuated SIV vaccine with a deletion in the nef gene.624
Science (New York, N.Y 258:1938-1941.625
12. Desrosiers, R. C., and N. L. Letvin. 1987. Animal models for acquired626
immunodeficiency syndrome. Reviews of infectious diseases 9:438-446.627
13. Fiebig, E. W., D. J. Wright, B. D. Rawal, P. E. Garrett, R. T. Schumacher, L.628
Peddada, C. Heldebrant, R. Smith, A. Conrad, S. H. Kleinman, and M. P. Busch.629
2003. Dynamics of HIV viremia and antibody seroconversion in plasma donors:630
implications for diagnosis and staging of primary HIV infection. AIDS (London,631
England) 17:1871-1879.632
14. French, M. A., A. Cozzi-Lepri, R. C. Arduino, M. Johnson, A. C. Achhra, A.633
Landay, and I. S. S. Group. 2015. Plasma levels of cytokines and chemokines and the634
risk of mortality in HIV-infected individuals: a case-control analysis nested in a large635
clinical trial. AIDS (London, England) 29:847-851.636
15. Gordon, S. N., N. R. Klatt, S. E. Bosinger, J. M. Brenchley, J. M. Milush, J. C.637
Engram, R. M. Dunham, M. Paiardini, S. Klucking, A. Danesh, E. A. Strobert, C.638
Apetrei, I. V. Pandrea, D. Kelvin, D. C. Douek, S. I. Staprans, D. L. Sodora, and G.639
Silvestri. 2007. Severe depletion of mucosal CD4+ T cells in AIDS-free simian640
immunodeficiency virus-infected sooty mangabeys. J Immunol 179:3026-3034.641
16. Gupta, M., A. MacNeil, Z. D. Reed, P. E. Rollin, and C. F. Spiropoulou. 2012.642
Serology and cytokine profiles in patients infected with the newly discovered643
Bundibugyo ebolavirus. Virology 423:119-124.644
17. Hao, X. P., C. M. Lucero, B. Turkbey, M. L. Bernardo, D. R. Morcock, C. Deleage,645
C. M. Trubey, J. Smedley, N. R. Klatt, L. D. Giavedoni, J. Kristoff, A. Xu, G. Q. Del646
Prete, B. F. Keele, S. S. Rao, W. G. Alvord, P. L. Choyke, J. D. Lifson, J. M.647
Brenchley, C. Apetrei, I. Pandrea, and J. D. Estes. 2015. Experimental colitis in SIV-648
uninfected rhesus macaques recapitulates important features of pathogenic SIV infection.649
Nature communications 6:8020.650
18. Katsikis, P. D., Y. M. Mueller, and F. Villinger. 2011. The cytokine network of acute651
HIV infection: a promising target for vaccines and therapy to reduce viral set-point?652
PLoS pathogens 7:e1002055.653
19. Kornfeld, C., M. J. Ploquin, I. Pandrea, A. Faye, R. Onanga, C. Apetrei, V. Poaty-654
Mavoungou, P. Rouquet, J. Estaquier, L. Mortara, J. F. Desoutter, C. Butor, R. Le655
Grand, P. Roques, F. Simon, F. Barre-Sinoussi, O. M. Diop, and M. C. Muller-656
Trutwin. 2005. Antiinflammatory profiles during primary SIV infection in African green657
monkeys are associated with protection against AIDS. The Journal of clinical658
investigation 115:1082-1091.659
20. Kramer, H. B., K. J. Lavender, L. Qin, A. R. Stacey, M. K. Liu, K. di Gleria, A.660
Simmons, N. Gasper-Smith, B. F. Haynes, A. J. McMichael, P. Borrow, and B. M.661
Kessler. 2010. Elevation of intact and proteolytic fragments of acute phase proteins662
constitutes the earliest systemic antiviral response in HIV-1 infection. PLoS pathogens663
6:e1000893.664
21. Lederer, S., D. Favre, K. A. Walters, S. Proll, B. Kanwar, Z. Kasakow, C. R. Baskin,665
R. Palermo, J. M. McCune, and M. G. Katze. 2009. Transcriptional profiling in666
pathogenic and non-pathogenic SIV infections reveals significant distinctions in kinetics667
and tissue compartmentalization. PLoS pathogens 5:e1000296.668
31. Page 31 of 33
22. Lifson, J. D., M. A. Nowak, S. Goldstein, J. L. Rossio, A. Kinter, G. Vasquez, T. A.669
Wiltrout, C. Brown, D. Schneider, L. Wahl, A. L. Lloyd, J. Williams, W. R. Elkins,670
A. S. Fauci, and V. M. Hirsch. 1997. The extent of early viral replication is a critical671
determinant of the natural history of simian immunodeficiency virus infection. Journal of672
virology 71:9508-9514.673
23. Manetti, R., F. Gerosa, M. G. Giudizi, R. Biagiotti, P. Parronchi, M. P. Piccinni, S.674
Sampognaro, E. Maggi, S. Romagnani, G. Trinchieri, and et al. 1994. Interleukin 12675
induces stable priming for interferon gamma (IFN-gamma) production during676
differentiation of human T helper (Th) cells and transient IFN-gamma production in677
established Th2 cell clones. The Journal of experimental medicine 179:1273-1283.678
24. Manetti, R., P. Parronchi, M. G. Giudizi, M. P. Piccinni, E. Maggi, G. Trinchieri,679
and S. Romagnani. 1993. Natural killer cell stimulatory factor (interleukin 12 [IL-12])680
induces T helper type 1 (Th1)-specific immune responses and inhibits the development of681
IL-4-producing Th cells. The Journal of experimental medicine 177:1199-1204.682
25. McDonald, B., S. Moyo, L. Gabaitiri, S. Gaseitsiwe, H. Bussmann, J. R. Koethe, R.683
Musonda, J. Makhema, V. Novitsky, R. G. Marlink, C. W. Wester, and M. Essex.684
2013. Persistently elevated serum interleukin-6 predicts mortality among adults receiving685
combination antiretroviral therapy in Botswana: results from a clinical trial. AIDS686
research and human retroviruses 29:993-999.687
26. McMichael, A. J., P. Borrow, G. D. Tomaras, N. Goonetilleke, and B. F. Haynes.688
2010. The immune response during acute HIV-1 infection: clues for vaccine689
development. Nature reviews. Immunology 10:11-23.690
27. Micci, L., E. S. Ryan, R. Fromentin, S. E. Bosinger, J. L. Harper, T. He, S. Paganini,691
K. A. Easley, A. Chahroudi, C. Benne, S. Gumber, C. S. McGary, K. A. Rogers, C.692
Deleage, C. Lucero, S. N. Byrareddy, C. Apetrei, J. D. Estes, J. D. Lifson, M. Piatak,693
Jr., N. Chomont, F. Villinger, G. Silvestri, J. M. Brenchley, and M. Paiardini. 2015.694
Interleukin-21 combined with ART reduces inflammation and viral reservoir in SIV-695
infected macaques. The Journal of clinical investigation 125:4497-4513.696
28. Mohri, H., S. Bonhoeffer, S. Monard, A. S. Perelson, and D. D. Ho. 1998. Rapid697
turnover of T lymphocytes in SIV-infected rhesus macaques. Science (New York, N.Y698
279:1223-1227.699
29. Mueller, Y. M., D. H. Do, S. R. Altork, C. M. Artlett, E. J. Gracely, C. D. Katsetos,700
A. Legido, F. Villinger, J. D. Altman, C. R. Brown, M. G. Lewis, and P. D. Katsikis.701
2008. IL-15 treatment during acute simian immunodeficiency virus (SIV) infection702
increases viral set point and accelerates disease progression despite the induction of703
stronger SIV-specific CD8+ T cell responses. J Immunol 180:350-360.704
30. Okoye, A., H. Park, M. Rohankhedkar, L. Coyne-Johnson, R. Lum, J. M. Walker,705
S. L. Planer, A. W. Legasse, A. W. Sylwester, M. Piatak, Jr., J. D. Lifson, D. L.706
Sodora, F. Villinger, M. K. Axthelm, J. E. Schmitz, and L. J. Picker. 2009. Profound707
CD4+/CCR5+ T cell expansion is induced by CD8+ lymphocyte depletion but does not708
account for accelerated SIV pathogenesis. The Journal of experimental medicine709
206:1575-1588.710
31. Pandrea, I., and C. Apetrei. 2010. Where the wild things are: pathogenesis of SIV711
infection in African nonhuman primate hosts. Current HIV/AIDS reports 7:28-36.712
32. Pandrea, I. V., R. Gautam, R. M. Ribeiro, J. M. Brenchley, I. F. Butler, M. Pattison,713
T. Rasmussen, P. A. Marx, G. Silvestri, A. A. Lackner, A. S. Perelson, D. C. Douek,714
32. Page 32 of 33
R. S. Veazey, and C. Apetrei. 2007. Acute loss of intestinal CD4+ T cells is not715
predictive of simian immunodeficiency virus virulence. J Immunol 179:3035-3046.716
33. Picker, L. J., S. I. Hagen, R. Lum, E. F. Reed-Inderbitzin, L. M. Daly, A. W.717
Sylwester, J. M. Walker, D. C. Siess, M. Piatak, Jr., C. Wang, D. B. Allison, V. C.718
Maino, J. D. Lifson, T. Kodama, and M. K. Axthelm. 2004. Insufficient production719
and tissue delivery of CD4+ memory T cells in rapidly progressive simian720
immunodeficiency virus infection. The Journal of experimental medicine 200:1299-1314.721
34. Ramesh, G., X. Alvarez, J. T. Borda, P. P. Aye, A. A. Lackner, and K. Sestak. 2005.722
Visualizing cytokine-secreting cells in situ in the rhesus macaque model of chronic gut723
inflammation. Clinical and diagnostic laboratory immunology 12:192-197.724
35. Roberts, L., J. A. Passmore, C. Williamson, F. Little, L. M. Bebell, K. Mlisana, W.725
A. Burgers, F. van Loggerenberg, G. Walzl, J. F. Djoba Siawaya, Q. A. Karim, and726
S. S. Karim. 2010. Plasma cytokine levels during acute HIV-1 infection predict HIV727
disease progression. AIDS (London, England) 24:819-831.728
36. Rosenzweig, M., M. A. DeMaria, D. M. Harper, S. Friedrich, R. K. Jain, and R. P.729
Johnson. 1998. Increased rates of CD4(+) and CD8(+) T lymphocyte turnover in simian730
immunodeficiency virus-infected macaques. Proceedings of the National Academy of731
Sciences of the United States of America 95:6388-6393.732
37. Rosser, E. C., K. Oleinika, S. Tonon, R. Doyle, A. Bosma, N. A. Carter, K. A.733
Harris, S. A. Jones, N. Klein, and C. Mauri. 2014. Regulatory B cells are induced by734
gut microbiota-driven interleukin-1beta and interleukin-6 production. Nature medicine735
20:1334-1339.736
38. Sodora, D. L., J. S. Allan, C. Apetrei, J. M. Brenchley, D. C. Douek, J. G. Else, J. D.737
Estes, B. H. Hahn, V. M. Hirsch, A. Kaur, F. Kirchhoff, M. Muller-Trutwin, I.738
Pandrea, J. E. Schmitz, and G. Silvestri. 2009. Toward an AIDS vaccine: lessons from739
natural simian immunodeficiency virus infections of African nonhuman primate hosts.740
Nature medicine 15:861-865.741
39. Stacey, A. R., P. J. Norris, L. Qin, E. A. Haygreen, E. Taylor, J. Heitman, M.742
Lebedeva, A. DeCamp, D. Li, D. Grove, S. G. Self, and P. Borrow. 2009. Induction of743
a striking systemic cytokine cascade prior to peak viremia in acute human744
immunodeficiency virus type 1 infection, in contrast to more modest and delayed745
responses in acute hepatitis B and C virus infections. Journal of virology 83:3719-3733.746
40. Staprans, S. I., P. J. Dailey, A. Rosenthal, C. Horton, R. M. Grant, N. Lerche, and747
M. B. Feinberg. 1999. Simian immunodeficiency virus disease course is predicted by the748
extent of virus replication during primary infection. Journal of virology 73:4829-4839.749
41. Swan, Z. D., E. R. Wonderlich, and S. M. Barratt-Boyes. 2016. Macrophage750
accumulation in gut mucosa differentiates AIDS from chronic SIV infection in rhesus751
macaques. European journal of immunology 46:446-454.752
42. Tao, B., and P. N. Fultz. 1999. Pathogenicity and comparative evolution in vivo of the753
transitional quasispecies SIVsmmPBj8. Virology 259:166-175.754
43. Weissman, D., T. D. Barker, and A. S. Fauci. 1996. The efficiency of acute infection of755
CD4+ T cells is markedly enhanced in the setting of antigen-specific immune activation.756
The Journal of experimental medicine 183:687-692.757
44. Zahn, R. C., M. D. Rett, M. Li, H. Tang, B. Korioth-Schmitz, H. Balachandran, R.758
White, S. Pryputniewicz, N. L. Letvin, A. Kaur, D. C. Montefiori, A. Carville, V. M.759
Hirsch, J. S. Allan, and J. E. Schmitz. 2010. Suppression of adaptive immune760
33. Page 33 of 33
responses during primary SIV infection of sabaeus African green monkeys delays partial761
containment of viremia but does not induce disease. Blood 115:3070-3078.762
763
764
39. Table 2. Percentage of animals with cytokine responses after SIV infection.
a
The upper 95% confidence interval was calculated by testing the baseline analyte levels in 74
untreated RM and 19 untreated AGM.
b
RM infected with SIVmac251 (n=10), RM infected with SIVmac239Δnef (n=10), and AGM
infected with SIVsab9315BR (n=6) were analyzed. The percentage of animals that at any time point
had analyte levels above the upper 95% confidence of the group baseline, two-fold change over the
individual baseline and were >5pg/ml is shown. Bold numbers denote groups and cytokines with
more than a 50% response and therefore considered a positive response for the group.
c
For the SAA evaluation, 19 RM and 6 AGM were included in the baseline analysis. One of the
SIVmac239Δnef-infected RM was not included in the SAA evaluation due to insufficient sample
volume.
Baseline % responder
RM
Upper
95% CIa
AGM
Upper
95% CIa
RM
SIVmac251b
RM
SIV mac239Δnef b
AGM
SIVsab9315BR b
(n=74) (n=19) (n=10) (n=10) (n=6)
G-CSF 1.3 2.6 60 30 50
GM-CSF 17.0 6.5 80 50 17
IFN-γ 11.0 5.2 100 30 83
IL-1β 12.0 2.1 100 0 50
IL-1ra 40.0 22.0 100 0 50
IL-2 20.0 49.0 50 40 33
IL-4 0.7 1.6 0 10 17
IL-5 1.7 3.3 10 30 50
IL-6 1.9 18.0 60 10 50
IL-8 164.0 20.0 60 90 50
IL-10 2.5 2.6 100 0 50
IL-12/23 152.0 62.0 30 0 0
IL-13 0.6 1.2 30 0 17
IL-15 4.3 2.2 100 50 67
IL-17 0.9 0.9 40 0 17
MCP-1 153.0 408.0 100 50 67
MIP-1β 2.5 8.5 50 0 0
MIP-1α 21.0 18.0 70 20 67
sCD40L 318.0 1395.0 60 80 83
TGF-α 59.0 4.0 0 0 0
TNF-α 19.0 2.3 50 0 33
VEGF 43.0 60.0 100 0 33
IL-18 38.0 1.8 90 0 17
IFN-α 1.7 4.1 100 0 50
SAAc
146.7 256.5 90 44 67
40. Table 3. Cytokine responses after pathogenic and non-pathogenic SIV infection in RM and AGM.
a
Median and lower and upper quartiles for the baseline responses.
b
The peak median response for each group, which differed between animals, analytes, and groups, is shown with its
corresponding day after infection.
c
Analytes with significant differences (determined by ANOVA followed by Tukey Honestly Significant Differences (HSD)) in
peak levels of cytokine between the three different infection models are shown in bold. (IL-4, IL-12, IL-13, IL-17, and TGF-α
were not found to be up-regulated in >50% animals and are not included in this table).
d
NR: Analytes that did not reach the upper 95% CI of the group baseline did not exhibit a two-fold change over the
individual baseline at any time point and did not exceed 5 pg/ml, the criteria for response up-regulation.
e
ND: Analytes had no detectable response.
Rhesus macaque African green monkey
Baseline
Median
a IQR
a
SIVmac251
Median
Peak
Response
b
Day
b
SIVmac239Δnef
Median
Peak
Response
b
Day
b Baseline
Median
a
IQR
a
SIVsab9315BR
Median Peak
Response
b
Day
b
G-CSF 0.3 0.3 - 0.7 1.8 12 2.3 21 0.3 0.3 - 2 4.5 10
GM-CSF
c
3.4 0.3 - 15 47.8 27 12.6 21 0.6 0.3 - 7 0.5 NR
d
IFN-γ 6.2 3 - 11 80.5 10 10.8 27 2 1 - 5 5.2 21
IL-1β 0.3 0.3 - 3.5 50.5 10 0.3 NR 0.3 0.3 - 3 10.8 14
IL-1ra 8.0 0.3 - 37 678.5 10 7.2 NR 4 2 - 18 38.4 14
IL-2 14.7 4.3 - 23 25.9 154 23.3 56 24 4 - 59 23.6 21
IL-5 0.3 0.1 - 0.3 31.9 10 0.5 7 0.6 0.3 - 3 4.4 14
IL-6 0.3 0.3 - 0.3 6.8 154 0.3 NR 0.3 0.3 - 9 45.0 7
IL-8 98.2 61 - 189 526.4 7 807.5 56 2 0.3 - 9 22.4 7
IL-10 0.3 0.2 - 0.3 31.0 12 0.3 NR 0.3 0.3 - 0.6 4.6 14
IL-15 4.0 2.4 - 5.5 23.2 10 8.3 7 0.8 0.3 - 2 5.2 14
MCP-1 130.4 102 - 168 568.4 10 291.9 7 316 188 - 378 582.6 125
MIP-1α 7.0 0.3 - 19 126.4 21 8.5 NR 2 2 - 13 29.8 10
MIP-1β 0.3 0.3 - 0.8 6.4 154 0.3 ND
e
0.3 0.3 - 0.3 0.3 ND
sCD40L 209.1 119 - 393 269.7 NR 348.5 56 392
149 -
1047
551.5 21
TNF-α 3.4 0.3 - 13 7.0 NR 0.9 NR 0.3 0.3 - 1 1.8 NR
VEGF 0.3 0.3 - 7.5 427.3 10 1.6 NR 2 2 - 56 1.6 NR
IL-18 0.3 0.3 - 9.6 87.8 12 1.6 NR 2 2 - 2 1.6 NR
IFN-α 1.0 0.6 - 2.1 63.8 10 1.9 NR 1 1 - 2 3.4 12
SAA 40 20 - 87 452 7 80 7 39 19 - 65.5 316.6 7
41. Table 4. Cytokine responses during early infection that correlate with viral setpoint.
R2
P-value FDR
SIVsab9315BR
IL-6 0.85a
0.009 0.07
MCP-1 0.85 0.009 0.07
sCD40L 0.64 0.057 0.24
IL-1β 0.61 0.068 0.24
IL-8 0.54 0.095 0.27
SIVmac239Δnef
MCP-1 0.75 0.001 0.003
sCD40L 0.76 0.001 0.003
IL-8 0.221 0.17 0.28
SIVmac251
IFN-γ 0.83 0.0003 0.004
IL-18 0.81 0.0004 0.004
G-CSF 0.64 0.006 0.04
IL-15 0.59 0.009 0.05
MIP-1β 0.55 0.015 0.06
SAA 0.421 0.04 0.11
MCP-1 0.405 0.048 0.11
VEGF 0.41 0.05 0.11
IL-10 0.287 0.11 0.23
IL-6 0.257 0.13 0.25
MIP-1α 0.246 0.145 0.25
a
For each analyte, area under the curve (AUC) was calculated for the first 4 weeks of
infection and a regression analysis was done comparing this value with setpoint viremia.
Non-significant P values (P values between 0.05 and 0.2; possibly representing a trend)
are shown below the dotted lines in italics.