The learning strategies of successful research graduates; a survey on the msi...
research_behavior
1. Research Management Review, Volume 15, Number 2
Fall/Winter 2006
Researcher Behavior that Leads to Success in
Obtaining Grant Funding:
A Model for Success
Sharon Stewart Cole, Ph.D.
Nevada Cancer Institute
ABSTRACT
The purpose of this study was to examine a previous funding success model for its use across disciplines
in order to identify the significant behaviors, networking activities, and demographic profile that
contributed to the successful receipt of federal grant awards. A comprehensive model of funding success
was identified.
INTRODUCTION
Researchers have investigated what determines the capacity or ability to obtain grant awards and
indicated that developing a behavioral profile of faculty who are persistent in getting funding is possible
and desirable (Ebong, 1999). The ability to participate in grant-funded research can be critical to new
faculty seeking tenure and to institutions seeking funding to support research activities. Only a few recent
studies have attempted to systematically investigate the behaviors that lead to federal grant awards (Boyer
& Cockriel, 1998; Campbell, 2000; Ebong, 1999; Thornley, Spence, Taylor, & Magnan, 2002). The
investment in academic research is great, with the federal government alone investing $15 billion
annually in academic research (Executive Office of the President of the United States, 2000). This causes
fierce competition among research universities, who attempt to increase income and intellectual gain to
students (Stigler, 1993). Several key, prominent issues might influence faculty’s success in receiving
federal funding: (a) the perspectives and needs of research faculty (Boyer & Cockriel, 1998; McMillin,
2004; Porter, 2004); (b) incentives that could influence faculty to pursue funded research (Beier, 2002;
McMillin, 2004); (c) institutional processes and behavior that could impact faculty who seek funded
research (Ebong, 1999; McMillin, 2004; Thornley et al., 2002); (d) the balance between teaching and
research (Daly, 1994; Fairweather, 2002; Marsh & Hattie, 2002; Tang & Chamberlain, 1997); and (e) the
competitive nature of federal funding (Stigler, 1993).
Boyer and Cockriel (1998) showed that the key to pursuing grant funding lies in discovering the
motivators that attract faculty. McMillin (2004) reported that becoming a complete scholar is traditionally
identified as behavior associated with preparing proposals, participating in research projects, and
2. Research Management Review, Volume 15, Number 2
Fall/Winter 2006
2
publishing research results. Competition for support could seriously hinder new researchers’ efforts. Data
from the National Institutes of Health (NIH) showed that only 13.5% of its proposals were submitted
from investigators between the ages of 36 and 40, while 20.4% were submitted from investigators over 50
years of age (National Institutes of Health, 2005).
This study was conducted because of the lack of a systemic process to identify the behaviors that
contribute to improving the success rate of proposal submissions and the factors that encourage faculty to
pursue federal funding. For this study, the number of awards and dollar value of awards measure success.
This article attempts to extend existing research performed by Campbell (2000) by examining a
comprehensive funding success model for its use across disciplines in order to identify the significant
behaviors and to obtain a demographic profile that contributed to successfully receiving federal grant
awards. This article expands the Campbell (2000) conceptual model by adding: (a) two more disciplines,
(b) more categories of institutional support, (c) demographic data to obtain a successful researcher profile,
and (d) networking activities. Research performed by Ebong (1999) indicated that developing a profile of
faculty who are persistent in getting funding is possible. Ebong (1999) clarified that literature on grant
activity over the last two decades showed that early experience was critical in individuals’ and
institutions’ success in receiving external support. Competition does take place among research
universities and faculty. The competition focuses on the need to increase the intellectual gains to students
and for faculty to derive economic gain from new ideas that advance science and human well-being.
Faculty compete for higher salaries, larger offices, and recognition. Universities compete for prestige and
income, and competition determines which are successful (Stigler, 1993).
Campbell (2000) recommended replicating this research to verify the models and to add other disciplines.
A survey was designed based on the federal agencies’ funding criteria and administered to university
faculty. The researcher selected full-time faculty for the study to determine if a generic model may be
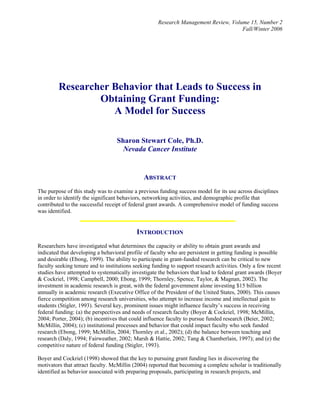
developed to be used across disciplines. The conceptual model used for this article is depicted in Figure 1.
CONCEPTUAL FRAMEWORK AND HYPOTHESES
Specifically, this article answers the following research questions: (a) What are the behaviors that
contribute to success in competing for federal funding? (b) Can the conceptual model be used across
disciplines? (c) What factors encourage faculty to pursue federal funding? A review of the literature
showed such knowledge was of value to new researchers and to universities.
Hypothesis 1: The total dollar value of the awards received will be negatively related to faculty
behavior.
Fountain (2004) reported that during the fifty years following World War II, changes occurred that called
for major adjustments in the strategy for funding scientific research. The two most important changes
were the “end of the Cold War and the emergence of a global technological marketplace” (Fountain,
2004, p. 1). The extent of the federal government’s participation in research is clearly visible when
reviewing the history of congressional appropriations to academic research. Universities and colleges
reported that R&D funding grew by 13.7% in FY2002 and 2003, reaching $24.7 billion. The federal
government’s share of this growth totaled 61.7%, or $15 billion, which was at its highest level since
FY1985 (NSF, 2005).
3. Research Management Review, Volume 15, Number 2
Fall/Winter 2006
3
Figure 1. Composite Federal Funding Success Model. Used as the conceptual model for this study. The
justification for the components of the model was taken from federal agency review requirements in place
at the time of the study and the review of research literature discussed in chapter 2. From Federal
Funding Success Factors in Biology and Mathematics by E. D. Campbell (2000, p. 3). Permission granted
by Dr. Campbell on January 28, 2006.
Hypothesis 2: The number of awards received will be negatively related to faculty behavior.
During the Society for Research Administrators’ Annual Meeting in 2003, it was reported that less than
50% of the combined research and teaching faculty submitted proposals in 2003 (Porter, 2004). Porter
mentioned that new faculty often have little awareness of how to receive federal funds or how to become
a Principal Investigator (P.I.). In addition, Porter explained new faculty are overwhelmed by their
teaching responsibilities, advising students, adjusting to a new environment, and the need to publish to get
tenure. Boyer and Cockriel (1998) stated, “Research universities [were] judged by others based on
research productivity and the dollar amount of acquired grants” (p. 61). Furthermore, being “scholarly”
was traditionally defined as “engaging in research, writing articles for publication, and sharing research
findings with students” (Boyer & Cockriel, 1998, p. 61).
METHOD
Participants
Participants were 286 full-time faculty located at comprehensive and master’s degree universities in
Texas and California. These states were selected due to the high concentration of universities meeting the
established selection criteria. The majority of the participants (86%) represented the fields of biological
System
Grant Type
Continuing 1,3,4
Standard 3
Fixed Price 3
Cooperative
Agreements 2
Contracts 3,4
Young Scholar 4
Teaching
Enhancements 2,4
Research Facilities 1,3
Infrastructure 1
Agencies
NIH 2,4
NSF 1,4
DOE 2,3
USDA 3
Other 1,3
Support
University Support
Computer 1
Other Facilities 2
Consultants 3
Machine Shop 4
Consortium 1
Contractual Arrangements
3
Research Team
Post Doctoral 3,4
Other Professionals 4
Graduate Students 2,3,4
Undergraduate Students 1
Team Secretary 2,4
Individual
Type of Research 1,2,3,4
Basic
Applied
Both
Networking
Membership Professional Societies 3
Offices Professional Societies 1,2
National Meetings Attended 3
Proven Record of Accomplishment
Funded Books/Articles published 4
Presentations at National Meetings 4
Individual Effort Number of Agencies Applied to 1,3
Number of Grants Applied for 1,3
Number of Agencies Awarding Grants 1,2,3,4,
Federal Funding
Success
1 Number Math
2 Value Math
3 Number Biology
4 Value Biology
4. Research Management Review, Volume 15, Number 2
Fall/Winter 2006
4
sciences, mathematics, physical science, and computer science. The average number of years as a P.I. was
13.8 years. The majority of respondents were males (66%) and most held the rank of full professor (49%).
The average age of the sample was 55 years.
Procedures
From the universities’ faculty directories, contact information was abstracted to generate a list of possible
participants. The universities were selected with a stratified random multistage sampling process. This
sample was selected first based on the criteria of the Carnegie Foundation’s classification of
comprehensive doctoral and master’s degree-granting universities. Second, these universities in the states
of Texas and California were selected based on receipt of $1 million of federal awards as reported by the
National Science Foundation (Survey of Federal Science and Engineering Support to Universities,
Colleges, and Nonprofit Institutions, 2002). The survey was prepared in electronic format and included a
cover letter that contained a brief description of the study, instructions for completion of the survey, and
thanks to faculty for agreeing to participate. The letter stressed that the information would remain
anonymous. The university classifications were verified by the Carnegie Foundation for the Advancement
of Teaching database. All participants were verified as full-time faculty in the selected universities.
From this process, 4,152 faculty names and corresponding contact information were generated. The goal
of this study was to obtain 250 participants; 286 responses were received (N = 123 from California and N
= 163 from Texas). The data were collected electronically and a record of the number of surveys returned
and the survey question answered for each response was maintained. All participants were asked to
respond to the survey with profile data and information about their federal award experiences. The
electronic survey consisted of closed-ended and open-ended questions. This provided the respondents
with an opportunity to define responses and to give yes-and-no answers.
Measures
Multiple regression analysis was selected because it offers a reliable method for exploring the predictive
ability of a set of independent variables to more than one dependent variable. Some open-ended questions
required a numerical answer such as age or years as a P.I. and led easily to coding; however, other open-
ended questions required a response, and yes/no questions were assigned a value of 0 = no and 1 = yes.
Cronbach’s alpha correlation, a numerical coefficient of reliability, was calculated to determine survey
reliability. “Computation of alpha is based on the reliability of a test relative to other tests with the same
number of items, and measuring the same construct of interest” (Santos, 1999, p. 1). A score of 0.70 is
said to be an acceptable reliability coefficient, but lower thresholds are sometimes accepted (Santos,
1999). Not all questions in the study were included because they did not generate yes-or-no answers and
were not Likert-scale questions. However, using the standardized variable, the overall alpha was
0.713545 and was thus an acceptable score for survey reliability.
Analysis
The statistical analysis determined which factors were significant predictors of funding success. For the
continuous variables, the mean, median, and standard deviation were calculated. The normality of the
distribution was assessed using the descriptive statistics process. The faculty were only excluded due to
missing data if the missing data were required for the analysis. They were still in the analyses for
questions for which they had supplied the needed information. A linear regression was used for the
5. Research Management Review, Volume 15, Number 2
Fall/Winter 2006
5
analysis of the dollar value of awards. The Poisson regression analysis was used to analyze the number of
awards. The Poisson regression is more appropriate for count data (Oxford Journals, 2006).
The evidence for acceptance or rejection of the null hypotheses was provided by a significant relationship
between the dependent and independent variables of faculty behaviors. Univariate regression was used to
identify variables that had significant individual correlation with the dependent variables. Multiple
regression analysis and backward elimination were used to identify behaviors with significant
independent correlation with the dependent variables. Variables included in the multiple regression were
the significant individual behaviors plus additional behaviors deemed to have important relevance based
on the literature review. Biographical, profile, institutional support, record of accomplishment, number of
proposals submitted, dollar value of awards, institutional support, other networking behaviors, and
research team data were self-reported and not subject to validation.
Descriptive statistics were used to provide the basic features of the data in the study. One of the goals of
this research was to provide an understanding of researcher demographics to develop a profile of
behaviors that contribute to the success in receiving federal funding, and what factors encourage faculty
to pursue federal funding. Such a profile is provided by descriptive statistics (number of observations,
mean, and standard deviation) as shown in Table 1.
Table 1. Researcher Profile Factors—Basic Statistical Measure of Quantitative Variables
Variable N Mean Std Dev
Age 255 50.396 11.980
Education 213 0.526 0.501
Number of proposals 227 6.595 7.572
Number of publications 215 17.270 27.146
Number of years as P.I. 227 15.173 13.199
Association officer 225 0.933 0.250
Research team size 280 5.902 11.014
Note: Education means training in grant writing.
Respondents reported on professional relationships or other networking behaviors that contributed to
success in receiving federal funding. The most frequently reported networking behaviors were
collaborative arrangements and talking with federal program officers. Some noted that they performed no
networking activities, but instead relied on quality research to get the respect of their peers. A summary of
the reported networking activities and behavior is listed in Table 2.
ANALYSIS OF DEPENDENT VARIABLE––DOLLAR VALUE OF AWARDS
For the dependent variable, dollar value of awards, a univariate regression analysis was performed on all
variables. The result of the univariate regression analysis is shown in Table 3.
“The level of significance actually obtained after the data [were] collected and analyzed [was] called the
probability value, and [was] indicated by the symbol p-value” (Gall et al., 2003, p. 138). For the
univariate regressions, the value p < .10 was considered to be significant. The variables from the
univariate analysis with a significant p value of <.10 were number of proposals, research team size,
number of publications, association meetings attended, and funding from NIH, NSF, DOD, and other
funding agencies. The discipline or field of study of the participants showed no significant relationship, as
proposed by Campbell (2000). A multiple regression analysis with a backward elimination was then
6. Research Management Review, Volume 15, Number 2
Fall/Winter 2006
6
Table 2. Summary Table of Networking Behaviors
Other Networking Activities/Behavior N
Attend NSF sponsored program specific workshops 1
Collaborative arrangements 126
Looked at old proposals 1
Have other scientist read proposal before submission 2
Meet with colleagues/peers 5
Meet with legislative representatives 11
Meet with persons who have problems to be solved 1
No networking activities 68
Participate on review panels 1
Talk with federal program officers 142
Talk with successful grantees 1
Note: Other networking activities/behavior are in addition to attending association meetings.
performed on these variables, and with the inclusion of number of years, education, tenured, gender,
institutional support, and reduced teaching load that were considered important based on the review of
literature. From the backward elimination, three important variables were identified as significant at the p
< 0.05 levels and were shown in Table 3 below. Attending association meetings was identified as nearly
significant with a p = .062.
The identified significant variables or behaviors, including the addition of the variable, attending
association meetings, for dollar value of awards are described as follows:
1. Education was the data code for any type of grant writing training in which the P.I. had
participated. This behavior included obtaining mentor instruction, attending college courses,
participating in continuing education courses, and participating on-the-job-training. Obtaining
education in grant writing was selected as a significant variable with a 0.018 p value as
related to the dollar value of awards.
2. Association meetings attended were the data code for the number of professional association
meetings attended. This represents the actual annual count as reported by the P.I. Attending
association meetings was selected with a 0.0623 p value as related to the dollar value of
awards.
3. Number of proposals was the data code for number of proposals submitted. This represents
the actual count of proposals submitted to any number of the six federal funding agencies
included in the study: DOD, DOE, NASA, USDA, NIH, and NSF, or other agencies. The
number of proposals submitted was selected as a significant variable with a <.0001 p value as
related to the dollar value of awards.
4. Research team size was the data code for the number of persons assigned to the research
team. The research team represents a variety of personnel hired by the researcher such as
postdoctoral associates, graduate research assistants, project managers, secretarial assistance,
and other professional personnel. The number of persons on the research team was selected as
a significant variable with a 0.0052 p value as related to the dollar value of awards.
7. Research Management Review, Volume 15, Number 2
Fall/Winter 2006
7
Table 3. Results of Univariate Regression Analysis-Dollar Value of Awards
Variable Estimate
Standard
Error
P-Value
Age -0.014 0.018 0.458
Assistant Professor 0.050 0.621 0.936
Associate Professor -0.242 0.513 0.637
Biological Sciences -0.401 0.457 0.382
Computer Science -0.099 0.629 0.875
Consortium 1.565 1.108 0.159
DOD 0.943 0.527 0.075
DOE 0.253 0.531 0.634
Education -0.689 0.476 0.149
Facilities 0.035 0.150 0.814
Full Professor 0.473 0.458 0.303
Gender -0.105 0.526 0.842
Mathematics 0.316 0.688 0.646
Association meetings 0.086 0.028 0.002
Association
membership
0.102 0.088 0.247
Monetary rewards 0.193 0.221 0.383
NASA 0.928 0.582 0.113
NIH 0.758 0.452 0.095
No. of proposals 0.104 0.029 0.001
No. of publications 0.017 0.009 0.045
NSF 1.144 0.566 0.044
No. years as P.I. 0.009 0.017 0.602
Association offices 0.178 0.258 0.491
Other agencies -0.895 0.457 0.052
People support 0.076 0.114 0.506
Reduced teaching Load 0.592 0.512 0.249
Research team size 0.065 0.018 0.001
Tenured 0.055 0.576 0.924
USDA 0.537 0.712 0.452
Note: Education means training in grant writing. Other agencies means agencies reported other than NIH,
NSF, NASA, DOE, USDA, and DOD. P = probability.
8. Research Management Review, Volume 15, Number 2
Fall/Winter 2006
8
Table 4. Summary of Backward Elimination for Dependent Variable-Dollar Value of Awards
Variable
Parameter
Estimate
Standard
Error P-Value
Education -1.01035 0.420 0.017
Association meetings 0.04923 0.026 0.062
Number of proposals 0.06442 0.028 0.023
Research team size 0.05008 0.018 0.005
Note: Education means training in grant writing. P = probability.
To further test the robustness of the selection, all original 30 variables were analyzed in a stepwise
regression model, and the same variables were identified as significant with p < .05.
ANALYSIS OF DEPENDENT VARIABLE––NUMBER OF AWARDS
For the dependent variable, number of awards, a univiariate regression analysis was performed on all
variables. The variables with p values <.10 from the univiariate regression were then selected for a
Poisson multiple regression analysis. The results of the univariate regression analysis are shown in Table
5, and the results of the Poisson regression analysis are shown in Table 6.
The identified significant variables for number of awards were defined as follows:
1. Consortium was described as two or more individuals, companies, organizations or
government agencies associating and participating in a common activity or pooling their
resources for achieving a common goal. Involvement in consortium activities was selected as
a significant variable or behavior with a 0.0001 p value as related to the number of grant
awards.
2. DOD is the Department of Defense, a federal agency that was charged with ensuring that the
U.S. military has superior resources to support its missions. The funding agency DOD was
selected as a significant variable or behavior with a 0.005 p value as related to the number of
grant awards.
3. Number of proposals was the data code for number of proposals submitted. This represents
the actual count of proposals submitted to any number of the six federal funding agencies
included in the study––DOD, DOE, NASA, USDA, NIH, and NSF and other agencies. The
number of proposals submitted was selected as a significant variable or behavior with a
<.0001 p value as related to the number of grant awards.
4. Association officer is the data code for the number of officer positions held by the P.I. in
professional organizations. This represents the actual count as reported by the P.I. The
number of offices held was selected as a significant variable or behavior with a 0.003 p value
as related to the number of grant awards.
5. Reduced teaching load was the data code for time released from teaching duties. This
represents whether the P.I. receives release time from teaching to perform research. Obtaining
release time was selected as a significant variable or behavior with a 0.004 p value as related
to the number of grant awards.
9. Research Management Review, Volume 15, Number 2
Fall/Winter 2006
9
Table 5. Results of Univariate Regression Analysis-Number of Awards
Variable
Parameter
Estimate
Standard
Error P-Value
Age -0.004 0.012 0.7070
Assistant Professor -0.276 0.397 0.4880
Associate Professor 0.059 0.329 0.8580
Biological Sciences -0.144 0.293 0.6230
Computer Science 0.149 0.402 0.7120
Consortium 3.053 0.750 <.0001
DOD 1.167 0.332 0.0001
DOE 0.892 0.336 0.0080
Education 0.107 0.297 0.7190
Facilities 0.262 0.104 0.0120
Full Professor 0.184 0.293 0.5300
Gender -0.201 0.337 0.5520
Institutional support 0.188 0.459 <.0001
Mathematics -0.717 0.435 0.1010
Association meetings 0.071 0.018 <.0001
Association membership 0.104 0.056 0.0630
Cash incentives 0.519 0.150 0.0010
NASA 0.798 0.372 0.0330
NIH 0.421 0.290 0.1480
Number of proposals 0.190 0.014 <.0001
Number of publications 0.014 0.005 0.0120
NSF 0.576 0.364 0.1150
Number of years as P.I. 0.003 0.011 0.8090
Association officer 0.476 0.161 0.0030
Other agencies 0.651 0.293 0.0270
People support 0.292 0.077 0.0001
Physical Sciences 0.504 0.318 0.1140
Reduced teaching load 0.766 0.355 0.0320
Research team size 0.064 0.011 <.0001
Tenured 0.282 0.369 0.4450
USDA 1.266 0.450 0.0050
Note: Education means training in grant writing. Other agencies means agencies reported
other than NIH, NSF, NASA, DOE, USDA, and DOD. P = probability.
Table 6. Summary of Poisson Regression Analysis for Dependent Variable-Number of Awards
Variable Estimate Standard Error P-value
Consortium 0.588 0.155 0.0001
DOD 0.249 0.090 0.0050
Number of proposals 0.032 0.003 <.0001
Association officer 0.121 0.041 0.0030
Reduced teaching load 0.272 0.095 0.0040
Note: P = probability.
10. Research Management Review, Volume 15, Number 2
Fall/Winter 2006
10
RESULTS
The regression analysis shows statistically significant relationships between the faculty behavior as
represented by the independent variables and the dollar value of awards; the number of awards shows that
the null hypotheses may be rejected for certain significant variables:
Reject the Null Hypotheses:
1. There is a relationship between the total dollar value of the awards (dependent variable) and
the independent variables (p < .05) education, number of proposals, research team size, and
association meetings with a p < .062.
2. There is a relationship between the number of awards (dependent variable) and the
independent variables (p <.05) consortium, DOD, number of proposals, association officer,
and reduced teaching load.
The variable, number of proposals submitted, is significant to both dependent variables. Other significant
variables for dollar value of awards and number of awards are not identical. Thus, the behaviors that
encourage faculty to pursue federal funding were identified. A demographic profile was identified using
the mean value of the population. The study population was described as: age 50, has not obtained
training in grant writing (fewer than 1%), has submitted six proposals, has published 17 articles, has 15
years of experience in submitting grant proposals, has not served as an officer of a professional
association (1%), and has a six-member research team. Most respondents were from the biological
sciences––42.97%. The NSF was the most frequently reported agency applied to––63.89%. Basic
research was performed most frequently––86.57%. Full professors more frequently responded––54.94%-
–while 81.08% of respondents were tenured. The categorical analysis showed that 88.32% of respondents
were motivated to get grant funding to build a professional reputation, and 27.83% were motivated by
institutional financial incentives. Specialized training in grant writing was reported by 52.58% of
respondents, and a reduced teaching load was reported by 20.44%.The other networking data showed that
talking with federal program officers (N = 142) and collaborative arrangements (N = 126) were the two
most frequent activities. No networking activities were reported by many of the respondents (N = 68).
The relationship between the dependent and independent variables is reported based on a backward
elimination regression analysis for dollar value of awards and a Poisson regression analysis for number of
awards. The results show significant variables (p < .05) that influenced the receipt and the dollar value of
grant awards. For dollar value of awards, the significant variables identified were: (a) education, (b)
association meetings, (c) number of proposals, and (d) research team size. For number of awards, the
significant variables identified were: (a) consortium, (b) DOD, (c) number of proposals, (d) association
officer, and (e) reduced teaching load.
This study resulted in new funding success models that can be applied across disciplines. Discipline or
field of study was included as an independent variable in the regression analysis, and the results for all
four disciplines showed p > .05; discipline was thus determined to not be a significant variable for
inclusion in the funding model. Two separate funding models were generated as shown in Figures 2 and
3. The two models were then combined to achieve a consolidated model for federal funding success
(Figure 4).
11. Research Management Review, Volume 15, Number 2
Fall/Winter 2006
11
Figure 2. The Dollar Value Model for Federal Funding Success. The significant variables (p < .05),
including association meetings at p < .062 for dollar value of awards are listed in order from bottom to
top. Research team size was the most significant variable for dollar value of awards.
In Figure 3, the number of awards success model is shown as a step process with number of proposals
being the foundation or first step in the success model. Other significant variables, such as consortiums,
association officer, reduced teaching load, and DOD, were added to complete the steps of the success
model.
Education in
Grant Writing
Association
Meetings
Number of
Proposals
Research
Team Size
Dollar Value of Awards Model
12. Research Management Review, Volume 15, Number 2
Fall/Winter 2006
12
Figure 3. The Number of Awards Model for Federal Funding Success. The variables are listed in
order of significance (p < .05) from bottom to top. Number of proposals is the most significant variable
for number of awards.
The two models, dollar value of awards and number of awards, can be combined to determine the model
or strategy for achieving overall success in getting federal funding in order to achieve a comprehensive
model for funding success. This comprehensive model (Figure 4) incorporates all significant variables.
Association
Officer
DOD
Reduced
Teaching Load
Consortium
Number of Awards Model
Number of
Proposals
13. Research Management Review, Volume 15, Number 2
Fall/Winter 2006
13
Figure 4. The Comprehensive Federal Funding Success Model. The significant variables for both
dollar value of awards and number of awards are combined from the most significant variable number of
proposals submitted to the least significant variable, attendance at association meetings.
Federal Funding Success Model
Number of
Proposals
Consortium
Arrangements
Association
Officer
Reduced
Teaching
Department of
Defense
Research
Team Size
Education in
Grant Writing
Association
Meetings
14. Research Management Review, Volume 15, Number 2
Fall/Winter 2006
14
DISCUSSION
These models could be used to obtain an understanding of the behaviors that lead to successful federal
funding in other disciplines. The anticipated results of applying these models are an increase in the dollar
value of awards and an increase in the number of awards. The literature review supported several
significant variables identified in this study. Ebong (1999) suggested that a model could be developed
based on a measurement of research activity. Subsequently, the model generated by this study could be
used to create generic strategies for developing research projects. Boyer and Cockriel (1998) stated that
the key to pursuing grant funding lies in discovering the individual motivators that attract faculty. This
identification would reduce barriers and stimulate the grant funding efforts. Demographic or profile data
with significant frequencies for the respondent population was identified in this study. Porter (2004)
stated that junior faculty often have little awareness of how to receive federal funds or how to become a
P.I. Porter suggested that too few mentors were available to help new faculty in becoming successful and
suggested that a training program would help. Mentor was not a significant variable in this study but
training in grant writing was a significant variable for the study population. Beir (2002) and McMillin
(2004) suggested that university incentive programs and facilities would help build faculty research
capacity. Many institutions “invest in faculty research by providing funding for start-up costs, research
grants, travel support, sabbaticals, and pre-tenure leaves [of absence]” (McMillin, 2004, p. 2). Research
universities’ reputations seem to follow research productivity; thus, such support is fair and needed
(McMillin, 2004). However, university incentive programs and facilities were not significant variables for
this study population. Ebong (1999) noted that previous experience with funding programs is directly
related to activity in seeking external funds. Ebong attempted to relate faculty capacity for research to a
persistence profile of funds-seeking. He noted that research development requires the input of resources
to produce consistent research goals and to accomplish the mission of the university. Ebong suggested
that to measure capacity, a model could be developed based on a measurement of research activity. The
results of this study support Ebong’s theory and generated a generic model for developing research
behavior. Hu and Gill (2000) reported that tenure status and academic rank had no significant correlation
to faculty research productivity. Also, tenure and academic rank are not significant variables for this study
population in obtaining grants.Thornley et al. (2002) noted the need for peer review processes to provide
applicants with feedback. For this study, few survey respondents (N = 5) reported the use of peer review
as behavior to gain success in obtaining grant awards. Daly (1994) reviewed the results of a Carnegie
Foundation study and found that “half of the respondents publications were merely counted and never
read even by those who insisted that these publications were needed for tenure or promotion” (p. 2).
Likewise, publication was not a significant variable in getting funding for this study population. Marsh
and Hattie (2002) attempted to determine the relationship between teaching and research with a meta-
analysis and correlation. They found a zero relation across disciplines among various measures of
productivity and measures of teaching quality. For this study, a reduction in teaching load was a
significant factor in obtaining funding and was correlated with obtaining grant funding.
In light of the findings, the research community could benefit from applying the funding success models
represented in this study. The success model as determined by this study can be applied across disciplines,
and this study offers a systematic approach to determining the significant behaviors that can be applied to
similar populations. To apply this model to other disciplines, the agencies selected as independent
variables should be those who usually fund programs in the disciplines under study. This model can be
applied to colleges and universities that focus on other objectives, such as student support, operating
expenses, or program costs, by replacing the research-related variables with those related to other
objectives.
15. Research Management Review, Volume 15, Number 2
Fall/Winter 2006
15
CONCLUSION
Findings from this study may increase understanding of the federal funding process by offering models
for funding success. Two strategies should be considered (dollar value of awards and number of awards),
but these strategies may be combined into one model for funding success. Such an understanding is
critical to the success of research faculty and institutions that want to support new research, to comply
with university research missions, to help federal agencies in meeting their goals and objectives, and to
expand the knowledge of science in society as a whole.
REFERENCES
1. Beier, L. M. (2002). Incentive, Reward, Development, or Welfare? Revision of an Integral Grant
Program. The Journal of Research Administration, 33(1), 5–11.
2. Boyer P., & Cockriel, I. (1998). Factors Influencing Grant Writing: Perceptions of Tenured and Non-
Tenured Faculty. SRA Journal, 29(3), 61–68.
3. Campbell, E. D. (2000). Federal-Funding Success Factors in Biology And Mathematics. Dissertation
Abstracts International, 61(12), 4678 (UMI No. 9999078).
4. Carnegie Foundation for the Advancement of Teaching. Graduate Instructional Program Description.
Retrieved November 18, 2005, from http://www.carnegiefoundation org/ classifications
5. Daly, W. T. (1994). Teaching and Scholarship: Adapting American Higher Education to Hard Times.
Journal of Higher Education, 65(1), 1-8.
6. Ebong, I. D. (1999). Relating Capacity to a Faculty Funding Persistence Profile. SRA Journal, 31(1),
23-34.
7. Executive Office of the President of the United States. (2000). Analysis of Facilities and Administrative
Costs at Universities. Washington, DC: Office of Science and Technology Policy.
8. Fairweather, J. S. (2002). The Mythologies of Faculty Productivity: Implications for Institutional
Policy and Decision-making. Journal of Higher Education, 73(1), 1-14.
9. Fountain, A. W., III (2004). Transforming Defense Basic Research Strategy. Parameters, 34(4), 1-10.
10. Hu, Q. & Gill, G. (2000). IS Faculty Research Productivity: Influential Factors and Implications.
Information Resources Management Journal, 13(2), 15-35.
11. Marsh, H. W., & Hattie, J. (2002). The Relation Between Research Productivity and Teaching
Effectiveness: Complementary, Antagonistic, or Independent Constructs? Journal of Higher Education,
73(5), 1-22.
12. McMillin, L. (2004). Creating the “Complete Scholar”: Academic Professionalism in the 21st
Century. Liberal Education, 90(2), 1-5.
16. Research Management Review, Volume 15, Number 2
Fall/Winter 2006
16
13. National Institutes of Health. (2005). NIH Guide for Grants and Contracts. Retrieved November 26,
2005, from http://grants.nih.gov/grants/guide/index.html
14. National Science Foundation. (2005). Federal Science and Engineering Obligations to Academic and
Nonprofit Institutions Reached Record Highs in FY 2003. Retrieved November 17, 2005, from
http://www.nsf.gov/statistics/infbrief/nsf05321/
15. Oxford Journals. (2006). Poisson Regression Analysis, Chapter 13. Retrieved October 16, 2006, from
http://www.oxfordjournals.org/tropej/online/ma_chap13.pdf
16. Porter, R. (2004). Off the Launching Pad: Stimulating Proposal Development by Junior Faculty. The
Journal of Research Administration, 31(1), 6–11.
17. Santos, J. A. (1999). Cronbach’s Alpha: A Tool for Assessing the Reliability of Scales. Journal of
Extension, 37(2), 1-5.
18. Stigler, S. M. (1993). Competition and the Research Universities. Daedalus, 122(4), 157.
19. Survey of Federal Science and Engineering Support to Universities, Colleges, and Nonprofit
Institutions: Fiscal Year 2002—Table B-16 [Data file]. Arlington, VA: National Science Foundation.
Retrieved January 11, 2006, from http://www.nsf.gov/ statistics/nsf05309/sectb.htm#ranked
20. Tang, T. L., & Chamberlain, M. (1997). Attitudes toward Research and Teaching: Differences
between Administrators and Faculty Members. Journal of Higher Education, 68(2), 212.
21. Thornley, R., Spence, M. W., Taylor, M., & Magnan, J. (2002). New Decision Tool to Evaluate
Award Selection Process. The Journal of Research Administration, 33(2), 49–56.
ABOUT THE AUTHOR
Sharon Stewart Cole, Ph.D., has twenty years of experience in contracts and grants administration and has
served as a director of sponsored programs. She has recently been selected as a Senior Research Scientist
where she plans to focus on disparity in health care issues at the Nevada Cancer Institute.