1. Disposition Exenatide QW + MET Placebo + MET
Randomized, n 61 56
Withdrew, n (%) 8 (13.1) 8 (14.3)
Adverse event 3 (4.9) 2 (3.6)
Lost to follow-up 2 (3.3) 3 (5.4)
Pregnancy 1 (1.6) 0 (0.0)
Protocol violation 1 (1.6) 0 (0.0)
Withdrew consent 1 (1.6) 2 (3.6)
Other 0 (0.0) 1 (1.8)
Completed, n (%) 53 (86.9) 48 (85.7)
Demographics, modified ITTa
(n=60) (n=56)
Age, y 55 ± 11 56 ± 10
Male, n (%) 33 (55.0) 32 (57.1)
Race, n (%)
White 52 (86.7) 46 (82.1)
Black or African American 3 (5.0) 5 (8.9)
Asian 3 (5.0) 4 (7.1)
Native Hawaiian or Pacific Islander 1 (1.7) 0 (0.0)
Other 1 (1.7) 1 (1.8)
Duration of diabetes, yb
9 ± 6 10 ± 8
Metformin dose, mg 1925 ± 180 1875 ± 218
Body weight, kg 90.5 ± 19.3 90.0 ± 19.1
BMI, kg/m2
32.0 ± 6.2 31.6 ± 5.4
A1C, % 8.2 ± 1.1 8.0 ± 0.9
FPG, mg/dL 178 ± 50 168 ± 54
2-h mean PPG, mg/dL 221 ± 54 221 ± 51
24-h mean glucose, mg/dL 186 ± 42 184 ± 43
Distance traveled, mg/dL 755 ± 161 730 ± 135
Total energy, (mg/(dL*h))2
12,341 ± 14,096 9953 ± 5293
Data are mean ± standard deviation, unless otherwise noted.
a
One patient in the exenatide QW group was not treated due to pregnancy and excluded from the analysis.
b
Data not available for all patients. Exenatide QW + MET, n=58; placebo + MET, n=55.
BMI, body mass index; FPG, fasting plasma glucose; ITT, intent-to-treat; PPG, postprandial glucose;
QW, once weekly.
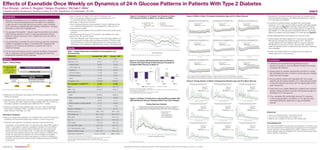
Effects of Exenatide Once Weekly on Dynamics of 24-h Glucose Patterns in Patients With Type 2 Diabetes
Poul Strange,1
James A. Ruggles,2
Sergey Zhuplatov,2
Michael F. Miller1
1
Integrated Medical Development, Princeton Junction, NJ, USA; 2
AstraZeneca, Fort Washington, PA, USA 1048-P
Presented at the American Diabetes Association’s 76th Scientific Sessions (ADA 2016), New Orleans, LA, June 10–14, 2016.Supported by:
Conclusions
• Treatment with exenatide QW significantly reduced
glycemic fluctuations, such as distance traveled and energy,
compared with placebo
• Energy spectrum analysis showed that reductions in energy
with exenatide QW were confined to slower glucose changes
rather than fast changes
• Among patients treated with exenatide QW, the younger
patients with the highest baseline 24-h mean glucose tended
to have the highest total energy with the higher peaks at the
lower frequencies
• There were more notable differences in patients who received
placebo; energy tended to increase with decreasing age and
increasing 24-h mean glucose
• Thus, exenatide QW substantially reduced 24-h glucose
in the overall population, but effects on 24-h glucose were
manifested differently depending on age and baseline
glucose
• Exenatide QW numerically reduced total energy from baseline across
almost all baseline subgroups, with differences depending on age and
24-h mean glucose at baseline
• According to the MADz analysis, exenatide QW caused greater
reductions in 24-h mean glucose profiles in patients with higher baseline
24-h mean glucose (Figure 5); conversely, energy spectrum analysis
demonstrated modest effects on the energy spectrum in patients with
high baseline 24-h mean glucose but substantial effects on the energy
spectrum in patients with lower baseline 24-h mean glucose (Figure 6)
• Similar differential effects were observed as a function of age
• In older patients with higher baseline 24-h mean glucose, exenatide
QW reduced overall glucose equally throughout 24 h, whereas in
younger patients with lower baseline mean 24-h glucose, exenatide
QW dampened excursions in the 24-h glucose profile, resulting in a
profile that appeared similar to profiles previously observed in individuals
without diabetes
• Results were similar at Week 4 for energy spectrums analyzed by
baseline age and 24-h mean glucose
References
1. Suh S, et al. Diabetes Metab J. 2015;39(4):273–282.
2. Grimm M, et al. Postgrad Med. 2013;125(3):47–57.
3. Miller M, et al. J Diabetes Sci Technol. 2007;1(5):630–638.
Acknowledgments
The study (NCT02288273) was supported by AstraZeneca. The authors would
like to acknowledge Karen Goldsborough of AstraZeneca for her management
of study operations. Amanda Sheldon, PhD, CMPP, of inScience Communi-
cations, Springer Healthcare (Philadelphia, PA, USA), provided medical writing
support funded by AstraZeneca.
Figure 2. Comparison of Change From Baseline in Mean
24-h Glucose Profiles at Week 10, as Shown by MADz
Cl, confidence interval; MET, metformin; QW, once weekly; SE, standard error.
0 1 2 3 4 5 6 7 8 9 10 11 12 13 14 15 16 17 18 19 20 21 22 23 24
Glucose(mg/dL)
Exenatide QW + MET
Placebo + MET
Exenatide QW – Placebo
Zero
Upper 95% Cl
Lower 95% Cl
± 2x SE of treatment difference
–60
30
20
10
0
–10
–20
–30
–40
–50
Time of Day (hours)
Figure 3. Exenatide QW Significantly Reduced Distance
Traveled and Total Energy of Daily Glucose Fluctuations
Compared With Placebo at Week 10
Data are LS mean change from baseline ± standard error.
Total energy = sum of squared frequency times amplitude of Fourier coefficients for the 24-h individual average glucose
curves averaged for a week over 24 h.
*P<0.01, treatment difference between LS mean changes from baseline.
LS, least-squares; MET, metformin; QW, once weekly.
–100
–40
–60
–80
40
20
–20
0
–61.5
–5.2
–70.2
*
10.8
ΔinDistanceTraveled(mg/dL)
Week 4 Week 10
–12,000
0
–4000
–8000
20,000
12,000
16,000
4000
8000
–4189
9999
–2463
*
2430
ΔinTotalEnergy(mg/(dL*h))2
Week 4 Week 10
Exenatide QW + MET (n=60) Placebo + MET (n=56)
Figure 4. At Week 10, Reductions in Energy With Exenatide QW
Affected Slower Glucose Changes Rather Than Fast Changes
880
820
760
700
640
580
520
460
400
340
280
220
160
100
40
0
0 1 2 3 4 5 6 7 8 9
Number of Cycles per 24 Hours
10 11 12 13 14 15 16 17 18 19 20 21 22 23 24
EnergyComponent(mg/(dL*h))2
Exenatide QW Posterior Geometric Mean Total Energy (24 cycles) = 7171 (mg/(dL*h))2
Placebo Posterior Geometric Mean Total Energy (24 cycles) = 9947 (mg/(dL*h))2
95% Probability Bounds on the Difference (Exenatide QW – PBO): –4453 to –587 (mg/(dL*h))2
Energy Spectrum Analysis
Exenatide QW + MET
Placebo + MET
60% Probability Bounds
95% Probability Bounds
99.6% Probability Bounds
Figure 6. Energy Spectra at Week 10 Analyzed by Baseline Age and 24-h Mean Glucose
Figure 5. MADz at Week 10 Analyzed by Baseline Age and 24-h Mean Glucose
0 1 2 3 4 5 6 7 8 9 10 11 12 13 14 15 16 17 18 19 20 21 22 23 24
CGMGlucose(mg/dL)
Exenatide QW + MET Posterior Mean
Placebo + MET Posterior Mean
Exenatide QW + MET: Posterior mean 24-h glucose = 133.6 mg/dL with 95% probability bounds: 113.6–153.8 mg/dL
Placebo + MET: Posterior mean 24-h glucose = 150.8 mg/dL with 95% probability bounds: 128.5–173.2 mg/dL
Difference (Exenatide QW – Placebo): Posterior mean 24-h glucose = –17.2 mg/dL with 95% probability bounds: –47.1 to 13.2 mg/dL
80
270
250
230
210
190
170
150
130
110
90
Time of Day (hours)
0 1 2 3 4 5 6 7 8 9 10 11 12 13 14 15 16 17 18 19 20 21 22 23 24
CGMGlucose(mg/dL)
Exenatide QW + MET Posterior Mean
Placebo + MET Posterior Mean
Exenatide QW + MET: Posterior mean 24-h glucose = 154.8 mg/dL with 95% probability bounds: 139.9–169.8 mg/dL
Placebo + MET: Posterior mean 24-h glucose = 179.9 mg/dL with 95% probability bounds: 161.6–197.9 mg/dL
Difference (Exenatide QW – Placebo): Posterior mean 24-h glucose = –25.1 mg/dL with 95% probability bounds: –48.6 to –1.6 mg/dL
80
270
250
230
210
190
170
150
130
110
90
Time of Day (hours)
0 1 2 3 4 5 6 7 8 9 10 11 12 13 14 15 16 17 18 19 20 21 22 23 24
CGMGlucose(mg/dL)
Exenatide QW + MET Posterior Mean
Placebo + MET Posterior Mean
Exenatide QW + MET: Posterior mean 24-h glucose = 173.9 mg/dL with 95% probability bounds: 156.6–192.1 mg/dL
Placebo + MET: Posterior mean 24-h glucose = 206.2 mg/dL with 95% probability bounds: 185.3–227.1 mg/dL
Difference (Exenatide QW – Placebo): Posterior mean 24-h glucose = –32.3 mg/dL with 95% probability bounds: –59.3 to –4.5 mg/dL
80
270
250
230
210
190
170
150
130
110
90
Time of Day (hours)
0 1 2 3 4 5 6 7 8 9 10 11 12 13 14 15 16 17 18 19 20 21 22 23 24
CGMGlucose(mg/dL)
Exenatide QW + MET Posterior Mean
Placebo + MET Posterior Mean
Baseline age = 45 y
Baseline 24-h mean glucose = 140 mg/dL
Exenatide QW + MET: Posterior mean 24-h glucose = 128 mg/dL with 95% probability bounds: 111.3–144.6 mg/dL
Placebo + MET: Posterior mean 24-h glucose = 151 mg/dL with 95% probability bounds: 134.1–167.8 mg/dL
Difference (Exenatide QW – Placebo): Posterior mean 24-h glucose = –23 mg/dL with 95% probability bounds: –46.6 to 0.6 mg/dL
80
270
250
230
210
190
170
150
130
110
90
Time of Day (hours)
0 1 2 3 4 5 6 7 8 9 10 11 12 13 14 15 16 17 18 19 20 21 22 23 24
CGMGlucose(mg/dL)
Exenatide QW + MET Posterior Mean
Placebo + MET Posterior Mean
Exenatide QW + MET: Posterior mean 24-h glucose = 149.1 mg/dL with 95% probability bounds: 137.9–160.2 mg/dL
Placebo + MET: Posterior mean 24-h glucose = 180.1 mg/dL with 95% probability bounds: 168.5–191.4 mg/dL
Difference (Exenatide QW – Placebo): Posterior mean 24-h glucose = –31 mg/dL with 95% probability bounds: –47.4 to –14.7 mg/dL
80
270
250
230
210
190
170
150
130
110
90
Time of Day (hours)
0 1 2 3 4 5 6 7 8 9 10 11 12 13 14 15 16 17 18 19 20 21 22 23 24
CGMGlucose(mg/dL)
Exenatide QW + MET Posterior Mean
Placebo + MET Posterior Mean
Exenatide QW + MET: Posterior mean 24-h glucose = 168.3 mg/dL with 95% probability bounds: 152.6–184.2 mg/dL
Placebo + MET: Posterior mean 24-h glucose = 206.4 mg/dL with 95% probability bounds: 190.2–222.8 mg/dL
Difference (Exenatide QW – Placebo): Posterior mean 24-h glucose = –38.1 mg/dL with 95% probability bounds: –60.9 to –15.3 mg/dL
80
270
250
230
210
190
170
150
130
110
90
Time of Day (hours)
0 1 2 3 4 5 6 7 8 9 10 11 12 13 14 15 16 17 18 19 20 21 22 23 24
CGMGlucose(mg/dL)
Exenatide QW + MET Posterior Mean
Placebo + MET Posterior Mean
Exenatide QW + MET: Posterior mean 24-h glucose = 123.3 mg/dL with 95% probability bounds: 104.1–142.3 mg/dL
Placebo + MET: Posterior mean 24-h glucose = 151.1 mg/dL with 95% probability bounds: 131.8–170.6 mg/dL
Difference (Exenatide QW – Placebo): Posterior mean 24-h glucose = –27.8 mg/dL with 95% probability bounds: –55.3 to –0.6 mg/dL
80
270
250
230
210
190
170
150
130
110
90
Time of Day (hours)
0 1 2 3 4 5 6 7 8 9 10 11 12 13 14 15 16 17 18 19 20 21 22 23 24
CGMGlucose(mg/dL)
Exenatide QW + MET Posterior Mean
Placebo + MET Posterior Mean
Exenatide QW + MET: Posterior mean 24-h glucose = 144.5 mg/dL with 95% probability bounds: 129.4–159.4 mg/dL
Placebo + MET: Posterior mean 24-h glucose = 180.2 mg/dL with 95% probability bounds: 164.1–195.8 mg/dL
Difference (Exenatide QW – Placebo): Posterior mean 24-h glucose = –35.7 mg/dL with 95% probability bounds: –58.1 to –13.5 mg/dL
80
270
250
230
210
190
170
150
130
110
90
Time of Day (hours)
0 1 2 3 4 5 6 7 8 9 10 11 12 13 14 15 16 17 18 19 20 21 22 23 24
CGMGlucose(mg/dL)
Exenatide QW + MET Posterior Mean
Placebo + MET Posterior Mean
Exenatide QW + MET: Posterior mean 24-h glucose = 163.6 mg/dL with 95% probability bounds: 144.1–182.9 mg/dL
Placebo + MET: Posterior mean 24-h glucose = 206.5 mg/dL with 95% probability bounds: 186.4–226.4 mg/dL
Difference (Exenatide QW – Placebo): Posterior mean 24-h glucose = –42.9 mg/dL with 95% probability bounds: –71 to –15.1 mg/dL
80
270
250
230
210
190
170
150
130
110
90
Time of Day (hours)
Baseline age = 45 y
Baseline 24-h mean glucose = 182 mg/dL
Baseline age = 45 y
Baseline 24-h mean glucose = 220 mg/dL
Baseline age = 65 y
Baseline 24-h mean glucose = 140 mg/dL
Baseline age = 65 y
Baseline 24-h mean glucose = 182 mg/dL
Baseline age = 65 y
Baseline 24-h mean glucose = 220 mg/dL
Baseline age = 56 y
Baseline 24-h mean glucose = 140 mg/dL
Baseline age = 56 y
Baseline 24-h mean glucose = 182 mg/dL
Baseline age = 56 y
Baseline 24-h mean glucose = 220 mg/dL
0 1 2 3 4 5 6 7 8 9
Number of Cycles per 24 Hours
10 11 12 13 14 15 16 17 18 19 20 21 22 23 24
EnergyComponent(mg/(dL*h))2
Exenatide QW + MET (n=51)
Placebo + MET (n=48)
60% Probability Bounds
95% Probability Bounds
99.6% Probability Bounds
Exenatide QW + MET Posterior Geometric Mean Total Energy (24 cycles) = 7910 (mg/(dL*h))2
Placebo + MET Posterior Geometric Total Energy (24 cycles) = 10,509 (mg/(dL*h))2
95% Probability Bounds on the Ratio (Exenatide QW/Placebo) 0.46 to 1.24
0
100
200
300
400
500
600
700
800
900
1000
1150
1300
0
100
200
300
400
500
600
700
800
900
1000
1150
1300
0
100
200
300
400
500
600
700
800
900
1000
1150
1300
0
100
200
300
400
500
600
700
800
900
1000
1150
1300
0
100
200
300
400
500
600
700
800
900
1000
1150
1300
0
100
200
300
400
500
600
700
800
900
1000
1150
1300
0
100
200
300
400
500
600
700
800
900
1000
1150
1300
0
100
200
300
400
500
600
700
800
900
1000
1150
1300
0
100
200
300
400
500
600
700
800
900
1000
1150
1300
0 1 2 3 4 5 6 7 8 9
Number of Cycles per 24 Hours
10 11 12 13 14 15 16 17 18 19 20 21 22 23 24
EnergyComponent(mg/(dL*h))2
Exenatide QW + MET (n=51)
Placebo + MET (n=48)
60% Probability Bounds
95% Probability Bounds
99.6% Probability Bounds
Exenatide QW + MET Posterior Geometric Mean Total Energy (24 cycles) = 8850 (mg/(dL*h))2
Placebo + MET Posterior Geometric Total Energy (24 cycles) = 12,156 (mg/(dL*h))2
95% Probability Bounds on the Ratio (Exenatide QW/Placebo) 0.49 to 1.07
0 1 2 3 4 5 6 7 8 9
Number of Cycles per 24 Hours
10 11 12 13 14 15 16 17 18 19 20 21 22 23 24
EnergyComponent(mg/(dL*h))2
Exenatide QW + MET (n=51)
Placebo + MET (n=48)
60% Probability Bounds
95% Probability Bounds
99.6% Probability Bounds
Exenatide QW + MET Posterior Geometric Mean Total Energy (24 cycles) = 9796 (mg/(dL*h))2
Placebo + MET Posterior Geometric Total Energy (24 cycles) = 13,867 (mg/(dL*h))2
95% Probability Bounds on the Ratio (Exenatide QW/Placebo) 0.45 to 1.12
0 1 2 3 4 5 6 7 8 9
Number of Cycles per 24 Hours
10 11 12 13 14 15 16 17 18 19 20 21 22 23 24
EnergyComponent(mg/(dL*h))2
Exenatide QW + MET (n=51)
Placebo + MET (n=48)
60% Probability Bounds
95% Probability Bounds
99.6% Probability Bounds
Exenatide QW + MET Posterior Geometric Mean Total Energy (24 cycles) = 7171 (mg/(dL*h))2
Placebo + MET Posterior Geometric Total Energy (24 cycles) = 9947 (mg/(dL*h))2
95% Probability Bounds on the Ratio (Exenatide QW/Placebo) 0.55 to 0.94
0 1 2 3 4 5 6 7 8 9
Number of Cycles per 24 Hours
10 11 12 13 14 15 16 17 18 19 20 21 22 23 24
EnergyComponent(mg/(dL*h))2
Exenatide QW + MET (n=51)
Placebo + MET (n=48)
60% Probability Bounds
95% Probability Bounds
99.6% Probability Bounds
Exenatide QW + MET Posterior Geometric Mean Total Energy (24 cycles) = 7938 (mg/(dL*h))2
Placebo + MET Posterior Geometric Total Energy (24 cycles) = 11,348 (mg/(dL*h))2
95% Probability Bounds on the Ratio (Exenatide QW/Placebo) 0.48 to 1.02
Exenatide QW + MET Posterior Geometric Mean Total Energy (24 cycles) = 6682 (mg/(dL*h))2
Placebo + MET Posterior Geometric Total Energy (24 cycles) = 9631 (mg/(dL*h))2
95% Probability Bounds on the Ratio (Exenatide QW/Placebo) 0.44 to 1.1
0 1 2 3 4 5 6 7 8 9
Number of Cycles per 24 Hours
10 11 12 13 14 15 16 17 18 19 20 21 22 23 24
EnergyComponent(mg/(dL*h))2
Exenatide QW + MET (n=51)
Placebo + MET (n=48)
60% Probability Bounds
95% Probability Bounds
99.6% Probability Bounds
Exenatide QW + MET Posterior Geometric Mean Total Energy (24 cycles) = 6037 (mg/(dL*h))2
Placebo + MET Posterior Geometric Total Energy (24 cycles) = 8442 (mg/(dL*h))2
95% Probability Bounds on the Ratio (Exenatide QW/Placebo) 0.5 to 1.03
0 1 2 3 4 5 6 7 8 9
Number of Cycles per 24 Hours
10 11 12 13 14 15 16 17 18 19 20 21 22 23 24
EnergyComponent(mg/(dL*h))2
Exenatide QW + MET (n=51)
Placebo + MET (n=48)
60% Probability Bounds
95% Probability Bounds
99.6% Probability Bounds
Exenatide QW + MET Posterior Geometric Mean Total Energy (24 cycles) = 6410 (mg/(dL*h))2
Placebo + MET Posterior Geometric Total Energy (24 cycles) = 8599 (mg/(dL*h))2
95% Probability Bounds on the Ratio (Exenatide QW/Placebo) 0.5 to 1.11
0 1 2 3 4 5 6 7 8 9
Number of Cycles per 24 Hours
10 11 12 13 14 15 16 17 18 19 20 21 22 23 24
EnergyComponent(mg/(dL*h))2
Exenatide QW + MET (n=51)
Placebo + MET (n=48)
60% Probability Bounds
95% Probability Bounds
99.6% Probability Bounds
Exenatide QW + MET Posterior Geometric Mean Total Energy (24 cycles) = 5396 (mg/(dL*h))2
Placebo + MET Posterior Geometric Total Energy (24 cycles) = 7298 (mg/(dL*h))2
95% Probability Bounds on the Ratio (Exenatide QW/Placebo) 0.47 to 1.16
0 1 2 3 4 5 6 7 8 9
Number of Cycles per 24 Hours
10 11 12 13 14 15 16 17 18 19 20 21 22 23 24
EnergyComponent(mg/(dL*h))2
Exenatide QW + MET (n=51)
Placebo + MET (n=48)
60% Probability Bounds
95% Probability Bounds
99.6% Probability Bounds
Baseline age = 45 y
Baseline 24-h mean glucose = 140 mg/dL
Baseline age = 45 y
Baseline 24-h mean glucose = 182 mg/dL
Baseline age = 45 y
Baseline 24-h mean glucose = 220 mg/dL
Baseline age = 65 y
Baseline 24-h mean glucose = 140 mg/dL
Baseline age = 65 y
Baseline 24-h mean glucose = 182 mg/dL
Baseline age = 65 y
Baseline 24-h mean glucose = 220 mg/dL
Baseline age = 56 y
Baseline 24-h mean glucose = 140 mg/dL
Baseline age = 56 y
Baseline 24-h mean glucose = 182 mg/dL
Baseline age = 56 y
Baseline 24-h mean glucose = 220 mg/dL
–– Distance traveled: arc length of the mean 24-h glucose curve
• Sum of the absolute difference in glucose concentrations for 24 h
of consecutive glucose measurement
–– Total energy of daily glucose fluctuation
• Sum of squared frequency times amplitude of Fourier coefficients for the
24-h individual average glucose curves averaged for a week over 24 h
–– Energy spectrum analysis
• Individual squared frequency times amplitude Fourier terms plotted versus
frequency
–– Total energy analyzed by age (45, 56, and 65 y) with baseline 24-h mean
glucose (140, 182, and 220 mg/dL)
• This was a Bayesian linear model analysis of the total energy together with
the components of energy within the frequency domain. The linear model
included study arm as well as baseline age and 24-h mean glucose. Prior
distributions on the regression coefficients were chosen to be relatively flat
117 Adult Patients
Age 18–75 y
A1C ≥7% to ≤10%
on MET XR
Background diabetes treatment
MET XR
Randomized Treatment
10-wk intervention period
Week
Follow-up
0
CGM CGM CGM
4 10
4-wk lead-in
period
Exenatide QW 2.0 mg (n=61)
Placebo (n=56)
Methods
CGM, continuous glucose monitoring; MET XR, metformin extended release.
• Beginning at the first lead-in visit, patients with T2D were counseled on medical
nutrition and exercise
• Following lead-in, patients were randomized 1:1 to receive double-blind exenatide
QW 2.0 mg plus open-label metformin extended release (XR) 1500 or 2000 mg
once daily, or placebo microspheres plus metformin XR for 10 weeks
• Glucose concentration was measured every 5 min over 7 days during the last
week of lead-in (baseline), Week 4, and Week 10 using a Dexcom G4®
CGM
system (Dexcom, San Diego, CA, USA)
Statistical Analyses
• Efficacy and safety were assessed in the modified intent-to-treat (ITT) population,
consisting of all randomized patients who received ≥1 dose of study drug
• CGM data were analyzed for exploratory measures of glucose fluctuation
–– Comparison of the adjusted mean 24-h glucose curves using CGM profiles at
Week 10 was based on maximum amplitude of deviation from zero (MADz).
Fourier coefficients for individual patient CGM data from each period were
derived using 24 h as the longest cycle.3
The data were then aggregated
across the whole treatment group for that period resulting in a defined group
function for each period by treatment from which changes from baseline
and treatment difference functions were derived. To control for multiplicity, a
bootstrap was performed to define the 95% confidence bounds of the MADz
by time point
Figure 1. Study Design
Introduction
• Although normalization of A1C for patients with type 2 diabetes
(T2D) is an important therapeutic goal, the ability of a medication
to approximate normal daily glucose excursions is also of interest
when optimizing a patient’s glucose-lowering medications,1
as large
fluctuations confer risk of hypoglycemia
• The glucagon-like peptide-1 receptor agonist exenatide once weekly
(QW) improves glycemic control in a glucose-dependent manner
leading to robust reductions in A1C, weight loss, and a low risk of
hypoglycemia2
• This randomized controlled trial used continuous glucose monitoring
(CGM) to investigate the effects of exenatide QW compared with
placebo on 24-h glucose fluctuations in patients with T2D on
metformin therapy
• For this study, the objective was to examine the effects of exenatide
QW on exploratory outcomes related to daily glucose control by
analyzing the dynamics of 24-h glucose
Results
Table 1. Patient Disposition and Baseline Demographics and
Characteristics
The 60% credible interval of the mean difference, Exenatide QW – Placebo, excludes 0 if the study arm means fall outside of the tan region.
The 95% credible interval of the mean difference, Exenatide QW – Placebo, excludes 0 if the study arm means fall outside of the blue region.
The 95% credible interval of the maximum absolute difference, Exenatide QW – Placebo, excludes 0 if the study arm means fall outside of the dotted curves.
MET, metformin; QW, once weekly.