Google - Investment Analysis & Mgmt 120213 10pm v4 final
doc
1. Case 2 - Group #6
KeepSwitch
Recommendations:
We recommend that KeepSwitch change their price strategy to cover their fixed and variable
costs and set a minimum ad budget of 8.10% of sales
(1) Problem
KeepSwitch does not have a marketing plan and is not sure what they should have as a
marketing budget.
Develop a marketing plan that will help KeepSwitch obtain at least 1 % market share and 8%
marketing budget.
(2) SMART objectives/measure of success
a) Turn a profitinthe firstyear
b) Obtainat least1% marketshare or 2135 customersinthe firstyear
c) Generate a4$ return onmarketinginvestment
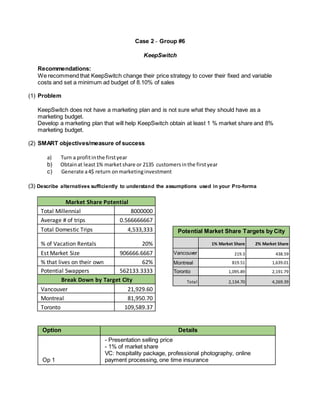
(3) Describe alternatives sufficiently to understand the assumptions used in your Pro-forma
Market Share Potential
Total Millennial 8000000
Average # of trips 0.566666667
Total Domestic Trips 4,533,333
% of Vacation Rentals 20%
Est Market Size 906666.6667
% that lives on their own 62%
Potential Swappers 562133.3333
Break Down by Target City
Vancouver 21,929.60
Montreal 81,950.70
Toronto 109,589.37
Option Details
Op 1
- Presentation selling price
- 1% of market share
VC: hospitality package, professional photography, online
payment processing, one time insurance
Potential Market Share Targets by City
1% Market Share 2% Market Share
Vancouver 219.3 438.59
Montreal 819.51 1,639.01
Toronto 1,095.89 2,191.79
Total 2,134.70 4,269.39
2. Op 2
- Presentation selling price
- 2% of market share
VC: hospitality package, online payment processing, one time
insurance
Op 3
- Increased selling price - 100 per person
- 1% Market share, no photography, 80$ one time insurances
Op 4
(Recommended)
- Increased selling price - (200 + 100 for an additional
person)
- 1% market share
- all possible VC
- increased ad budget to 8.1% of sales
Fixed Costs: Price Additional Details
App $50,000
Customer Support x 1 Salary $20,250 (Minimum wage) $11.25 * 37.5 * 4 * 12
Website Domain $120 $10 (Domain name)/month
Variable Costs:
Photography $50
Hospitality Package $2.00
Paymentech $1.20
Insurance 80
Option 4 – Direct Marketing Strategy
Tactic
Cost of
Tactic
Number of
Contacts
Expected
RR%
Expected #
Swaps
Total
Cost
Cost per
response ROI
Targeted
Mail 0.8 37,500 3.70% 1387.5 30000 21.6 13.875
Online
Marketing 1 10,000 1.10% 110 10000 90.91 3.3
Email 0.15 28,500 2.10% 598.5 4275 7.14 42
Telephone 15 500 9.50% 47.5 7500 157.89 1.9
(4) Complete Proforma/breakeven analysis
3. Assumptions
% Change are all based on base of originally presented information (option 1)
Quantity is 2 homes or 1 swap
Travel for 1 week - millennials are likely to travel longer
Selling price is based on two people. 85% of people are more likely to travel in pairs or
more.
Option 1 Option 2 Option 3 Option 4
Quantity 2135 4270 2135 2135 1
Selling Price $120 $120 $200 $300 2
VC/Unit $53.20 $3.20 $83.2 $133 3
Contribution/per unit $66.80 $116.80 $116.80 $167.00 4
5
Pro-forma Income Statement
Sales $256,200.00 $512,400.00 $427,000 $640,500 6
COGS $113,582.00 $13,664.00 $249,368 $356,545.00 7
Gross Profit $142,618.00 $498,736.00 $177,632 $283,955 8
Advertising Costs $8,967.00 $86,001.22 $14,945 $51,881 9
Other Fixed costs $70,370.00 $70,370.00 $70,370.00 $70,370.00 10
Total Fixed Costs $79,337.00 $156,371.22 $85,315 $122,251 11
Net Profit $63,281.00 $342,364.78 $92,317 $161,705 12
Analysis
Gross Margin 55.67% 97.33% 41.60% 44.33% 13
Net Profit Margin 24.70% 66.82% 21.62% 25.25% 14
Advertising as % of sales 3.50% 16.78% 3.50% 8.10% 15
% Change in Sales n/a 100.00% 66.67% 150.00% 16
% Change in COGS n/a -87.97% 119.55% 213.91% 17
% Change in Advertising n/a 859.09% 66.67% 478.57% 18
% Change in Net Profit n/a 441.02% 45.88% 155.53% 19
Breakeven 1188 1339 731 732 20
Margin of Safety 44.37% 68.65% 65.76% 65.71% 21
ROMI 14.90 4.80 10.89 4.47 22
23
4. (5) Recommendation: Option 4
1. Returns highest net profit of $161,705
And will still allow you to invest in more luxury features like professional
photography
2. Breakeven of 732 units (lowest out of the 4 options)
3. More conservative market share 1%
4. Highest contribution $133
5. Lower ad % of sales at 8% but high acquisition
(6) Conclusions
Overall, we wanted to deliver an option that would allow KeepSwitch to be available in more
cities more quickly. By developing a healthy bottom line in the first year, they will have enough
capital to do so.
Sources:
Insurance costing:
http://www.lovehomeswap.com/swap-protection
Ad budget:
http://rentalsunited.com/blog/vacation-rental-industry-stats-infographic/
Market Potential
http://en.destinationcanada.com/sites/default/files/pdf/Research/Industry-
research/millennialreport_en.pdf
Response benchmarks
http://www.marketingcharts.com/traditional/direct-media-response-rate-cpa-and-roi-
benchmarks-53645/
Media Cost Benchmarks
https://www.onlinemarketinginstitute.org/blog/2013/06/why-direct-mail-still-yields-the-lowest-
cost-per-lead-and-highest-conversion-rate/
Peer Evaluation
Group Member/Record # Evaluation
Veronika Bidlova Rec#1 30
Leona Houston Rec#14 30
Arda Ozcelik Rec #46 10
Gayoung Lee Rec#22 30