
Recommended
More Related Content
What's hot
What's hot (20)
Similar to The Electrophysiology of the Heart
Similar to The Electrophysiology of the Heart (20)
Recently uploaded
Recently uploaded (20)
The Electrophysiology of the Heart
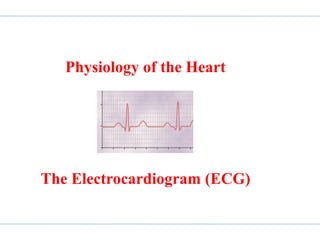
- 1. Physiology of the Heart The Electrocardiogram (ECG)
- 2. Electrocardiogram • Electric current generated by the heart is conducted through body fluids • A small portion reach the surface of the body, which can be detected and recorded by electrodes → ECG (not record of single AP) • ECG → represents the sum of electrical activity in all cardiac muscles undergoing depolarization and repolarization • The waves represent comparison in voltage detected by electrodes at 2 different points on the body surface (not actual AP) 1/13/2022 2 ECG CVS Physiology
- 3. ECG Recording 1. Standard limb leads • Recording electrodes placed on both arms and legs (wrist and ankle) • Appendages act as extensions of recording electrodes • Voltage measurements are made between points that form equilateral triangle over the thorax (Einthoven’s triangle) • Any ECG trace is recording of voltage difference measured between any 2 vertices of Einthoven triangle 1/13/2022 3 ECG CVS Physiology
- 4. 1/13/2022 4 ECG CVS Physiology Einthoven's electrocardiographic conventions
- 5. ECG Recording 1. Standard limb leads • Use 2 active electrodes • Standard limb leads (I, II, III) each record potential difference between 2 limbs (2 electrodes): • Lead I → LA (+) & RA (-) • Lead II → LL (+) & RA (-) • Lead III → LL (+) & LA (-) 1/13/2022 5 ECG CVS Physiology
- 8. ECG Recording 2. Unipolar limb leads: • Use exploring electrode connected to an indifferent electrode at zero potential • Measure potential difference between exploring & indifferent electrode • Two types: • Augmented limb leads → aVR, aVL, aVF • Record potential difference between one limb and the other 2 limbs • Precordial leads/Unipolar chest leads →V1-V6 1/13/2022 8 ECG CVS Physiology
- 9. ECG Recording • Augmented limb leads • aVR → b/n RA & the indifferent electrode • aVL → b/n LA & the indifferent electrode • aVF → b/n LL & the indifferent electrode 1/13/2022 9 ECG CVS Physiology
- 11. ECG Recording • Chest leads: • V1 → 4th intercostal space right sternal edge • V2 → 4th intercostal space left sternal edge • To find the 4th space, palpate the manubriosternal angle of Louis) • Directly adjacent is the 2nd rib, with the 2nd intercostal space directly below • Palpate inferiorly to find the 3rd and then 4th space • V3 → halfway between V2 and V4 • V4 → over the apex (5th ICS mid-clavicular line) • V5 → at the same level as V4 but on the anterior axillary line • V6 → at the same level as V4 and V5 but on the mid-axillary line 1/13/2022 11 ECG CVS Physiology
- 14. ECG Recording • Polarity conventions: • Upward deflection → when voltage difference between 2 electrodes is more positive • Downward deflection → opposite • 1cm deflection on the vertical axis → represents a potential difference of 1mv • 25mm on the horizontal axis → represents 1 second 1/13/2022 14 ECG CVS Physiology
- 15. 1/13/2022 15 ECG CVS Physiology • Away from the electrode → Negative deflection • Towards the electrode → positive deflection
- 16. ECG Recording • Polarity conventions (lead-II): • Upward deflection → indicates an electrical polarity exists between the LL (+) and the RA electrodes • Downward deflection → indicates a polarity exists between the electrodes at that instant, with the left leg electrode being negative 1/13/2022 16 ECG CVS Physiology
- 17. ECG Recording: 12-Lead ECG • The standard clinical ECG involves voltage measurements recorded from 12 different leads: • 3 standard bipolar limb leads → Leads-I, II, III • 9 unipolar leads: • 6 are chest electrodes → V1-V6 • 3 are augmented unipolar limb leads (aVR + aVL + aVF) generated using the limb electrodes: • 2 of the electrodes are electrically connected to form an indifferent electrode while the third limb electrode is made the positive pole of the pair 1/13/2022 17 ECG CVS Physiology
- 18. ECG Recording: 12-Lead ECG • Electrode placement in 12 lead ECG: • 6 chest electrodes → V1-V6 • 4 limb electrodes: • Right arm • Left arm • Left leg • Right leg (neutral) 1/13/2022 18 ECG CVS Physiology
- 19. ECG Recording: 12-Lead ECG • Augmented unipolar limb leads: • Lead aVR → recorded from the electrode on the right arm and the indifferent electrode • Lead aVL → recorded from the electrode on the left arm • Lead aVF → recorded from the electrode on the left leg 1/13/2022 19 ECG CVS Physiology
- 20. 1/13/2022 20 ECG CVS Physiology 12-lead ECG → Leads in the frontal plane
- 21. ECG Recording: 12-Lead ECG • The standard limb leads + augmented unipolar limb leads record the electrical activity of the heart as it appears from six different "perspectives," (all in the frontal plane): • The axes for leads I, II, and III are those of the sides of Einthoven's triangle • While those for aVR, aVL and aVF are specified by lines drawn from the center of Einthoven's triangle to each of its vertices • The six limb leads can be thought of as a hexaxial reference system for observing the cardiac vectors in the frontal plane 1/13/2022 21 ECG CVS Physiology
- 22. ECG Recording: 12-Lead ECG • Chest leads: • Precordial/chest leads → V1-V6 → the other 6 leads of the standard 12-lead ECG • They are unipolar leads • These potentials are obtained by placing an additional (exploring) electrode in six specified positions on the chest wall • The indifferent electrode is formed by electrically connecting the limb electrodes 1/13/2022 22 ECG CVS Physiology
- 23. 1/13/2022 23 ECG CVS Physiology 12-lead ECG → Electrode positions for precordial leads in the transverse plane
- 24. ECG Recording: 12-Lead ECG • Chest leads: • When the +ve electrode is placed in position 1 and the wave of ventricular excitation sweeps away from it, the resultant deflection will be downward • When the electrode is in position 6 and the wave of ventricular excitation sweeps toward it, the deflection will be upward 1/13/2022 24 ECG CVS Physiology
- 25. 1/13/2022 25 ECG CVS Physiology Electrodes around the heart
- 29. Electrocardiogram • Information obtained from ECG: • Anatomical orientation of the heart • Relative size of the chambers • Origin of excitation • Rhythm and conduction disturbance • Location, extent and progress of ischemic damage • Electrolyte disturbance + Influence of drugs 1/13/2022 29 ECG CVS Physiology
- 30. Electrocardiogram • Major features of ECG: • P-wave → atrial depolarization • QRS complex → ventricular depolarization + atrial repolarization • T-wave → ventricular repolarization • QT interval → ventricular depolarization + repolarization • U-wave → repolarization of purkinje fibers (slow HR) • PR interval → atrial depolarization + AV nodal delay • PR segment → isoelectric point of depolarized atria • ST segment → isoelectric point of depolarized ventricles 1/13/2022 30 ECG CVS Physiology
- 31. 1/13/2022 31 ECG CVS Physiology Typical Electrocardiogram
- 34. 34 1/13/2022 ECG CVS Physiology ECG waves, intervals + duration
- 36. Electrical Conduction 1/13/2022 36 Heart CVS Physiology AV node • Many but small cells, thus many membranes need to be crossed • Too many gap junctions • Depolarization dependent on Ca • Ca2+ channels are slow conducting • Less diameter, more resistance • RMP = - 65mV Purkinje fibers • Little but long cells, thus small membranes need to be crossed • Little gap junctions • Depolarization dependent on Na • Na+ channels are fast conducting • Large diameter, less resistance • RMP = - 90mV (more electronegative, attract cations rapidly)
- 37. Electrocardiogram • AV node depolarization • Too small to be detected • Ventricular depolarization: 3 stages 1. Septal depolarization (rapid) 2. Major ventricular depolarization 3. Basal depolarization • Septal part is depolarized by left bundle branch, while the right bundle branch take the current downward • Thus, wave of depolarization moves from left & lower part towards the right & upper portion 1/13/2022 37 ECG CVS Physiology
- 38. Electrocardiogram • Ventricular depolarization: • Since septal tissue is small, Septal vector is small & directed rightward & upward + fast vector • Inner myocardium depolarized first, then wave of depolarization moves outward • Multiple vectors are simultaneously produced (added) • Left ventricle downward & leftward (stronger) • Right ventricle downward & rightward (weak) • Net vector = downward & leftward 1/13/2022 38 ECG CVS Physiology
- 39. Electrocardiogram • Basal Ventricular depolarization: • Left: upward & rightward • Right: upward & rightward • Net vector: upward & rightward • During ventricular depolarization, 3 fast vectors are produced since Na+ channels are fast conducting • During ventricular repolarization, since K+ channels are slow conducting, the timing of repolarization will overlap and only 1 vector is produced • Hence, repolarization of major ventricle will be detected 1/13/2022 39 ECG CVS Physiology
- 40. Electrocardiogram • P-wave: • Represents atrial depolarization • Made up of two separate waves due to right atrial (occurs first) and left atrial depolarization • Normal duration = 0.08-0.10sec • Normal height ≈1.5mm 1/13/2022 40 ECG CVS Physiology
- 41. Electrocardiogram • P pulmonale • P wave > 2.5mm • Occurs due to right atrial hypertrophy • Causes: • Pulmonary hypertension • Pulmonary stenosis • Tricuspid valve stenosis 1/13/2022 41 ECG CVS Physiology
- 42. Electrocardiogram • P mitrale • P wave > 0.08sec (2 small squares) and a bifid shape • Occurs due to left atrial hypertrophy + delayed left atrial depolarization • Causes include: • Mitral valve stenosis • LVH 1/13/2022 42 ECG CVS Physiology
- 43. Electrocardiogram • PR Interval: • Atrial depolarization + the start of ventricular depolarization • Measured between the initiation of the P wave to the beginning of the QRS complex • Indicates the duration for an action potential to spread through the atria and the AV node • Normal duration ≈ 0.12-0.2sec (3-5 small squares) 1/13/2022 43 ECG CVS Physiology
- 44. Electrocardiogram • PR Interval: a. Short PR interval (<0.12s) → signify an accessory electrical pathway between the atria and the ventricles → the ventricles depolarize early → gives a short PR interval • NB: Short PR interval occurs in Wolff-Parkinson-White syndrome where the accessory pathway is called the bundle of Kent b. Long PR interval (>0.2s) → indicates heart block • 1st degree block • 2nd degree block • 3rd degree block 1/13/2022 44 ECG CVS Physiology
- 45. Electrocardiogram • PR Interval: • 1st degree block: • If there is a constant long PR interval (>0.2s) • Longer than normal conduction delay at the AV node • 2nd degree block/Mobitz type I • PR widens over subsequent beats then a QRS is dropped • Wenckebach phenomenon → lengthening of the PR interval in subsequent beats 1/13/2022 45 ECG CVS Physiology
- 46. Electrocardiogram • PR Interval: • 2nd degree block/Mobitz type II • PR is constant then a QRS is dropped • 3rd degree block • If there is no discernable relationship between the P-waves and the QRS complexes 1/13/2022 46 ECG CVS Physiology
- 47. Electrocardiogram • PR segment • No voltages are detected on the body surface: • Atrial cells are depolarized (in their plateau phase) • Ventricular cells are still resting, and • The electrical field set up by the action potential progressing through the small AV node is not intense enough to be detected • Shortly after the cardiac impulse breaks out of the AV node and into the rapidly conducting Purkinje system, all the ventricular muscles depolarize within a very short period of time and cause the QRS complex 1/13/2022 47 ECG CVS Physiology
- 48. Electrocardiogram • QRS Complex: • The rapid and large changes in the magnitude and direction of the net cardiac dipole that exist during ventricular depolarization causes the QRS complex • Normal QRS duration ≈ 60-100ms • Atrial repolarization occurs during the QRS complex • Atrial repolarization is not evident on the ECG → it is a poorly synchronized event in a relatively small mass of heart tissue and is completely overshadowed by the major electrical events occurring in the ventricles at this time • QRS complex is composed of 3 waves → Q wave + R wave + S wave 1/13/2022 48 ECG CVS Physiology
- 49. Electrocardiogram • Q-wave: • Initial ventricular depolarization phase • Usually occurs on the left side of intraventricular septum which shows: • A negative component on lead I • A small negative component on lead II and • A positive component on lead III 1/13/2022 49 ECG CVS Physiology
- 50. 1/13/2022 50 ECG CVS Physiology Ventricular depolarization and the generation of the QRS complex
- 51. Electrocardiogram • NB • It is possible for a given cardiac dipole to produce opposite deflections on different leads (Q waves appear on leads I and II but not on lead III…) • Q wave can be pathological if it is: • Deeper than 2 small squares (0.2mV) and/or • Wider than 1 small square (0.04s) and/or 1/13/2022 51 ECG CVS Physiology
- 52. Q-wave 1/13/2022 52 ECG CVS Physiology In a lead other than III or one of the leads that look at the heart from the left (I, II, aVL aVL, V5 and V6) where small Qs (i.e. not meeting the criteria above) can be normal
- 53. Electrocardiogram • R-wave • Ventricular depolarization when the number of individual dipoles is greatest and/or their orientation is most similar • This phase generates the largest net cardiac dipole in the ECG → ventricular muscles are so numerous and depolarize nearly in unison • Such dipole produces a large positive R waves on all 3 limb leads • The net cardiac dipole is nearly parallel to lead II 1/13/2022 53 ECG CVS Physiology
- 54. 1/13/2022 54 ECG CVS Physiology Ventricular depolarization and the generation of the QRS complex
- 55. Electrocardiogram • S-wave: • Occurs near the end of the spread of depolarization through the ventricles • Indicates the small net cardiac dipole present at this time • NB • S-wave does not necessarily appear on all ECG leads (lead I below…) 1/13/2022 55 ECG CVS Physiology
- 56. 1/13/2022 56 ECG CVS Physiology Ventricular depolarization and the generation of the QRS complex
- 57. Electrocardiogram • ST-segment: • Isoelectric point of depolarized ventricles (no electrical potentials are measured on the body surface during the ST segment): • No rapid changes in membrane potential occurs in any of myocardial cells • Atrial cells have already returned to the resting phase • All ventricular muscle cells are in a depolarized state (in their plateau phase) • All ECG traces will be flat at the isoelectric (zero voltage) level 1/13/2022 57 ECG CVS Physiology
- 58. 1/13/2022 58 ECG CVS Physiology Ventricular depolarization and the generation of the QRS complex
- 59. Electrocardiogram • QRS complex • If the complexes in the chest leads look very tall → consider LVH • If the depth of the S wave in V1 + the height of the R wave in V6 is > 35mm → LVH is present • Normal QRS complex < 0.1s (2.5 small squares) • QRS > 0.1s → suggests ventricular conduction problem → usually right or left bundle branch block (RBBB or LBBB) • NB • BBB can be caused by infarction or fibrosis (related to the ageing process) 1/13/2022 59 ECG CVS Physiology
- 60. Electrocardiogram • LBBB: • QRS complex may look like a ‘W’ in V1 and/or an ‘M’ shape in V6 • New onset LBBB with chest pain → consider Myocardial infarction • NB • Not possible to interpret the ST segment 1/13/2022 60 ECG CVS Physiology
- 61. Electrocardiogram • RBBB: • There may be an ‘M’ in V1 and/or a ‘W’ in V6 • Can occur in healthy people with normal QRS → Partial RBBB 1/13/2022 61 ECG CVS Physiology
- 62. Electrocardiogram • ST Segment: • Planar (flat) elevation or depression of ST segment indicates abnormalities: • ST elevation → suggest MI/Prinzmetal’s (vasospastic) angina • ST depression → can represent Ischaemia • NB • Myocardial injury or inadequate blood flow can cause ST segment elevation or depression 1/13/2022 62 ECG CVS Physiology
- 63. Electrocardiogram • T-wave • Period of ventricular repolarization: • Ventricular cells begin to repolarize → a voltage once again appears on the body surface • Normally T-wave is positive on lead II → indicates the net dipole generated during ventricular repolarization is oriented in the same general direction as that of ventricular depolarization • Combination of reversed individual dipole polarity and reversed wavefront propagation pathway during ventricular repolarization would be a positive T wave 1/13/2022 63 ECG CVS Physiology
- 64. Electrocardiogram • T-wave • T-wave is broader and smaller than R-wave → ventricular repolarization is less synchronous than their depolarization • At the conclusion of the T wave all the cells in the heart are in the resting state • NB • The last ventricular cells to depolarize are the first to repolarize • The wavefront of electrical activity during ventricular repolarization tends to retrace (in reverse direction) the course followed during ventricular depolarization 1/13/2022 64 ECG CVS Physiology
- 65. Electrocardiogram • T-wave • T wave generally shouldn’t be taller than half the size of the preceding QRS (No definite rule for height) • Tall T-wave: Causes • Hyperkalemia + Acute myocardial infarction • Flat T-wave → may indicate hypokalemia • Inverted T-wave → may indicate Ischaemia 1/13/2022 65 ECG CVS Physiology
- 66. Electrocardiogram • QT Interval: • Roughly approximates the duration of ventricular depolarization (period of ventricular systole) • Measured from the start of the QRS to the end of the T wave • QT interval varies with the heart rate: • At a HR of 60bpm, the QT interval is < 380ms • As the HR gets faster, the QT interval gets shorter • QT interval can be corrected with respect to the HR by using: • QTc = QT/.RR ( QTc = corrected QT) 1/13/2022 66 ECG CVS Physiology
- 67. Electrocardiogram • QT Interval: • Normal range for QTc = 0.38-0.42sec • Short QTc → may indicate hypercalcaemia • Long QTc → has many causes • Long QTc → increases the risk of developing arrhythmia 1/13/2022 67 ECG CVS Physiology
- 68. Electrocardiogram • U-wave: • Small rounded, upright wave following T-wave • Often difficult to see (most easily seen with a slow HR) • Represents repolarization of purkinje fibers • Prominent U-waves → sign of hypokalemia, hyperthyroidism • NB • No body surface potential is measured until the next impulse is generated by the SA node 1/13/2022 68 ECG CVS Physiology