1. American Institute of Aeronautics and Astronautics
1
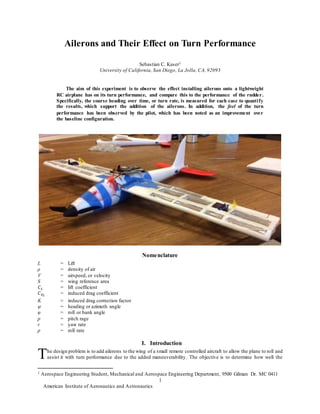
Ailerons and Their Effect on Turn Performance
Sebastian C. Kaser1
University of California, San Diego, La Jolla, CA, 92093
The aim of this experiment is to observe the effect installing ailerons onto a lightweight
RC airplane has on its turn performance, and compare this to the performance of the rudder.
Specifically, the course heading over time, or turn rate, is measured for each case to quantify
the results, which support the addition of the ailerons. In addition, the feel of the turn
performance has been observed by the pilot, which has been noted as an improvement over
the baseline configuration.
Nomenclature
L = Lift
ρ = density of air
V = airspeed, or velocity
S = wing reference area
𝐶 𝐿 = lift coefficient
𝐶 𝐷𝑖
= induced drag coefficient
K = induced drag correction factor
ψ = heading or azimuth angle
φ = roll or bank angle
p = pitch rage
r = yaw rate
p = roll rate
I. Introduction
he design problem is to add ailerons to the wing of a small remote controlled aircraft to allow the plane to roll and
assist it with turn performance due to the added maneuverability. The objective is to determine how well the
1 Aerospace Engineering Student, Mechanical and Aerospace Engineering Department, 9500 Gilman Dr. MC 0411
T
2. American Institute of Aeronautics and Astronautics
2
ailerons will improve the turn rate (degrees/second)versus using only the rudder to maneuver yaw. The airplane will
be able to roll slightly and deflect the elevator upward, resulting in a more stable turn than using only a rudder.
To verify the ailerons’ performance, one or more flight tests will be performed to analyze each of the turning
methods. A set number of turns will be conducted using the ailerons, and another set using the rudder. Each will be
able to be tested during the same run since both will be configured to connect with the transmitter. In these flight tests,
the airplane will perform turns consisting of either a banked turn while rolling or a turn using only the rudder. Using
a GPS unit attached to the mounted breadboard, the turn rates can be calculated from the differential of heading angle
(relative to North) over time, and these can also be compared to each otherto demonstrate the ailerons’ improvement
over the baseline rudder.
II. Theory
While a rudder can be used to produce yaw, it is not as effective as ailerons. Ailerons are control surfaces which
are utilized by all commercial, private, and military aircraft, but are not always common on small hobby remote
controlled planes, as these smaller planes sometimes go for simpler designs.However, adding ailerons to these planes
can be greatly beneficial to the performance of the aircraft.
In commercial airplanes, using only the rudder to generate yaw produces unfavorable circumstances for the
passengers.“As the airplane rotates about the vertical axis, the passengers in the rear seat are forced from side to side,
much like the passenger in the back seat of a car when it is turning on an unbanked road” due to the centripetal
acceleration, and this can cause motion sickness.1 Rudders are also not very effective during high speed flight, as they
do not have enough surface area to completely rotate the plane. Ailerons are used to generate a horizontal force when
the airplane is banked, and this is what causes themto turn.
While these points are not applicable for slower RC airplanes, the turns produced with the rudder are not as
coordinated as those produced by the ailerons. For lower speed aircraft, i.e. RC airplanes, the rudder also produces a
banked turn when deflected. As it is rotated, say, to the left, the velocity V of the wing on the right hand side moves
faster than that on the left, which slows down as you turn to the left. This produces more lift L on the right hand side,
which causes the plane to bank. This can be seen in Eq. (1) below (where ρ is air density, S is wing reference area,
and Cl is the lift coefficient). The extent of this effect, however, is not as predictable as a bank with the aileron. Using
the ailerons instead, one can perform a much more controlled bank into a turn with the help of the elevator as well as
the rudder to counter the adverse yaw.
𝐿 =
1
2
𝜌𝑉2
𝑆𝐶 𝐿 (1)
Adverse yaw is the result of an aileron
deflection, shown to the right in Fig. 1. Because both
ailerons are deflected in opposite directions, the
result in lift is different for each side. The down-
deflected aileron creates more of a camber,
increasing the pressure differential between the top
and bottomof the airfoil, generating more lift while
also producing more induced drag (parameterized
by the induced drag coefficient 𝐶 𝐷𝑖
; see Eq. (2)
below, where K is the induced drag correction
factor). The up-deflected aileron causes the opposite
effect, reducing the pressure differential which
produces less lift. This causing the up-deflected side
to rotate down while the down-deflected side goes
up, inducing a roll, the angle of which is denoted by
ϕ. Due to this difference in drag, the down-deflected
wing’s airspeed slows down in relation to the other
side, producing a yaw in the opposite direction of
the desired turn the plane is banking into. Because
of this, a pilot is able to pull off a more coordinated
turn by also using the rudder to turn in the desired direction.
𝐶 𝐷𝑖
= 𝐾 ∗ 𝐶 𝐿
2
(2)3
Figure 1. Adverse Yaw. During a banked turn, the
difference in lift between the two wings due to the aileron
deflection causes a yaw in the opposite direction.2
3. American Institute of Aeronautics and Astronautics
3
While it is difficult to quantify a “coordinated turn”, it is possible to calculate 𝜓̇, the change in course heading
overtime (also referred to as the “turn rate”) using two Euler angles (course heading ψ and the roll ϕ) and the rotational
rates in a body-fixed frame (pitch rate q, yaw rate r, and roll rate p). This is shown in Eq. (3) below.
𝜙̇ = 𝑝 + tan 𝜃 ∗ (𝑞 ∗ 𝑠𝑖𝑛𝜙 + 𝑟 ∗ 𝑐𝑜𝑠𝜙) (3)4
These values require both an accelerometer and a magnetometer4, neither of which were used for this experiment.
However, similar results can be obtained with the use of a GPS logger. This is explained further in the experimental
procedure.
III. Experimental Procedure
A. Parts Used
• (1) Weekender eEyeHawk, by HiTec, containing:
fuselage assembly [with vertical stabilizer], main
wing, horizontal stabilizer, brushless outrunner
motor, 6-amp ESC, folding propeller, nano servos,
• (1) Minima6S, 2.4GHz, 6-Channel Aircraft
Receiver, by HiTec ,
• Radio transmitter,
• (1) or more 2S, 7.4V, 350 - 360 mAh LiPo battery,
• (1) charger for battery,
• (1) Arduino Micro,
• (2) Micro Servos (Adafruit 169),
• (1) Ultimate GPS Breakout v3 (Adafruit 1032),
• (1) I2c FRAM Breakout,
• (1) Adafruit Breadboard,
• wires,
• receiver / servo connecters,
• soldering tools,
• foam board of various thicknesses to make wings
and wing box,
• X-Acto knife,
• razor and 45 degree razor,
• music wire for servo connection with aileron,
• aluminum tubes for semi-spars,
• glue gun and hot glue, super glue, and quick
setting epoxy,
• fiber glass tape,
• (1) Cheetah 2204-14 brushless motor,
• (1) 8 x 3.8 APC propeller.
B. The First Assembly
My first assembly used the KFm-4 airfoil configuration, shown in Fig. 2 below, using three pieces of foam board,
one half mm thick, and two quarter mm thick. I also added a piece of balsa wood to the leading edge for extra support.
By drilling holes into the root sides of the wings and into anotherpiece of foam to fit into the fuselage, I configured
the wing to be attached from both sides using
two cut aluminum rods to position them and
act as semi-spars. I attached the servo, music
wire, and the servo clip to the ailerons using
hot glue, and used a 2-to-1 “fork” wire to
connect it to the receiver to properly direct
ailerons. To help reduce drag, I put a piece of
paper over the servos. I could then test my
assembly.
C. The Second Assembly
After the results of the first flight test,shown above,I decided to use a different method for my second assembly.
I made larger wings to account for the lift needed due to the added weight of the servos.Using the lift equation (see
Eq. (1)) and an estimated lift coefficient from the original wing, I determined the wing s ize needed. This time, I
constructed the new wing with .5 cm thick foam with paper on both sides.To do this, I first cut the ends with a razor
at 45 degree angle for streamline purposes, making a parallelogram shape. I then made a slice along foam at about
half-way to one-third down the middle, leaving the paper on the opposite side.I cut out a square on the shorter “half”
for the servo to fit into, and then folded the short end over to make an airfoil shape.Using some extra pieces of foam,
I created camber in the airfoil and a spar. I fitted in the servo and wires before gluing the airfoil togetherwith hot glue,
minimizing usage to preserve the foam’s low weight. I then cut out ailerons from the wing and used the 45 degree
razor to make a triangular edge at the hinge, and attached it back to the wing using fiber glass tape.I attached the servo
clips to aileron and used bent music wires to connect it with the servo. Finally, I pushed two aluminum rods through
center of the wing to connect themwith fuselage, as before.
Figure 2. KFm-4 Airfoil. The airfoil used for my first design.
This uses a 6-12% thickness,with top and bottomsteps at the 50%
chord. It is “fast, maneuverable, and gives a steady flight profile
across a wide speed range [making it a] great choice for
aerobatic plans.”5
4. American Institute of Aeronautics and Astronautics
4
D. Reducing Weight and Increasing Power
Before I collected any data,I ran a few flight tests to make sure the airplane would fly. Because the wing was too
heavy with the added servos,I had to reduce the weight of the wing. To do this, I cut out square all along the wing,
leaving at least 1 cm lines horizontally and vertically to act as ribs and spars.I also left space where the wing attached
to the aluminum rods, as well as close to the main root and the main internal spar to maintain structural stability. To
finish it off, I put packaging tape along the openings to enclose the wing and maintain aerodynamic effectiveness.
In addition to removing parts of the wing, I had to upgrade the motor and propeller to generate enough lift. The
old motor was removed and the new one placed on the nose of the fuselage, using pins to keep it in place. Since the
larger propeller did not fit the motor exactly, elastic bands were used to hold it onto the rotating portion.
E. Collecting and Analyzing the Data
To collect precise data on turn rate using the GPS logger, I specified in the Arduino “record” code to make the
GPS only send the GPRMC message, which identifies the course heading, ψ, in degrees from true North, (in addition
to other values such as global position and ground speed). I also changed the update rate to 5 Hz as opposed to the 1
Hz default.
To analyze the data,I post-processed it with Matlab to determine 𝜓̇, the change in course heading overtime, using
the forward finite difference method, and graphed these results accordingly.
Finally, I could test the final configuration. I observed the airplane’s turning and rolling performance, as well as
gathering input from the pilot. I then compared results of the turning rate using the ailerons with that of the rudder
baseline.
IV. Results
These results consist of data from two separate tests to record the heading φ, or flight path angle, from the GPS
logger. One test uses the baseline airplane configuration with the original wing, using only the rudderto change course,
and the second uses the wings and ailerons I constructed. While testing conditions foreach experiment were attempted
to remain constant,variations in wind speed,power input, and wing used could affect the comparison between the two
results.
Figure 3 to the left displays the turn
rate during a steady turn using the
rudder-only baseline configuration. As
seen in the graph, the change in flight
path angle over the course of the turn
varied in an oscillating fashion, ranging
from 23.5 to 51.8 deg/s,and averaging at
36.7 deg/s. Disregarding the lowest data
point, this average improved to 38.6
deg/s (this will be explained further on).
This test was performing during the day
with moderate to high wind conditions.
Figure 4 below represents the GPS
data retrieved from the final aileron flight
test, displaying the calculated turn rate
(deg/s) and the heading angle (deg)
relative to true North. The heading angle
is included to indicate which time ranges
the airplane was performing a well-
defined turn, and to allow comparison to
the turn rate. These data also displays an
oscillating pattern in the turn rate, despite
Figure 3. Turn rate using the rudder. This graph displays the turn
rate (deg/s) of a steady turn performed using the baseline airplane’s
rudder. This produced an average turn rate of 36.7 deg/s, with a
maximum rate of 51.8 deg/s over the course of the test. The average of
the four highest rates is 43.46 deg/s.
0
10
20
30
40
50
60
0 1 2 3 4 5 6 7
TurnRate,deg/s
Time, s
5. American Institute of Aeronautics and Astronautics
5
a seemingly consistent
change in heading angle.
Another point to note is that
the GPS was sampled at a
rate of 5 Hz compared to the
1 Hz of the previous test.
This test was conducted
during the night, where wind
speeds were low.
The turn rate varied
(during a well-defined turn)
from 11.4 to 63 deg/s,though
due to the oscillation, simply
averaging the rate over the
entire range was not optimal.
Table 1 below and to the right
attempts to alleviate this
problem, displaying the
average turn rates over a
variety of time ranges. The
first few rows are averaged
over the entire range, or most
of the indicated samples,
while the last few rows are
averages of the peak turn rates seen in Fig 4. These peak
turn rate averages omit the lowest data points which
varied the greatest fromtheir neighbors. These data were
then averaged all together to produce an average peak
turn rate.
While the wide time range turn rates are all lower
than the turn rate of the rudder configuration, the peak
rates are mostly higher, indicating an improvement over
the baseline. This will be explored more in-depth in the
discussion section.
V. Discussion and Data Analysis
Comparing these two sets ofdata, it is obvious that there is some variability in the turn rate, especially so for the
aileron test.The oscillation pattern can be seen in both graphs.In the rudder data, this has a period of a few seconds,
while in the aileron data, the period is closer to one second. This could possibly be due to the way the turns were
coordinated. A constant jig of the stick might push the airplane over too far, while short little movements could allow
for smoother turns.This is the reason I decided to separate the peak turn rates to determine the fastest observed turning
performance. The average of the peak turn rates allows for some normalization of these maximum values to achieve
a more accurate result.
Figure 4. Turn rate using ailerons. This graph displays the change in heading,
or turn rate (deg/s) (shown as circles, quantified by the left-hand vertical axis),
during a flight test using the fabricated ailerons and the heading angle relative to
true North (degrees) (quantified by the right-hand vertical axis with triangles).
-150
-100
-50
0
50
100
150
200
250
300
-20
-10
0
10
20
30
40
50
60
70
0 1 2 3 4 5 6 7 8 9
HeadingAnglerelativetotrueNorth,
degrees
TurnRate,deg/s
Time, s
Turn Rate Heading Angle (rel. to N)
Table 1. Average turn rates using ailerons over a
variety of time ranges. This data table seeks to avoid
the discrepancies in the turn rates calculated from the
change in heading.
Time Range, s
Average turn
rate, deg/s
Average Turn
Rates Over
Wider Time
Range:
0.0 - 8.2 32.99
0.8 - 8.0 34.44
0.8 - 7.2 34.90
1.6 - 7.2 36.05
Peak Turn Rates:
0.8 47.35
1.6 - 2.2 35.59
2.6 - 3.2 37.28
3.6 - 4.2 45.38
4.6 - 5.2 36.78
5.8 - 6.0 41.45
6.6 - 7.2 53.74
7.6 - 8.0 34.45
Average of Peak
Turn Rates:
41.10
6. American Institute of Aeronautics and Astronautics
6
The turn rates of the rudder test were much less affected by this effect, as they remain somewhat steady over the
given interval, while the aileron turn rates reached down to 10 deg/s in some cases (which is quite low compared to
40 deg/s). To remain consistent, removing the lowest data point in the rudder case results in an average turn rate of
38.6 deg/s,still a bit lower than the average rate of the aileron test,41.1 deg/s.Though by a small margin, this supports
my original hypothesis that ailerons would improve turn performance. However, discrepancies could have been a
major factor to my final results.
The only way to successfully fly the plane with the second assembly was to reduce the weight and increase the
power. Without the additional power, the wing was still too heavy to fly with the instrumentation package—it was
only able to glide shortly before either crashing or landing. After my continuous struggles to reduce the weight o f the
wing (as well as the airplane fuselage itself) without any success in flying the plane (with the instrumentation package),
I deduced that the only other option was to increase the power and thrust. As described in the procedure, the base
configuration was fitted with a more powerful motor and wider propeller to allow the airplane to fly with
instrumentation package attached.
Due to these variations in the airplane configuration, these results could have discrepancies, as the test conditions
were not entirely optimal. First of all, the wing I constructed in addition to the motor and propeller used were not
identical to those of the original airplane used during the rudder-turn test. This could have caused variations in
aerodynamic performance, though according to the ground speed received from the GPS, the two configurations were
flying at relatively the same speed, around 10-12 m/s. In regards to the aerodynamics, I had wanted to test my final
configuration by turning with only the plane’s rudder under the same conditions (such as wind speed) as the aileron
test to ensure a reliable control for my experiment. However, due to unfavorable conditions and a time constraint,this
was not possible at the time.
Despite these discrepancies, there is still the matter of how an aileron turn feels compared to that of a rudder’s.
According to the pilot, another group-mate by the name of Elioth Freijo, the airplane was much easier and smoother
to fly using the ailerons to roll and turn, rather than with the rudder, supporting my hypothesis.This could be due to
the more natural flow of an aileron induced turn, while a rudder turn might feel a little forced.
VI. Conclusion
Overall, my experiment produced favorable results in support of my hypothesis: adding ailerons to a remote
controlled airplane’s wing would improve its turn performance. This was displayed in terms of raw data by comparing
turn rates of ailerons versus rudders,which showed an improvement of 2.5 deg/s.In addition, according to the pilot,
the feel of the airplane’s turn was much more natural and fluid.
However, as stated previously, improvements could be made to both ensure a better control and receive more
accurate data. A future test would involve testing both turning methods using the same airplane co nfiguration,
consisting of wing, motor, and propeller, in addition to testing under the same weather conditions.
Anotherchange that could produce more accurate results would be to use an accelerometer and magnetometer or
a gyroscope to calculate the Euler angles and body-fixed rotational rates.While the GPS produced reasonable heading
data, the variability in its output is questionable,especially due to factors such as noise and distance fromthe satellite.
On-board instruments would provide more real-time data to analyze, and therefore, likely more accurate results.
7. American Institute of Aeronautics and Astronautics
7
Appendix
Figures A/B. The original foam wing with balsa wood,and the failed test flight (note the pertruding aluminumrods).
Figures C/D The first assembly, installed with the aileron and servo, covered up by a piece of paper to reduce drag.
Figures E/F. The second assembly, before and after the weight reduction.
8. American Institute of Aeronautics and Astronautics
8
Figure G. The semi-final assembly with packaging tape covering the holes in the wings.
Figures H/I. The final assembly, installed with an 8 in propeller and a Cheetah 2204-14 brushless motor to increase
the thrust and power.
Acknowledgments
I would like to thank Professor Mark Anderson, Karcher Morris, and Kaylee Feigum for their hard work and
commitment to helping our class succeed. The author would also like to thank the Department of Mechanical and
Aerospace Engineering at the University of California, San Diego, and Elioth Freijo, Nayelli Mondragon, David
Renteria, and Alex Akopian for their teamwork and cooperation throughout this project.
References
1
McLain, John E, “Understanding the Use of Rudder: Its Most Important Use is Preventing Yaw”, Empire Aviation [online
website], [published June 2001], URL: http://www.empire-aviation.com/flight-instructors/john-e-mclain/understanding-
the-use-of-rudder.html [cited 05 June 2015].
2
Davisson, Budd, “Technique: The Basic Turn”, Flight Training, AOPA [online website], [originally published in the
magazine Flight Training, April 2011], URL: http://flighttraining.aopa.org/magazine/2011/April/technique.html [cited 06
June 2015].
3
Anderson, Mark, “Level Flight Performance”, MAE 155 Aero [online website], [posted online during Winter 2015], URL:
https://sites.google.com/site/mae155aero/ [cited 07 June 2015].
4
Anderson, Mark, “Angular Rates”, MAE 142 Aero [online website], [posted online during Winter 2015], URL:
https://sites.google.com/site/mae142aero/ [cited 07 June 2015].
5
Kline, Richard, "Kline–Fogleman Airfoil", Wikipedia [online database], URL:
http://en.wikipedia.org/wiki/Kline%E2% 80%93Fogleman_airfoil [cited 05 June 2015].