SlideShare a Scribd company logo
1 of 18
Time Series Project: An Investigation into the Incidents of
Recorded Terrorist Attacks Worldwide (January 1980-
January 1993)
Contents
1. Abstract
2. Introduction
3. Methods
4. Modelling the Data
5. Seasonality
6. Detrending
7. Differencing
8. Identification of the Autoregressive and Moving Average parameters.
9. Testing the Model
10. Overfitting the Model
10.1. Ljung-Box Pierce Chi Squared Test Statistic
11. Model Diagnostics
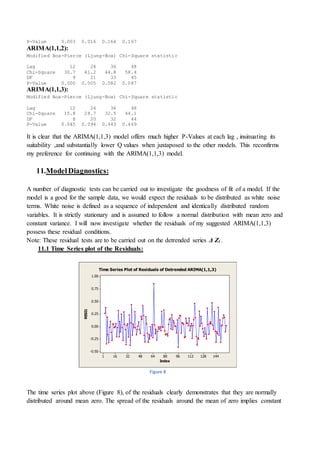
11.1 Time Series plot of the Residuals
11.2 QQ Plot of Residuals
11.3 Residuals vs. Fitted Values
11.4 Histogram of Residuals
11.5 Residuals vs. Order
11.6 ACF of Residuals
11.7 PACF of Residuals
12. Forecasting
12.1 Forecast Comparison and Confidence Interval
12.2 Error Tests
13. Conclusion
14. Appendix and Referencing
-Appendix 1
-Appendix 2
1. Abstract:
This project investigates the incidents of recorded terrorist attacks worldwide under a Mathematical
Time Series framework. I wanted to choose a data set which could, if in part, elucidate the nature of
an aspect of human behaviour which may be governed by a ‘trend’, as opposed to choosing a data set
such as stock price fluctuation which is ultimately a Random Walk. Terrorist attacks are often
engendered by retaliation, so this project proposes a fitting and suitable ARIMA model which could
be used as a forecasting tool to predict these retaliations.
The findings outlined in this project would be of particular interest to Actuaries or Risk Managers
who work in Catastrophe Modelling and who are engaged with fine-tuning of risk in accordance to
Solvency II. These professionals are faced with the task of predicting the likelihood and frequency of
terrorist attacks and making predictions about the change in number of incidents over time. There
exist huge liabilities that insurance companies must pay out, should such terrorist incidents occur,
and miscalculation, misinterpretation or under-prediction of these pay-outs are of paramount interest
to these companies. The data required to build knowledge about the threat of these attacks include
frequency, methods, targets and perpetrators. The expertise needed to understand the threat must
encompass the geopolitical situation, motivations, capabilities, causes and mitigation. A credible
model should take into account all these factors and make contextual assumptions in order to
formulate a robust forecast of the risk.1
2. Introduction:
I sourced this data from Global Terrorism Database (GTD) Codebook: Inclusion Criteria and
Variables.2 The document reflects the collection and coding rules for the GTD, maintained by the
National Consortium for the Study of Terrorism and Responses to Terrorism (START).
The current GTD is the product of several phases of data collection efforts, each relying on the
examination of approximately 12,000 to 16,000 articles monthly .The collection and refining of the
data comes from sources including publicly available sources, unclassified source materials such as
media articles and electronic news archives, and to a lesser extent, existing data sets, secondary
source materials such as books and journals and legal documents.
Incidents of Terrorism from the year 1993 are not present in the GTD Data set because they were lost
prior to START’s compilation for the GTD when the data was being transferred from Pinkerton
Global Intelligence Service (PGIS). Due to the challenges of retrospective data collection for events
that happened more than 15 years ago, the number of cases for 1993 is only 15 % of the number
reported by PGIS. In an effort to ameliorate this gap, Appendix II of the Codebook provides marginal
counts which can be used, so as to interpolate values for the missing 1993 cases.
The GTD defines a terrorist attack as the threatened or actual use of illegal force and violence by a
non‐state actor to attain a political, economic, religious, or social goal through fear, coercion, or
intimidation. In practice this means in order to consider an incident for inclusion in the GTD, all
three of the following attributes must be present:
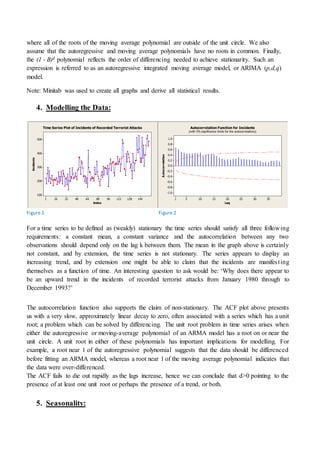
 The incident must be intentional – the result of a conscious calculation on the part of a perpetrator.
 The incident must entail some level of violence or threat of violence ‐including property violence,
as well as violence against people.
 The perpetrators of the incidents must be sub‐national actors. The database does not include acts of
state terrorism.
In addition, at least two of the following three criteria must be present for an incident to be included
in the GTD:
 Criterion 1: The act must be aimed at attaining a political, economic, religious, or social goal.
 Criterion 2: There must be evidence of an intention to coerce, intimidate, or convey some other
message to a larger audience (or audiences) than the immediate victims: As long as any of the
planners or decision‐makers behind the attack intended to coerce, intimidate or publicize, the
intentionality criterion is met.
 Criterion 3: The action must be outside the context of legitimate warfare activities.
Finally, it is the policy of the Department of Homeland Security to protect the privacy of individuals. The
information I requested from the Global Terrorism Database contains information related to specific
individuals. Thus, I am required by the Department of Homeland Security to take every possible precaution
to protect this information and that I will use it for the sole purpose of advancing the understanding of
terrorism.
3. Methods:
There were an amazing 125,087 counts of terrorist attacks contained in the data set from the 1rst
January 1970 until the 31rst December 2013 (excluding data counts from 1993). From this data set, I
conducted manual monthly counts on the truncated data from January 1980 to January 1993 which
resulted in observations spanning over 13 years (157 observations). This time period also contains the
interpolated data for January 1993.
The data was investigated by analysing the ACF, PACF and Residual Plots under the guidelines laid
out by the Autoregressive Integrated Moving Average (ARIMA) model, suggested by George Box and
Gwilym Jenkins in 1976. The Box-Jenkins type ARIMA process can be defined as:
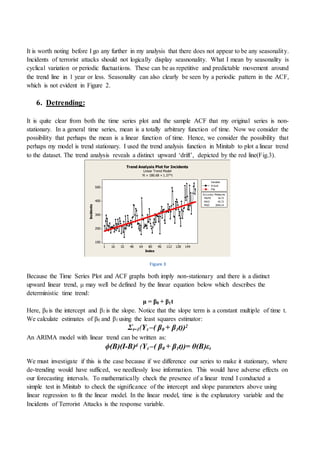
ϕp (B)(I-B)d Yt = θq(B)εt
where ϕp (B) is the autoregressive polynomial of order p, (I-B)d is the differencing operator, θq(B) is
the moving average polynomial of order q, and the εt is a Gaussian white noise sequence with mean 0
and variance σ2. The value Yt refers to the monthly count of terrorist attacks worldwide. The B is the
backshift operator such that BjYt = Yt -j. We expand the autoregressive polynomial:
ϕp (B)=1- ϕ1B - ϕ2B2- . . . - ϕp(B)p
such that all of the roots of the polynomial are outside of the unit circle. Similarly, we can expand the
moving average polynomial such that:
θq(B) = 1 – θ1B - θ2B2- . . . -θq(B)q
where all of the roots of the moving average polynomial are outside of the unit circle. We also
assume that the autoregressive and moving average polynomials have no roots in common. Finally,
the (1 - B)d polynomial reflects the order of differencing needed to achieve stationarity. Such an
expression is referred to as an autoregressive integrated moving average model, or ARIMA (p,d,q)
model.
Note: Minitab was used to create all graphs and derive all statistical results.
4. Modelling the Data:
Figure 1 Figure 2
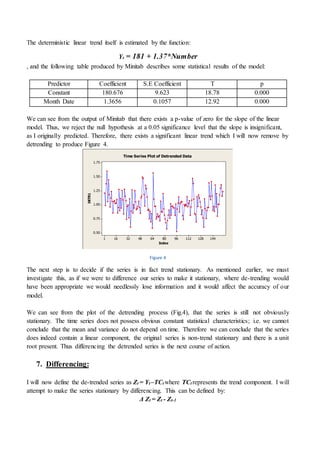
For a time series to be defined as (weakly) stationary the time series should satisfy all three following
requirements: a constant mean, a constant variance and the autocorrelation between any two
observations should depend only on the lag k between them. The mean in the graph above is certainly
not constant, and by extension, the time series is not stationary. The series appears to display an
increasing trend, and by extension one might be able to claim that the incidents are manifesting
themselves as a function of time. An interesting question to ask would be: ‘Why does there appear to
be an upward trend in the incidents of recorded terrorist attacks from January 1980 through to
December 1993?’
The autocorrelation function also supports the claim of non-stationary. The ACF plot above presents
us with a very slow, approximately linear decay to zero, often associated with a series which has a unit
root; a problem which can be solved by differencing. The unit root problem in time series arises when
either the autoregressive or moving-average polynomial of an ARMA model has a root on or near the
unit circle. A unit root in either of these polynomials has important implications for modelling. For
example, a root near 1 of the autoregressive polynomial suggests that the data should be differenced
before fitting an ARMA model, whereas a root near 1 of the moving average polynomial indicates that
the data were over-differenced.
The ACF fails to die out rapidly as the lags increase, hence we can conclude that d>0 pointing to the
presence of at least one unit root or perhaps the presence of a trend, or both.
5. Seasonality:
1441281129680644832161
500
400
300
200
100
Index
Incidents
Time Series Plot of Incidents of Recorded Terrorist Attacks
35302520151051
1.0
0.8
0.6
0.4
0.2
0.0
-0.2
-0.4
-0.6
-0.8
-1.0
Lag
Autocorrelation
Autocorrelation Function for Incidents
(with 5% significance limits for the autocorrelations)
It is worth noting before I go any further in my analysis that there does not appear to be any seasonality.
Incidents of terrorist attacks should not logically display seasnonality. What I mean by seasonality is
cyclical variation or periodic fluctuations. These can be as repetitive and predictable movement around
the trend line in 1 year or less. Seasonality can also clearly be seen by a periodic pattern in the ACF,
which is not evident in Figure 2.
6. Detrending:
It is quite clear from both the time series plot and the sample ACF that my original series is non-
stationary. In a general time series, mean is a totally arbitrary function of time. Now we consider the
possibility that perhaps the mean is a linear function of time. Hence, we consider the possibility that
perhaps my model is trend stationary. I used the trend analysis function in Minitab to plot a linear trend
to the dataset. The trend analysis reveals a distinct upward ‘drift’, depicted by the red line(Fig.3).
Figure 3
Because the Time Series Plot and ACF graphs both imply non-stationary and there is a distinct
upward linear trend, μ may well be defined by the linear equation below which describes the
deterministic time trend:
μ = β0 + β1t
Here, β0 is the intercept and β1 is the slope. Notice that the slope term is a constant multiple of time t.
We calculate estimates of β0 and β1 using the least squares estimator:
Σt=1(Yt –( β0 + β1t))2
An ARIMA model with linear trend can be written as:
ϕ(B)(I-B)d (Yt –( β0 + β1t))= θ(B)εt
We must investigate if this is the case because if we difference our series to make it stationary, where
de-trending would have sufficed, we needlessly lose information. This would have adverse effects on
our forecasting intervals. To mathematically check the presence of a linear trend I conducted a
simple test in Minitab to check the significance of the intercept and slope parameters above using
linear regression to fit the linear model. In the linear model, time is the explanatory variable and the
Incidents of Terrorist Attacks is the response variable.
1441281129680644832161
500
400
300
200
100
Index
Incidents
MAPE 16.73
MAD 45.73
MSD 3554.14
Accuracy Measures
Actual
Fits
Variable
Trend Analysis Plot for Incidents
Linear Trend Model
Yt = 180.68 + 1.37*t
The deterministic linear trend itself is estimated by the function:
Yt = 181 + 1.37*Number
, and the following table produced by Minitab describes some statistical results of the model:
Predictor Coefficient S.E Coefficient t T p
Constant 180.676 9.623 18.78 0.000
Month Date 1.3656 0.1057 12.92 0.000
We can see from the output of Minitab that there exists a p-value of zero for the slope of the linear
model. Thus, we reject the null hypothesis at a 0.05 significance level that the slope is insignificant,
as I originally predicted. Therefore, there exists a significant linear trend which I will now remove by
detrending to produce Figure 4.
Figure 4
The next step is to decide if the series is in fact trend stationary. As mentioned earlier, we must
investigate this, as if we were to difference our series to make it stationary, where de-trending would
have been appropriate we would needlessly lose information and it would affect the accuracy of our
model.
We can see from the plot of the detrending process (Fig.4), that the series is still not obviously
stationary. The time series does not possess obvious constant statistical characteristics; i.e. we cannot
conclude that the mean and variance do not depend on time. Therefore we can conclude that the series
does indeed contain a linear component, the original series is non-trend stationary and there is a unit
root present. Thus differencing the detrended series is the next course of action.
7. Differencing:
I will now define the de-trended series as Zt = Yt –TCt where TCt represents the trend component. I will
attempt to make the series stationary by differencing. This can be defined by:
Δ Zt = Zt - Zt-1
1441281129680644832161
1.75
1.50
1.25
1.00
0.75
0.50
Index
DETR1
Time Series Plot of Detrended Data
We should always be careful when differencing. Overdifferencing introduces unnecessary correlations
into a series and will complicate the modelling process. Thus it can jeopardise the accuracy of the
model. In addition, over differenced series’ produce less stable coefficient estimates due to
invertibility. Non-invertible models also create serious problems when one attempts to estimate their
parameters. The model should only be differenced the appropriate number of times. One should
constantly bare The Principle of Parsimony in mind- “keep models simple but not too simple.”
If we begin the differencing process by differencing the de-trended time series once, the following time
series plot ensues.
Figure 5
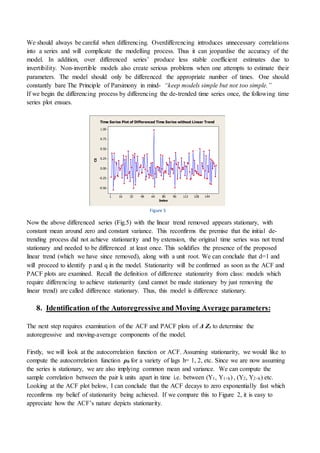
Now the above differenced series (Fig.5) with the linear trend removed appears stationary, with
constant mean around zero and constant variance. This reconfirms the premise that the initial de-
trending process did not achieve stationarity and by extension, the original time series was not trend
stationary and needed to be differenced at least once. This solidifies the presence of the proposed
linear trend (which we have since removed), along with a unit root. We can conclude that d=1 and
will proceed to identify p and q in the model. Stationarity will be confirmed as soon as the ACF and
PACF plots are examined. Recall the definition of difference stationarity from class: models which
require differencing to achieve stationarity (and cannot be made stationary by just removing the
linear trend) are called difference stationary. Thus, this model is difference stationary.
8. Identification of the Autoregressive and Moving Average parameters:
The next step requires examination of the ACF and PACF plots of Δ Zt to determine the
autoregressive and moving-average components of the model.
Firstly, we will look at the autocorrelation function or ACF. Assuming stationarity, we would like to
compute the autocorrelation function ρh for a variety of lags h= 1, 2, etc. Since we are now assuming
the series is stationary, we are also implying common mean and variance. We can compute the
sample correlation between the pair k units apart in time i.e. between (Y1, Y1+k) , (Y2, Y2+k) etc.
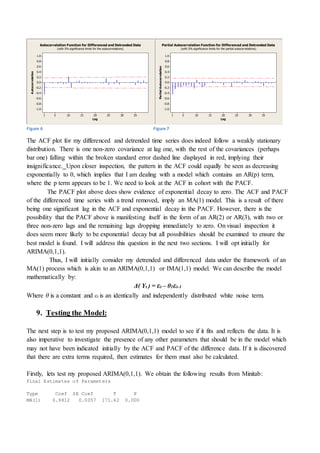
Looking at the ACF plot below, I can conclude that the ACF decays to zero exponentially fast which
reconfirms my belief of stationarity being achieved. If we compare this to Figure 2, it is easy to
appreciate how the ACF’s nature depicts stationarity.
1441281129680644832161
1.00
0.75
0.50
0.25
0.00
-0.25
-0.50
Index
C5
Time Series Plot of Differenced Time Series without Linear Trend
Figure 6 Figure 7
The ACF plot for my differenced and detrended time series does indeed follow a weakly stationary
distribution. There is one non-zero covariance at lag one, with the rest of the covariances (perhaps
bar one) falling within the broken standard error dashed line displayed in red, implying their
insignificance. Upon closer inspection, the pattern in the ACF could equally be seen as decreasing
exponentially to 0, which implies that I am dealing with a model which contains an AR(p) term,
where the p term appears to be 1. We need to look at the ACF in cohort with the PACF.
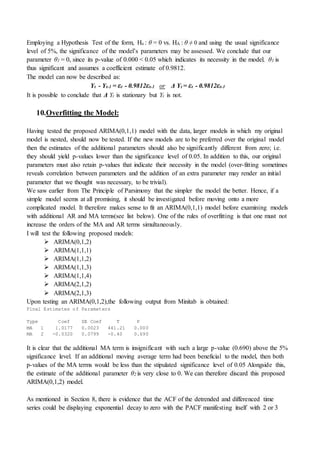
The PACF plot above does show evidence of exponential decay to zero. The ACF and PACF
of the differenced time series with a trend removed, imply an MA(1) model. This is a result of there
being one significant lag in the ACF and exponential decay in the PACF. However, there is the
possibility that the PACF above is manifesting itself in the form of an AR(2) or AR(3), with two or
three non-zero lags and the remaining lags dropping immediately to zero. On visual inspection it
does seem more likely to be exponential decay but all possibilities should be examined to ensure the
best model is found. I will address this question in the next two sections. I will opt initially for
ARIMA(0,1,1).
Thus, I will initially consider my detrended and differenced data under the framework of an
MA(1) process which is akin to an ARIMA(0,1,1) or IMA(1,1) model. We can describe the model
mathematically by:
Δ( Yt ) = εt – θ1εt-1
Where θ is a constant and εt is an identically and independently distributed white noise term.
9. Testing the Model:
The next step is to test my proposed ARIMA(0,1,1) model to see if it fits and reflects the data. It is
also imperative to investigate the presence of any other parameters that should be in the model which
may not have been indicated initially by the ACF and PACF of the difference data. If it is discovered
that there are extra terms required, then estimates for them must also be calculated.
Firstly, lets test my proposed ARIMA(0,1,1). We obtain the following results from Minitab:
Final Estimates of Parameters
Type Coef SE Coef T P
MA(1) 0.9812 0.0057 171.62 0.000
35302520151051
1.0
0.8
0.6
0.4
0.2
0.0
-0.2
-0.4
-0.6
-0.8
-1.0
Lag
Autocorrelation
Autocorrelation Function for Differenced and Detrended Data
(with 5% significance limits for the autocorrelations)
35302520151051
1.0
0.8
0.6
0.4
0.2
0.0
-0.2
-0.4
-0.6
-0.8
-1.0
Lag
PartialAutocorrelation
Partial Autocorrelation Function for Differenced and Detrended Data
(with 5% significance limits for the partial autocorrelations)
Employing a Hypothesis Test of the form, Ho : θ = 0 vs. HA : θ ≠ 0 and using the usual significance
level of 5%, the significance of the model’s parameters may be assessed. We conclude that our
parameter θ1 = 0, since its p-value of 0.000 < 0.05 which indicates its necessity in the model. θ1 is
thus significant and assumes a coefficient estimate of 0.9812.
The model can now be described as:
Yt - Yt-1 = εt - 0.9812εt-1 or Δ Yt = εt - 0.9812εt-1
It is possible to conclude that Δ Yt is stationary but Yt is not.
10.Overfitting the Model:
Having tested the proposed ARIMA(0,1,1) model with the data, larger models in which my original
model is nested, should now be tested. If the new models are to be preferred over the original model
then the estimates of the additional parameters should also be significantly different from zero; i.e.
they should yield p-values lower than the significance level of 0.05. In addition to this, our original
parameters must also retain p-values that indicate their necessity in the model (over-fitting sometimes
reveals correlation between parameters and the addition of an extra parameter may render an initial
parameter that we thought was necessary, to be trivial).
We saw earlier from The Principle of Parsimony that the simpler the model the better. Hence, if a
simple model seems at all promising, it should be investigated before moving onto a more
complicated model. It therefore makes sense to fit an ARIMA(0,1,1) model before examining models
with additional AR and MA terms(see list below). One of the rules of overfitting is that one must not
increase the orders of the MA and AR terms simultaneously.
I will test the following proposed models:
 ARIMA(0,1,2)
 ARIMA(1,1,1)
 ARIMA(1,1,2)
 ARIMA(1,1,3)
 ARIMA(1,1,4)
 ARIMA(2,1,2)
 ARIMA(2,1,3)
Upon testing an ARIMA(0,1,2),the following output from Minitab is obtained:
Final Estimates of Parameters
Type Coef SE Coef T P
MA 1 1.0177 0.0023 441.21 0.000
MA 2 -0.0320 0.0799 -0.40 0.690
It is clear that the additional MA term is insignificant with such a large p-value (0.690) above the 5%
significance level. If an additional moving average term had been beneficial to the model, then both
p-values of the MA terms would be less than the stipulated significance level of 0.05 Alongside this,
the estimate of the additional parameter θ2 is very close to 0. We can therefore discard this proposed
ARIMA(0,1,2) model.
As mentioned in Section 8, there is evidence that the ACF of the detrended and differenced time
series could be displaying exponential decay to zero with the PACF manifesting itself with 2 or 3
significant lags. For these reasons I will first overfit for an ARIMA(1,1,1) model. Upon testing for
this model, the following output from Minitab is obtained:
Final Estimates of Parameters
Type Coef SE Coef T P
AR 1 -0.4458 0.0724 -6.15 0.000
MA 1 0.9868 0.0012 819.15 0.000
It is clear that the additional AR term is very significant with a p value of zero. The premise that the
ACF and PACF from section 8 suggested an autoregressive term seems to have been satisfied. In
conjunction with this, the MA term p value has not changed at all and its coefficient has changed
negligibly from 0.9812 to 0.9868. I will continue to overfit MA terms.
I will now test an ARIMA(1,1,2) for which I obtain the following results from Minitab:
Final Estimates of Parameters
Type Coef SE Coef T P
AR 1 -0.5505 0.0741 -7.43 0.000
MA 1 0.8077 0.0102 79.52 0.000
MA 2 0.1844 0.0602 3.07 0.003
The additional second MA term is significant. I will now test an ARIMA(1,1,3) for which I obtain
the following results from Minitab:
Final Estimates of Parameters
Type Coef SE Coef T P
AR 1 -0.7598 0.0635 -11.96 0.000
MA 1 0.8052 0.0076 105.95 0.000
MA 2 0.5950 0.0592 10.05 0.000
MA 3 -0.4135 0.0749 -5.52 0.000
The third MA term is significant. I will now test and ARIMA(1,1,4) for which I obtain the following
results from Minitab:
Final Estimates of Parameters
Type Coef SE Coef T P
AR 1 -0.7632 0.0835 -9.14 0.000
MA 1 0.7733 0.0194 39.83 0.000
MA 2 0.6140 0.0876 7.01 0.000
MA 3 -0.3736 0.1218 -3.07 0.003
MA 4 -0.0294 0.0857 -0.34 0.732
The fourth MA term yields a p-value of 0.732 so I will stop overfitting the MA terms and conclude
that q=3. I will now test for an ARIMA(2,1,2) and ARIMA(2,1,3) for which I obtain the following
results from Minitab:
Final Estimates of Parameters ARIMA(2,1,2) Final Estimates of Parameters ARIMA(2,1,3)
Type Coef SE Coef T P Type Coef SE Coef T P
AR 1 -0.9731 0.3471 -2.80 0.006 AR 1 -0.8293 0.0821 -10.11 0.000
AR 2 -0.3519 0.1422 -2.47 0.014 AR 2 -0.0462 0.0947 -0.49 0.626
MA 1 0.5125 0.3431 1.49 0.137 MA 1 0.7916 0.0113 70.10 0.000
MA 2 0.4732 0.3764 1.26 0.211 MA 2 0.6481 0.0558 11.62 0.000
MA 3 -0.4519 0.0730 -6.19 0.000
These final parameter test suggest that I should favour an ARIMA (1,1,3) model after the overfitting
process of my originally proposed ARIMA(0,1,1) model. To investigate this hypothesis further I can
compare the mean-squared error of the residuals from an ARIMA(0,1,1), ARIMA(1,1,1),
ARIMA(1,1,2) and an ARIMA(1,1,3).(Note: backforecasts are excluded in these calculations.)
For the ARIMA(0,1,1) we obtain:
Residuals: SS = 8.77356
MS = 0.05697 DF = 154
For the ARIMA(1,1,1) we obtain:
Residuals: SS = 7.03196
MS = 0.04596 DF = 153
For the ARIMA(1,1,2) we obtain:
Residuals: SS = 7.26631
MS = 0.04780 DF = 152
For the ARIMA(1,1,3) we obtain:
Residuals: SS = 6.27891
MS = 0.04158 DF = 151
The lowest mean-squared error of the residuals of the above test is that of the ARIMA(1,1,3) model
which thus offers justification for its use. I will give preference to an ARIMA(1,1,3) model. The
results of the following test will reaffirm this preference.
10.1 Ljung- Box Pierce Chi Squared Test Statistic:
The Ljung-Box-Pierce test statistic, Q, tells us if the model we have chosen is a good fit by taking a
weighted sum of the residual auto-correlations. It can happen that even when most of the residual
autocorrelations are moderate when taken together, they may seem excessive. In addition to looking
at residual correlations at individual lags, it takes into account their magnitudes as a group. The
Ljung-Box Pierce test statistic of order K is defined as:
If the ARMA (p,q) model is correct, then Q-> χ²k-p-q , Otherwise Q -> ∞. It tests the null hypothesis
Ho: the error terms are uncorrelated. This can be equivalently looked upon as:
Ho: Model is Adequate (Residuals are not Correlated)
Vs.
HA: Model is Inadequate
For a model which is not suited to the data, the sum will be large. Better models should have smaller
Q values and larger p-values at the lags. I computed the following test statistics in Minitab:
ARIMA(0,1,1):
Modified Box-Pierce (Ljung-Box) Chi-Square statistic
Lag 12 24 36 48
Chi-Square 45.4 52.6 58.9 71.9
DF 11 23 35 47
P-Value 0.000 0.000 0.007 0.01
ARIMA(1,1,1):
Modified Box-Pierce (Ljung-Box) Chi-Square statistic
Lag 12 24 36 48
Chi-Square 26.9 38.4 42.0 55.1
DF 10 22 34 46
P-Value 0.003 0.016 0.164 0.167
ARIMA(1,1,2):
Modified Box-Pierce (Ljung-Box) Chi-Square statistic
Lag 12 24 36 48
Chi-Square 30.7 41.2 44.8 58.4
DF 9 21 33 45
P-Value 0.000 0.005 0.082 0.087
ARIMA(1,1,3):
Modified Box-Pierce (Ljung-Box) Chi-Square statistic
Lag 12 24 36 48
Chi-Square 15.8 28.7 32.5 44.1
DF 8 20 32 44
P-Value 0.045 0.094 0.443 0.469
It is clear that the ARIMA(1,1,3) model offers much higher P-Values at each lag , insinuating its
suitability ,and substantially lower Q values when juxtaposed to the other models. This reconfirms
my preference for continuing with the ARIMA(1,1,3) model.
11.ModelDiagnostics:
A number of diagnostic tests can be carried out to investigate the goodness of fit of a model. If the
model is a good for the sample data, we would expect the residuals to be distributed as white noise
terms. White noise is defined as a sequence of independent and identically distributed random
variables. It is strictly stationary and is assumed to follow a normal distribution with mean zero and
constant variance. I will now investigate whether the residuals of my suggested ARIMA(1,1,3)
possess these residual conditions.
Note: These residual tests are to be carried out on the detrended series Δ Zt .
11.1 Time Series plot of the Residuals:
1441281129680644832161
1.00
0.75
0.50
0.25
0.00
-0.25
-0.50
Index
RESI1
Time Series Plot of Residuals of Detrended ARIMA(1,1,3)
Figure 8
The time series plot above (Figure 8), of the residuals clearly demonstrates that they are normally
distributed around mean zero. The spread of the residuals around the mean of zero implies constant
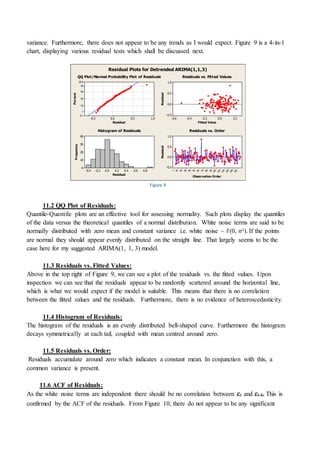
variance. Furthermore, there does not appear to be any trends as I would expect. Figure 9 is a 4-in-1
chart, displaying various residual tests which shall be discussed next.
1.00.50.0-0.5
99.9
99
90
50
10
1
0.1
Residual
Percent
0.20.0-0.2-0.4-0.6
1.0
0.5
0.0
-0.5
Fitted Value
Residual
0.80.60.40.20.0-0.2-0.4
40
30
20
10
0
Residual
Frequency
150
140
130
120
110
1009080706050403020101
1.0
0.5
0.0
-0.5
Observation Order
Residual
QQ Plot/Normal Probability Plot of Residuals Residuals vs. Fitted Values
Histogram of Residuals Residuals vs. Order
Residual Plots for Detrended ARIMA(1,1,3)
Figure 9
11.2 QQ Plot of Residuals:
Quantile-Quantile plots are an effective tool for assessing normality. Such plots display the quantiles
of the data versus the theoretical quantiles of a normal distribution. White noise terms are said to be
normally distributed with zero mean and constant variance i.e. white noise ~ N (0, σ²). If the points
are normal they should appear evenly distributed on the straight line. That largely seems to be the
case here for my suggested ARIMA(1, 1, 3) model.
11.3 Residuals vs. Fitted Values:
Above in the top right of Figure 9, we can see a plot of the residuals vs. the fitted values. Upon
inspection we can see that the residuals appear to be randomly scattered around the horizontal line,
which is what we would expect if the model is suitable. This means that there is no correlation
between the fitted values and the residuals. Furthermore, there is no evidence of heteroscedasticity.
11.4 Histogram of Residuals:
The histogram of the residuals is an evenly distributed bell-shaped curve. Furthermore the histogram
decays symmetrically at each tail, coupled with mean centred around zero.
11.5 Residuals vs. Order:
Residuals accumulate around zero which indicates a constant mean. In conjunction with this, a
common variance is present.
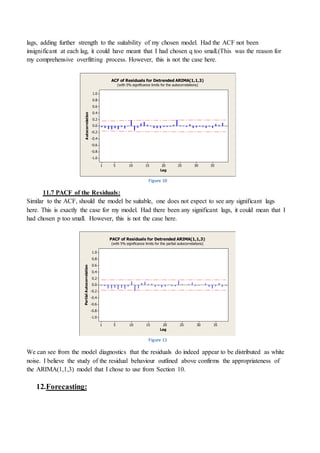
11.6 ACF of Residuals:
As the white noise terms are independent there should be no correlation between εt and εt-k. This is
confirmed by the ACF of the residuals. From Figure 10, there do not appear to be any significant
lags, adding further strength to the suitability of my chosen model. Had the ACF not been
insignificant at each lag, it could have meant that I had chosen q too small.(This was the reason for
my comprehensive overfitting process. However, this is not the case here.
35302520151051
1.0
0.8
0.6
0.4
0.2
0.0
-0.2
-0.4
-0.6
-0.8
-1.0
Lag
Autocorrelation
ACF of Residuals for Detrended ARIMA(1,1,3)
(with 5% significance limits for the autocorrelations)
Figure 10
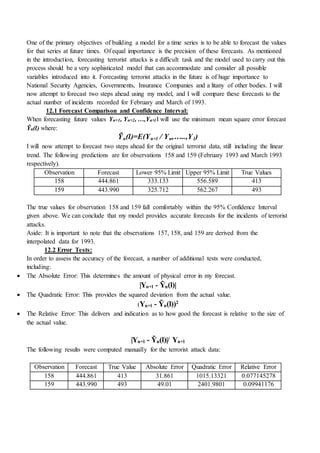
11.7 PACF of the Residuals:
Similar to the ACF, should the model be suitable, one does not expect to see any significant lags
here. This is exactly the case for my model. Had there been any significant lags, it could mean that I
had chosen p too small. However, this is not the case here.
Figure 11
We can see from the model diagnostics that the residuals do indeed appear to be distributed as white
noise. I believe the study of the residual behaviour outlined above confirms the appropriateness of
the ARIMA(1,1,3) model that I chose to use from Section 10.
12.Forecasting:
35302520151051
1.0
0.8
0.6
0.4
0.2
0.0
-0.2
-0.4
-0.6
-0.8
-1.0
Lag
PartialAutocorrelation
PACF of Residuals for Detrended ARIMA(1,1,3)
(with 5% significance limits for the partial autocorrelations)
One of the primary objectives of building a model for a time series is to be able to forecast the values
for that series at future times. Of equal importance is the precision of these forecasts. As mentioned
in the introduction, forecasting terrorist attacks is a difficult task and the model used to carry out this
process should be a very sophisticated model that can accommodate and consider all possible
variables introduced into it. Forecasting terrorist attacks in the future is of huge importance to
National Security Agencies, Governments, Insurance Companies and a litany of other bodies. I will
now attempt to forecast two steps ahead using my model, and I will compare these forecasts to the
actual number of incidents recorded for February and March of 1993.
12.1 Forecast Comparison and Confidence Interval:
When forecasting future values Yn+1, Yn+2, …,Yn+l I will use the minimum mean square error forecast
Ỹn(l) where:
Ỹn(l)=E(Yn+l / Yn,…..,Y1)
I will now attempt to forecast two steps ahead for the original terrorist data, still including the linear
trend. The following predictions are for observations 158 and 159 (February 1993 and March 1993
respectively).
Observation Forecast Lower 95% Limit Upper 95% Limit True Values
158 444.861 333.133 556.589 413
159 443.990 325.712 562.267 493
The true values for observation 158 and 159 fall comfortably within the 95% Confidence Interval
given above. We can conclude that my model provides accurate forecasts for the incidents of terrorist
attacks.
Aside: It is important to note that the observations 157, 158, and 159 are derived from the
interpolated data for 1993.
12.2 Error Tests:
In order to assess the accuracy of the forecast, a number of additional tests were conducted,
including:
 The Absolute Error: This determines the amount of physical error in my forecast.
|Yn+l - Ỹn(l)|
 The Quadratic Error: This provides the squared deviation from the actual value.
(Yn+l - Ỹn(l))2
 The Relative Error: This delivers and indication as to how good the forecast is relative to the size of
the actual value.
|Yn+l - Ỹn(l)|/ Yn+l
The following results were computed manually for the terrorist attack data:
Observation Forecast True Value Absolute Error Quadratic Error Relative Error
158 444.861 413 31.861 1015.13321 0.077145278
159 443.990 493 49.01 2401.9801 0.09941176
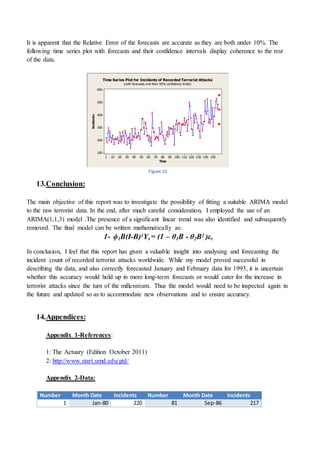
It is apparent that the Relative Error of the forecasts are accurate as they are both under 10%. The
following time series plot with forecasts and their confidence intervals display coherence to the rest
of the data.
Figure 12
13.Conclusion:
The main objective of this report was to investigate the possibility of fitting a suitable ARIMA model
to the raw terrorist data. In the end, after much careful consideration, I employed the use of an
ARIMA(1,1,3) model .The presence of a significant linear trend was also identified and subsequently
removed. The final model can be written mathematically as:
1- ϕ1B(I-B)1Yt = (1 – θ1B - θ2B2 )εt
In conclusion, I feel that this report has given a valuable insight into analysing and forecasting the
incident count of recorded terrorist attacks worldwide. While my model proved successful in
describing the data, and also correctly forecasted January and February data for 1993, it is uncertain
whether this accuracy would hold up in more long-term forecasts or would cater for the increase in
terrorist attacks since the turn of the millennium. Thus the model would need to be inspected again in
the future and updated so as to accommodate new observations and to ensure accuracy.
14.Appendices:
Appendix 1-References:
1: The Actuary (Edition October 2011)
2: http://www.start.umd.edu/gtd/
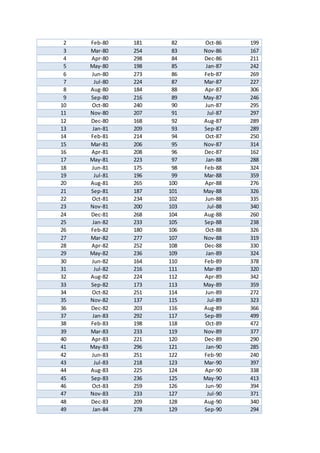
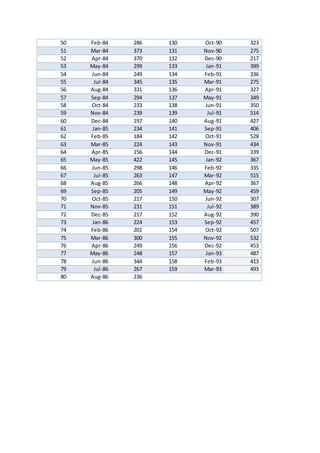
Appendix 2-Data:
Number Month Date Incidents Number Month Date Incidents
1 Jan-80 220 81 Sep-86 217
1501401301201101009080706050403020101
600
500
400
300
200
100
Time
Incidents
Time Series Plot for Incidents of Recorded Terrorist Attacks
(with forecasts and their 95% confidence limits)
2 Feb-80 181 82 Oct-86 199
3 Mar-80 254 83 Nov-86 167
4 Apr-80 298 84 Dec-86 211
5 May-80 198 85 Jan-87 242
6 Jun-80 273 86 Feb-87 269
7 Jul-80 224 87 Mar-87 227
8 Aug-80 184 88 Apr-87 306
9 Sep-80 216 89 May-87 246
10 Oct-80 240 90 Jun-87 295
11 Nov-80 207 91 Jul-87 297
12 Dec-80 168 92 Aug-87 289
13 Jan-81 209 93 Sep-87 289
14 Feb-81 214 94 Oct-87 250
15 Mar-81 206 95 Nov-87 314
16 Apr-81 208 96 Dec-87 162
17 May-81 223 97 Jan-88 288
18 Jun-81 175 98 Feb-88 324
19 Jul-81 196 99 Mar-88 359
20 Aug-81 265 100 Apr-88 276
21 Sep-81 187 101 May-88 326
22 Oct-81 234 102 Jun-88 335
23 Nov-81 200 103 Jul-88 340
24 Dec-81 268 104 Aug-88 260
25 Jan-82 233 105 Sep-88 238
26 Feb-82 180 106 Oct-88 326
27 Mar-82 277 107 Nov-88 319
28 Apr-82 252 108 Dec-88 330
29 May-82 236 109 Jan-89 324
30 Jun-82 164 110 Feb-89 378
31 Jul-82 216 111 Mar-89 320
32 Aug-82 224 112 Apr-89 342
33 Sep-82 173 113 May-89 359
34 Oct-82 251 114 Jun-89 272
35 Nov-82 137 115 Jul-89 323
36 Dec-82 203 116 Aug-89 366
37 Jan-83 292 117 Sep-89 499
38 Feb-83 198 118 Oct-89 472
39 Mar-83 233 119 Nov-89 377
40 Apr-83 221 120 Dec-89 290
41 May-83 296 121 Jan-90 285
42 Jun-83 251 122 Feb-90 240
43 Jul-83 218 123 Mar-90 397
44 Aug-83 225 124 Apr-90 338
45 Sep-83 236 125 May-90 413
46 Oct-83 259 126 Jun-90 394
47 Nov-83 233 127 Jul-90 371
48 Dec-83 209 128 Aug-90 340
49 Jan-84 278 129 Sep-90 294
50 Feb-84 286 130 Oct-90 323
51 Mar-84 373 131 Nov-90 275
52 Apr-84 370 132 Dec-90 217
53 May-84 299 133 Jan-91 399
54 Jun-84 249 134 Feb-91 336
55 Jul-84 345 135 Mar-91 275
56 Aug-84 331 136 Apr-91 327
57 Sep-84 294 137 May-91 349
58 Oct-84 233 138 Jun-91 350
59 Nov-84 239 139 Jul-91 514
60 Dec-84 197 140 Aug-91 427
61 Jan-85 234 141 Sep-91 406
62 Feb-85 184 142 Oct-91 528
63 Mar-85 224 143 Nov-91 434
64 Apr-85 156 144 Dec-91 339
65 May-85 422 145 Jan-92 367
66 Jun-85 298 146 Feb-92 335
67 Jul-85 263 147 Mar-92 515
68 Aug-85 266 148 Apr-92 367
69 Sep-85 205 149 May-92 459
70 Oct-85 217 150 Jun-92 307
71 Nov-85 231 151 Jul-92 389
72 Dec-85 217 152 Aug-92 390
73 Jan-86 224 153 Sep-92 457
74 Feb-86 201 154 Oct-92 507
75 Mar-86 300 155 Nov-92 532
76 Apr-86 249 156 Dec-92 453
77 May-86 248 157 Jan-93 487
78 Jun-86 344 158 Feb-93 413
79 Jul-86 267 159 Mar-93 493
80 Aug-86 236

More Related Content

Viewers also liked

Project time series ppt
Project time series pptProject time series ppt
Project time series ppt
amar patil
 

Viewers also liked (7)

Seasonal modeling in time series with R
Seasonal modeling in time series with RSeasonal modeling in time series with R
Seasonal modeling in time series with R
 
Project time series ppt
Project time series pptProject time series ppt
Project time series ppt
 
Statistics Project Report
Statistics Project ReportStatistics Project Report
Statistics Project Report
 
Mutiple linear regression project
Mutiple linear regression projectMutiple linear regression project
Mutiple linear regression project
 
SSA slides
SSA slidesSSA slides
SSA slides
 
Using Singular Spectrum Analysis to Model Electricity Prices
Using Singular Spectrum Analysis  to Model Electricity PricesUsing Singular Spectrum Analysis  to Model Electricity Prices
Using Singular Spectrum Analysis to Model Electricity Prices
 
Statistics Project
Statistics ProjectStatistics Project
Statistics Project
 

Similar to Time Series Project

paper on forecasting terrorism
paper on forecasting terrorismpaper on forecasting terrorism
paper on forecasting terrorism
Ajay Ohri
 
FormalWriteupTornado_1
FormalWriteupTornado_1FormalWriteupTornado_1
FormalWriteupTornado_1
Katie Harvey
 
Available online at www.sciencedirect.comComputers & Industr.docx
Available online at www.sciencedirect.comComputers & Industr.docxAvailable online at www.sciencedirect.comComputers & Industr.docx
Available online at www.sciencedirect.comComputers & Industr.docx
rock73
 

Similar to Time Series Project (20)

C0413016018
C0413016018C0413016018
C0413016018
 
paper on forecasting terrorism
paper on forecasting terrorismpaper on forecasting terrorism
paper on forecasting terrorism
 
A HYBRID APPROACH COMBINING RULE-BASED AND ANOMALY-BASED DETECTION AGAINST DD...
A HYBRID APPROACH COMBINING RULE-BASED AND ANOMALY-BASED DETECTION AGAINST DD...A HYBRID APPROACH COMBINING RULE-BASED AND ANOMALY-BASED DETECTION AGAINST DD...
A HYBRID APPROACH COMBINING RULE-BASED AND ANOMALY-BASED DETECTION AGAINST DD...
 
A HYBRID APPROACH COMBINING RULE-BASED AND ANOMALY-BASED DETECTION AGAINST DD...
A HYBRID APPROACH COMBINING RULE-BASED AND ANOMALY-BASED DETECTION AGAINST DD...A HYBRID APPROACH COMBINING RULE-BASED AND ANOMALY-BASED DETECTION AGAINST DD...
A HYBRID APPROACH COMBINING RULE-BASED AND ANOMALY-BASED DETECTION AGAINST DD...
 
Probabilistic models for anomaly detection based on usage of network traffic
Probabilistic models for anomaly detection based on usage of network trafficProbabilistic models for anomaly detection based on usage of network traffic
Probabilistic models for anomaly detection based on usage of network traffic
 
Dss for emergency response
Dss for emergency responseDss for emergency response
Dss for emergency response
 
FormalWriteupTornado_1
FormalWriteupTornado_1FormalWriteupTornado_1
FormalWriteupTornado_1
 
430 PROJJ
430 PROJJ430 PROJJ
430 PROJJ
 
A Survey on Data Mining Techniques for Crime Hotspots Prediction
A Survey on Data Mining Techniques for Crime Hotspots PredictionA Survey on Data Mining Techniques for Crime Hotspots Prediction
A Survey on Data Mining Techniques for Crime Hotspots Prediction
 
Intraday news event_study
Intraday news event_studyIntraday news event_study
Intraday news event_study
 
Chapter Nine(1).docx
Chapter Nine(1).docxChapter Nine(1).docx
Chapter Nine(1).docx
 
Quantitive Time Series Analysis of Malware and Vulnerability Trends
Quantitive Time Series Analysis of Malware and Vulnerability TrendsQuantitive Time Series Analysis of Malware and Vulnerability Trends
Quantitive Time Series Analysis of Malware and Vulnerability Trends
 
Available online at www.sciencedirect.comComputers & Industr.docx
Available online at www.sciencedirect.comComputers & Industr.docxAvailable online at www.sciencedirect.comComputers & Industr.docx
Available online at www.sciencedirect.comComputers & Industr.docx
 
Data science
Data scienceData science
Data science
 
Classifying Crises-Information Relevancy with Semantics
Classifying Crises-Information Relevancy with SemanticsClassifying Crises-Information Relevancy with Semantics
Classifying Crises-Information Relevancy with Semantics
 
Major project.pptx
Major project.pptxMajor project.pptx
Major project.pptx
 
Multipleregression covidmobility and Covid-19 policy recommendation
Multipleregression covidmobility and Covid-19 policy recommendationMultipleregression covidmobility and Covid-19 policy recommendation
Multipleregression covidmobility and Covid-19 policy recommendation
 
San Francisco Crime Analysis Classification Kaggle contest
San Francisco Crime Analysis Classification Kaggle contestSan Francisco Crime Analysis Classification Kaggle contest
San Francisco Crime Analysis Classification Kaggle contest
 
Glm
GlmGlm
Glm
 
KIT-601 Lecture Notes-UNIT-2.pdf
KIT-601 Lecture Notes-UNIT-2.pdfKIT-601 Lecture Notes-UNIT-2.pdf
KIT-601 Lecture Notes-UNIT-2.pdf
 

Time Series Project

  • 1. Time Series Project: An Investigation into the Incidents of Recorded Terrorist Attacks Worldwide (January 1980- January 1993) Contents 1. Abstract 2. Introduction 3. Methods 4. Modelling the Data 5. Seasonality 6. Detrending 7. Differencing 8. Identification of the Autoregressive and Moving Average parameters. 9. Testing the Model 10. Overfitting the Model 10.1. Ljung-Box Pierce Chi Squared Test Statistic 11. Model Diagnostics 11.1 Time Series plot of the Residuals 11.2 QQ Plot of Residuals 11.3 Residuals vs. Fitted Values 11.4 Histogram of Residuals 11.5 Residuals vs. Order 11.6 ACF of Residuals 11.7 PACF of Residuals 12. Forecasting 12.1 Forecast Comparison and Confidence Interval 12.2 Error Tests 13. Conclusion 14. Appendix and Referencing -Appendix 1 -Appendix 2
  • 2. 1. Abstract: This project investigates the incidents of recorded terrorist attacks worldwide under a Mathematical Time Series framework. I wanted to choose a data set which could, if in part, elucidate the nature of an aspect of human behaviour which may be governed by a ‘trend’, as opposed to choosing a data set such as stock price fluctuation which is ultimately a Random Walk. Terrorist attacks are often engendered by retaliation, so this project proposes a fitting and suitable ARIMA model which could be used as a forecasting tool to predict these retaliations. The findings outlined in this project would be of particular interest to Actuaries or Risk Managers who work in Catastrophe Modelling and who are engaged with fine-tuning of risk in accordance to Solvency II. These professionals are faced with the task of predicting the likelihood and frequency of terrorist attacks and making predictions about the change in number of incidents over time. There exist huge liabilities that insurance companies must pay out, should such terrorist incidents occur, and miscalculation, misinterpretation or under-prediction of these pay-outs are of paramount interest to these companies. The data required to build knowledge about the threat of these attacks include frequency, methods, targets and perpetrators. The expertise needed to understand the threat must encompass the geopolitical situation, motivations, capabilities, causes and mitigation. A credible model should take into account all these factors and make contextual assumptions in order to formulate a robust forecast of the risk.1 2. Introduction: I sourced this data from Global Terrorism Database (GTD) Codebook: Inclusion Criteria and Variables.2 The document reflects the collection and coding rules for the GTD, maintained by the National Consortium for the Study of Terrorism and Responses to Terrorism (START). The current GTD is the product of several phases of data collection efforts, each relying on the examination of approximately 12,000 to 16,000 articles monthly .The collection and refining of the data comes from sources including publicly available sources, unclassified source materials such as media articles and electronic news archives, and to a lesser extent, existing data sets, secondary source materials such as books and journals and legal documents. Incidents of Terrorism from the year 1993 are not present in the GTD Data set because they were lost prior to START’s compilation for the GTD when the data was being transferred from Pinkerton Global Intelligence Service (PGIS). Due to the challenges of retrospective data collection for events that happened more than 15 years ago, the number of cases for 1993 is only 15 % of the number reported by PGIS. In an effort to ameliorate this gap, Appendix II of the Codebook provides marginal counts which can be used, so as to interpolate values for the missing 1993 cases. The GTD defines a terrorist attack as the threatened or actual use of illegal force and violence by a non‐state actor to attain a political, economic, religious, or social goal through fear, coercion, or intimidation. In practice this means in order to consider an incident for inclusion in the GTD, all three of the following attributes must be present:
  • 3.  The incident must be intentional – the result of a conscious calculation on the part of a perpetrator.  The incident must entail some level of violence or threat of violence ‐including property violence, as well as violence against people.  The perpetrators of the incidents must be sub‐national actors. The database does not include acts of state terrorism. In addition, at least two of the following three criteria must be present for an incident to be included in the GTD:  Criterion 1: The act must be aimed at attaining a political, economic, religious, or social goal.  Criterion 2: There must be evidence of an intention to coerce, intimidate, or convey some other message to a larger audience (or audiences) than the immediate victims: As long as any of the planners or decision‐makers behind the attack intended to coerce, intimidate or publicize, the intentionality criterion is met.  Criterion 3: The action must be outside the context of legitimate warfare activities. Finally, it is the policy of the Department of Homeland Security to protect the privacy of individuals. The information I requested from the Global Terrorism Database contains information related to specific individuals. Thus, I am required by the Department of Homeland Security to take every possible precaution to protect this information and that I will use it for the sole purpose of advancing the understanding of terrorism. 3. Methods: There were an amazing 125,087 counts of terrorist attacks contained in the data set from the 1rst January 1970 until the 31rst December 2013 (excluding data counts from 1993). From this data set, I conducted manual monthly counts on the truncated data from January 1980 to January 1993 which resulted in observations spanning over 13 years (157 observations). This time period also contains the interpolated data for January 1993. The data was investigated by analysing the ACF, PACF and Residual Plots under the guidelines laid out by the Autoregressive Integrated Moving Average (ARIMA) model, suggested by George Box and Gwilym Jenkins in 1976. The Box-Jenkins type ARIMA process can be defined as: ϕp (B)(I-B)d Yt = θq(B)εt where ϕp (B) is the autoregressive polynomial of order p, (I-B)d is the differencing operator, θq(B) is the moving average polynomial of order q, and the εt is a Gaussian white noise sequence with mean 0 and variance σ2. The value Yt refers to the monthly count of terrorist attacks worldwide. The B is the backshift operator such that BjYt = Yt -j. We expand the autoregressive polynomial: ϕp (B)=1- ϕ1B - ϕ2B2- . . . - ϕp(B)p such that all of the roots of the polynomial are outside of the unit circle. Similarly, we can expand the moving average polynomial such that: θq(B) = 1 – θ1B - θ2B2- . . . -θq(B)q
  • 4. where all of the roots of the moving average polynomial are outside of the unit circle. We also assume that the autoregressive and moving average polynomials have no roots in common. Finally, the (1 - B)d polynomial reflects the order of differencing needed to achieve stationarity. Such an expression is referred to as an autoregressive integrated moving average model, or ARIMA (p,d,q) model. Note: Minitab was used to create all graphs and derive all statistical results. 4. Modelling the Data: Figure 1 Figure 2 For a time series to be defined as (weakly) stationary the time series should satisfy all three following requirements: a constant mean, a constant variance and the autocorrelation between any two observations should depend only on the lag k between them. The mean in the graph above is certainly not constant, and by extension, the time series is not stationary. The series appears to display an increasing trend, and by extension one might be able to claim that the incidents are manifesting themselves as a function of time. An interesting question to ask would be: ‘Why does there appear to be an upward trend in the incidents of recorded terrorist attacks from January 1980 through to December 1993?’ The autocorrelation function also supports the claim of non-stationary. The ACF plot above presents us with a very slow, approximately linear decay to zero, often associated with a series which has a unit root; a problem which can be solved by differencing. The unit root problem in time series arises when either the autoregressive or moving-average polynomial of an ARMA model has a root on or near the unit circle. A unit root in either of these polynomials has important implications for modelling. For example, a root near 1 of the autoregressive polynomial suggests that the data should be differenced before fitting an ARMA model, whereas a root near 1 of the moving average polynomial indicates that the data were over-differenced. The ACF fails to die out rapidly as the lags increase, hence we can conclude that d>0 pointing to the presence of at least one unit root or perhaps the presence of a trend, or both. 5. Seasonality: 1441281129680644832161 500 400 300 200 100 Index Incidents Time Series Plot of Incidents of Recorded Terrorist Attacks 35302520151051 1.0 0.8 0.6 0.4 0.2 0.0 -0.2 -0.4 -0.6 -0.8 -1.0 Lag Autocorrelation Autocorrelation Function for Incidents (with 5% significance limits for the autocorrelations)
  • 5. It is worth noting before I go any further in my analysis that there does not appear to be any seasonality. Incidents of terrorist attacks should not logically display seasnonality. What I mean by seasonality is cyclical variation or periodic fluctuations. These can be as repetitive and predictable movement around the trend line in 1 year or less. Seasonality can also clearly be seen by a periodic pattern in the ACF, which is not evident in Figure 2. 6. Detrending: It is quite clear from both the time series plot and the sample ACF that my original series is non- stationary. In a general time series, mean is a totally arbitrary function of time. Now we consider the possibility that perhaps the mean is a linear function of time. Hence, we consider the possibility that perhaps my model is trend stationary. I used the trend analysis function in Minitab to plot a linear trend to the dataset. The trend analysis reveals a distinct upward ‘drift’, depicted by the red line(Fig.3). Figure 3 Because the Time Series Plot and ACF graphs both imply non-stationary and there is a distinct upward linear trend, μ may well be defined by the linear equation below which describes the deterministic time trend: μ = β0 + β1t Here, β0 is the intercept and β1 is the slope. Notice that the slope term is a constant multiple of time t. We calculate estimates of β0 and β1 using the least squares estimator: Σt=1(Yt –( β0 + β1t))2 An ARIMA model with linear trend can be written as: ϕ(B)(I-B)d (Yt –( β0 + β1t))= θ(B)εt We must investigate if this is the case because if we difference our series to make it stationary, where de-trending would have sufficed, we needlessly lose information. This would have adverse effects on our forecasting intervals. To mathematically check the presence of a linear trend I conducted a simple test in Minitab to check the significance of the intercept and slope parameters above using linear regression to fit the linear model. In the linear model, time is the explanatory variable and the Incidents of Terrorist Attacks is the response variable. 1441281129680644832161 500 400 300 200 100 Index Incidents MAPE 16.73 MAD 45.73 MSD 3554.14 Accuracy Measures Actual Fits Variable Trend Analysis Plot for Incidents Linear Trend Model Yt = 180.68 + 1.37*t
  • 6. The deterministic linear trend itself is estimated by the function: Yt = 181 + 1.37*Number , and the following table produced by Minitab describes some statistical results of the model: Predictor Coefficient S.E Coefficient t T p Constant 180.676 9.623 18.78 0.000 Month Date 1.3656 0.1057 12.92 0.000 We can see from the output of Minitab that there exists a p-value of zero for the slope of the linear model. Thus, we reject the null hypothesis at a 0.05 significance level that the slope is insignificant, as I originally predicted. Therefore, there exists a significant linear trend which I will now remove by detrending to produce Figure 4. Figure 4 The next step is to decide if the series is in fact trend stationary. As mentioned earlier, we must investigate this, as if we were to difference our series to make it stationary, where de-trending would have been appropriate we would needlessly lose information and it would affect the accuracy of our model. We can see from the plot of the detrending process (Fig.4), that the series is still not obviously stationary. The time series does not possess obvious constant statistical characteristics; i.e. we cannot conclude that the mean and variance do not depend on time. Therefore we can conclude that the series does indeed contain a linear component, the original series is non-trend stationary and there is a unit root present. Thus differencing the detrended series is the next course of action. 7. Differencing: I will now define the de-trended series as Zt = Yt –TCt where TCt represents the trend component. I will attempt to make the series stationary by differencing. This can be defined by: Δ Zt = Zt - Zt-1 1441281129680644832161 1.75 1.50 1.25 1.00 0.75 0.50 Index DETR1 Time Series Plot of Detrended Data
  • 7. We should always be careful when differencing. Overdifferencing introduces unnecessary correlations into a series and will complicate the modelling process. Thus it can jeopardise the accuracy of the model. In addition, over differenced series’ produce less stable coefficient estimates due to invertibility. Non-invertible models also create serious problems when one attempts to estimate their parameters. The model should only be differenced the appropriate number of times. One should constantly bare The Principle of Parsimony in mind- “keep models simple but not too simple.” If we begin the differencing process by differencing the de-trended time series once, the following time series plot ensues. Figure 5 Now the above differenced series (Fig.5) with the linear trend removed appears stationary, with constant mean around zero and constant variance. This reconfirms the premise that the initial de- trending process did not achieve stationarity and by extension, the original time series was not trend stationary and needed to be differenced at least once. This solidifies the presence of the proposed linear trend (which we have since removed), along with a unit root. We can conclude that d=1 and will proceed to identify p and q in the model. Stationarity will be confirmed as soon as the ACF and PACF plots are examined. Recall the definition of difference stationarity from class: models which require differencing to achieve stationarity (and cannot be made stationary by just removing the linear trend) are called difference stationary. Thus, this model is difference stationary. 8. Identification of the Autoregressive and Moving Average parameters: The next step requires examination of the ACF and PACF plots of Δ Zt to determine the autoregressive and moving-average components of the model. Firstly, we will look at the autocorrelation function or ACF. Assuming stationarity, we would like to compute the autocorrelation function ρh for a variety of lags h= 1, 2, etc. Since we are now assuming the series is stationary, we are also implying common mean and variance. We can compute the sample correlation between the pair k units apart in time i.e. between (Y1, Y1+k) , (Y2, Y2+k) etc. Looking at the ACF plot below, I can conclude that the ACF decays to zero exponentially fast which reconfirms my belief of stationarity being achieved. If we compare this to Figure 2, it is easy to appreciate how the ACF’s nature depicts stationarity. 1441281129680644832161 1.00 0.75 0.50 0.25 0.00 -0.25 -0.50 Index C5 Time Series Plot of Differenced Time Series without Linear Trend
  • 8. Figure 6 Figure 7 The ACF plot for my differenced and detrended time series does indeed follow a weakly stationary distribution. There is one non-zero covariance at lag one, with the rest of the covariances (perhaps bar one) falling within the broken standard error dashed line displayed in red, implying their insignificance. Upon closer inspection, the pattern in the ACF could equally be seen as decreasing exponentially to 0, which implies that I am dealing with a model which contains an AR(p) term, where the p term appears to be 1. We need to look at the ACF in cohort with the PACF. The PACF plot above does show evidence of exponential decay to zero. The ACF and PACF of the differenced time series with a trend removed, imply an MA(1) model. This is a result of there being one significant lag in the ACF and exponential decay in the PACF. However, there is the possibility that the PACF above is manifesting itself in the form of an AR(2) or AR(3), with two or three non-zero lags and the remaining lags dropping immediately to zero. On visual inspection it does seem more likely to be exponential decay but all possibilities should be examined to ensure the best model is found. I will address this question in the next two sections. I will opt initially for ARIMA(0,1,1). Thus, I will initially consider my detrended and differenced data under the framework of an MA(1) process which is akin to an ARIMA(0,1,1) or IMA(1,1) model. We can describe the model mathematically by: Δ( Yt ) = εt – θ1εt-1 Where θ is a constant and εt is an identically and independently distributed white noise term. 9. Testing the Model: The next step is to test my proposed ARIMA(0,1,1) model to see if it fits and reflects the data. It is also imperative to investigate the presence of any other parameters that should be in the model which may not have been indicated initially by the ACF and PACF of the difference data. If it is discovered that there are extra terms required, then estimates for them must also be calculated. Firstly, lets test my proposed ARIMA(0,1,1). We obtain the following results from Minitab: Final Estimates of Parameters Type Coef SE Coef T P MA(1) 0.9812 0.0057 171.62 0.000 35302520151051 1.0 0.8 0.6 0.4 0.2 0.0 -0.2 -0.4 -0.6 -0.8 -1.0 Lag Autocorrelation Autocorrelation Function for Differenced and Detrended Data (with 5% significance limits for the autocorrelations) 35302520151051 1.0 0.8 0.6 0.4 0.2 0.0 -0.2 -0.4 -0.6 -0.8 -1.0 Lag PartialAutocorrelation Partial Autocorrelation Function for Differenced and Detrended Data (with 5% significance limits for the partial autocorrelations)
  • 9. Employing a Hypothesis Test of the form, Ho : θ = 0 vs. HA : θ ≠ 0 and using the usual significance level of 5%, the significance of the model’s parameters may be assessed. We conclude that our parameter θ1 = 0, since its p-value of 0.000 < 0.05 which indicates its necessity in the model. θ1 is thus significant and assumes a coefficient estimate of 0.9812. The model can now be described as: Yt - Yt-1 = εt - 0.9812εt-1 or Δ Yt = εt - 0.9812εt-1 It is possible to conclude that Δ Yt is stationary but Yt is not. 10.Overfitting the Model: Having tested the proposed ARIMA(0,1,1) model with the data, larger models in which my original model is nested, should now be tested. If the new models are to be preferred over the original model then the estimates of the additional parameters should also be significantly different from zero; i.e. they should yield p-values lower than the significance level of 0.05. In addition to this, our original parameters must also retain p-values that indicate their necessity in the model (over-fitting sometimes reveals correlation between parameters and the addition of an extra parameter may render an initial parameter that we thought was necessary, to be trivial). We saw earlier from The Principle of Parsimony that the simpler the model the better. Hence, if a simple model seems at all promising, it should be investigated before moving onto a more complicated model. It therefore makes sense to fit an ARIMA(0,1,1) model before examining models with additional AR and MA terms(see list below). One of the rules of overfitting is that one must not increase the orders of the MA and AR terms simultaneously. I will test the following proposed models:  ARIMA(0,1,2)  ARIMA(1,1,1)  ARIMA(1,1,2)  ARIMA(1,1,3)  ARIMA(1,1,4)  ARIMA(2,1,2)  ARIMA(2,1,3) Upon testing an ARIMA(0,1,2),the following output from Minitab is obtained: Final Estimates of Parameters Type Coef SE Coef T P MA 1 1.0177 0.0023 441.21 0.000 MA 2 -0.0320 0.0799 -0.40 0.690 It is clear that the additional MA term is insignificant with such a large p-value (0.690) above the 5% significance level. If an additional moving average term had been beneficial to the model, then both p-values of the MA terms would be less than the stipulated significance level of 0.05 Alongside this, the estimate of the additional parameter θ2 is very close to 0. We can therefore discard this proposed ARIMA(0,1,2) model. As mentioned in Section 8, there is evidence that the ACF of the detrended and differenced time series could be displaying exponential decay to zero with the PACF manifesting itself with 2 or 3
  • 10. significant lags. For these reasons I will first overfit for an ARIMA(1,1,1) model. Upon testing for this model, the following output from Minitab is obtained: Final Estimates of Parameters Type Coef SE Coef T P AR 1 -0.4458 0.0724 -6.15 0.000 MA 1 0.9868 0.0012 819.15 0.000 It is clear that the additional AR term is very significant with a p value of zero. The premise that the ACF and PACF from section 8 suggested an autoregressive term seems to have been satisfied. In conjunction with this, the MA term p value has not changed at all and its coefficient has changed negligibly from 0.9812 to 0.9868. I will continue to overfit MA terms. I will now test an ARIMA(1,1,2) for which I obtain the following results from Minitab: Final Estimates of Parameters Type Coef SE Coef T P AR 1 -0.5505 0.0741 -7.43 0.000 MA 1 0.8077 0.0102 79.52 0.000 MA 2 0.1844 0.0602 3.07 0.003 The additional second MA term is significant. I will now test an ARIMA(1,1,3) for which I obtain the following results from Minitab: Final Estimates of Parameters Type Coef SE Coef T P AR 1 -0.7598 0.0635 -11.96 0.000 MA 1 0.8052 0.0076 105.95 0.000 MA 2 0.5950 0.0592 10.05 0.000 MA 3 -0.4135 0.0749 -5.52 0.000 The third MA term is significant. I will now test and ARIMA(1,1,4) for which I obtain the following results from Minitab: Final Estimates of Parameters Type Coef SE Coef T P AR 1 -0.7632 0.0835 -9.14 0.000 MA 1 0.7733 0.0194 39.83 0.000 MA 2 0.6140 0.0876 7.01 0.000 MA 3 -0.3736 0.1218 -3.07 0.003 MA 4 -0.0294 0.0857 -0.34 0.732 The fourth MA term yields a p-value of 0.732 so I will stop overfitting the MA terms and conclude that q=3. I will now test for an ARIMA(2,1,2) and ARIMA(2,1,3) for which I obtain the following results from Minitab: Final Estimates of Parameters ARIMA(2,1,2) Final Estimates of Parameters ARIMA(2,1,3) Type Coef SE Coef T P Type Coef SE Coef T P AR 1 -0.9731 0.3471 -2.80 0.006 AR 1 -0.8293 0.0821 -10.11 0.000 AR 2 -0.3519 0.1422 -2.47 0.014 AR 2 -0.0462 0.0947 -0.49 0.626 MA 1 0.5125 0.3431 1.49 0.137 MA 1 0.7916 0.0113 70.10 0.000 MA 2 0.4732 0.3764 1.26 0.211 MA 2 0.6481 0.0558 11.62 0.000 MA 3 -0.4519 0.0730 -6.19 0.000
  • 11. These final parameter test suggest that I should favour an ARIMA (1,1,3) model after the overfitting process of my originally proposed ARIMA(0,1,1) model. To investigate this hypothesis further I can compare the mean-squared error of the residuals from an ARIMA(0,1,1), ARIMA(1,1,1), ARIMA(1,1,2) and an ARIMA(1,1,3).(Note: backforecasts are excluded in these calculations.) For the ARIMA(0,1,1) we obtain: Residuals: SS = 8.77356 MS = 0.05697 DF = 154 For the ARIMA(1,1,1) we obtain: Residuals: SS = 7.03196 MS = 0.04596 DF = 153 For the ARIMA(1,1,2) we obtain: Residuals: SS = 7.26631 MS = 0.04780 DF = 152 For the ARIMA(1,1,3) we obtain: Residuals: SS = 6.27891 MS = 0.04158 DF = 151 The lowest mean-squared error of the residuals of the above test is that of the ARIMA(1,1,3) model which thus offers justification for its use. I will give preference to an ARIMA(1,1,3) model. The results of the following test will reaffirm this preference. 10.1 Ljung- Box Pierce Chi Squared Test Statistic: The Ljung-Box-Pierce test statistic, Q, tells us if the model we have chosen is a good fit by taking a weighted sum of the residual auto-correlations. It can happen that even when most of the residual autocorrelations are moderate when taken together, they may seem excessive. In addition to looking at residual correlations at individual lags, it takes into account their magnitudes as a group. The Ljung-Box Pierce test statistic of order K is defined as: If the ARMA (p,q) model is correct, then Q-> χ²k-p-q , Otherwise Q -> ∞. It tests the null hypothesis Ho: the error terms are uncorrelated. This can be equivalently looked upon as: Ho: Model is Adequate (Residuals are not Correlated) Vs. HA: Model is Inadequate For a model which is not suited to the data, the sum will be large. Better models should have smaller Q values and larger p-values at the lags. I computed the following test statistics in Minitab: ARIMA(0,1,1): Modified Box-Pierce (Ljung-Box) Chi-Square statistic Lag 12 24 36 48 Chi-Square 45.4 52.6 58.9 71.9 DF 11 23 35 47 P-Value 0.000 0.000 0.007 0.01 ARIMA(1,1,1): Modified Box-Pierce (Ljung-Box) Chi-Square statistic Lag 12 24 36 48 Chi-Square 26.9 38.4 42.0 55.1 DF 10 22 34 46
  • 12. P-Value 0.003 0.016 0.164 0.167 ARIMA(1,1,2): Modified Box-Pierce (Ljung-Box) Chi-Square statistic Lag 12 24 36 48 Chi-Square 30.7 41.2 44.8 58.4 DF 9 21 33 45 P-Value 0.000 0.005 0.082 0.087 ARIMA(1,1,3): Modified Box-Pierce (Ljung-Box) Chi-Square statistic Lag 12 24 36 48 Chi-Square 15.8 28.7 32.5 44.1 DF 8 20 32 44 P-Value 0.045 0.094 0.443 0.469 It is clear that the ARIMA(1,1,3) model offers much higher P-Values at each lag , insinuating its suitability ,and substantially lower Q values when juxtaposed to the other models. This reconfirms my preference for continuing with the ARIMA(1,1,3) model. 11.ModelDiagnostics: A number of diagnostic tests can be carried out to investigate the goodness of fit of a model. If the model is a good for the sample data, we would expect the residuals to be distributed as white noise terms. White noise is defined as a sequence of independent and identically distributed random variables. It is strictly stationary and is assumed to follow a normal distribution with mean zero and constant variance. I will now investigate whether the residuals of my suggested ARIMA(1,1,3) possess these residual conditions. Note: These residual tests are to be carried out on the detrended series Δ Zt . 11.1 Time Series plot of the Residuals: 1441281129680644832161 1.00 0.75 0.50 0.25 0.00 -0.25 -0.50 Index RESI1 Time Series Plot of Residuals of Detrended ARIMA(1,1,3) Figure 8 The time series plot above (Figure 8), of the residuals clearly demonstrates that they are normally distributed around mean zero. The spread of the residuals around the mean of zero implies constant
  • 13. variance. Furthermore, there does not appear to be any trends as I would expect. Figure 9 is a 4-in-1 chart, displaying various residual tests which shall be discussed next. 1.00.50.0-0.5 99.9 99 90 50 10 1 0.1 Residual Percent 0.20.0-0.2-0.4-0.6 1.0 0.5 0.0 -0.5 Fitted Value Residual 0.80.60.40.20.0-0.2-0.4 40 30 20 10 0 Residual Frequency 150 140 130 120 110 1009080706050403020101 1.0 0.5 0.0 -0.5 Observation Order Residual QQ Plot/Normal Probability Plot of Residuals Residuals vs. Fitted Values Histogram of Residuals Residuals vs. Order Residual Plots for Detrended ARIMA(1,1,3) Figure 9 11.2 QQ Plot of Residuals: Quantile-Quantile plots are an effective tool for assessing normality. Such plots display the quantiles of the data versus the theoretical quantiles of a normal distribution. White noise terms are said to be normally distributed with zero mean and constant variance i.e. white noise ~ N (0, σ²). If the points are normal they should appear evenly distributed on the straight line. That largely seems to be the case here for my suggested ARIMA(1, 1, 3) model. 11.3 Residuals vs. Fitted Values: Above in the top right of Figure 9, we can see a plot of the residuals vs. the fitted values. Upon inspection we can see that the residuals appear to be randomly scattered around the horizontal line, which is what we would expect if the model is suitable. This means that there is no correlation between the fitted values and the residuals. Furthermore, there is no evidence of heteroscedasticity. 11.4 Histogram of Residuals: The histogram of the residuals is an evenly distributed bell-shaped curve. Furthermore the histogram decays symmetrically at each tail, coupled with mean centred around zero. 11.5 Residuals vs. Order: Residuals accumulate around zero which indicates a constant mean. In conjunction with this, a common variance is present. 11.6 ACF of Residuals: As the white noise terms are independent there should be no correlation between εt and εt-k. This is confirmed by the ACF of the residuals. From Figure 10, there do not appear to be any significant
  • 14. lags, adding further strength to the suitability of my chosen model. Had the ACF not been insignificant at each lag, it could have meant that I had chosen q too small.(This was the reason for my comprehensive overfitting process. However, this is not the case here. 35302520151051 1.0 0.8 0.6 0.4 0.2 0.0 -0.2 -0.4 -0.6 -0.8 -1.0 Lag Autocorrelation ACF of Residuals for Detrended ARIMA(1,1,3) (with 5% significance limits for the autocorrelations) Figure 10 11.7 PACF of the Residuals: Similar to the ACF, should the model be suitable, one does not expect to see any significant lags here. This is exactly the case for my model. Had there been any significant lags, it could mean that I had chosen p too small. However, this is not the case here. Figure 11 We can see from the model diagnostics that the residuals do indeed appear to be distributed as white noise. I believe the study of the residual behaviour outlined above confirms the appropriateness of the ARIMA(1,1,3) model that I chose to use from Section 10. 12.Forecasting: 35302520151051 1.0 0.8 0.6 0.4 0.2 0.0 -0.2 -0.4 -0.6 -0.8 -1.0 Lag PartialAutocorrelation PACF of Residuals for Detrended ARIMA(1,1,3) (with 5% significance limits for the partial autocorrelations)
  • 15. One of the primary objectives of building a model for a time series is to be able to forecast the values for that series at future times. Of equal importance is the precision of these forecasts. As mentioned in the introduction, forecasting terrorist attacks is a difficult task and the model used to carry out this process should be a very sophisticated model that can accommodate and consider all possible variables introduced into it. Forecasting terrorist attacks in the future is of huge importance to National Security Agencies, Governments, Insurance Companies and a litany of other bodies. I will now attempt to forecast two steps ahead using my model, and I will compare these forecasts to the actual number of incidents recorded for February and March of 1993. 12.1 Forecast Comparison and Confidence Interval: When forecasting future values Yn+1, Yn+2, …,Yn+l I will use the minimum mean square error forecast Ỹn(l) where: Ỹn(l)=E(Yn+l / Yn,…..,Y1) I will now attempt to forecast two steps ahead for the original terrorist data, still including the linear trend. The following predictions are for observations 158 and 159 (February 1993 and March 1993 respectively). Observation Forecast Lower 95% Limit Upper 95% Limit True Values 158 444.861 333.133 556.589 413 159 443.990 325.712 562.267 493 The true values for observation 158 and 159 fall comfortably within the 95% Confidence Interval given above. We can conclude that my model provides accurate forecasts for the incidents of terrorist attacks. Aside: It is important to note that the observations 157, 158, and 159 are derived from the interpolated data for 1993. 12.2 Error Tests: In order to assess the accuracy of the forecast, a number of additional tests were conducted, including:  The Absolute Error: This determines the amount of physical error in my forecast. |Yn+l - Ỹn(l)|  The Quadratic Error: This provides the squared deviation from the actual value. (Yn+l - Ỹn(l))2  The Relative Error: This delivers and indication as to how good the forecast is relative to the size of the actual value. |Yn+l - Ỹn(l)|/ Yn+l The following results were computed manually for the terrorist attack data: Observation Forecast True Value Absolute Error Quadratic Error Relative Error 158 444.861 413 31.861 1015.13321 0.077145278 159 443.990 493 49.01 2401.9801 0.09941176
  • 16. It is apparent that the Relative Error of the forecasts are accurate as they are both under 10%. The following time series plot with forecasts and their confidence intervals display coherence to the rest of the data. Figure 12 13.Conclusion: The main objective of this report was to investigate the possibility of fitting a suitable ARIMA model to the raw terrorist data. In the end, after much careful consideration, I employed the use of an ARIMA(1,1,3) model .The presence of a significant linear trend was also identified and subsequently removed. The final model can be written mathematically as: 1- ϕ1B(I-B)1Yt = (1 – θ1B - θ2B2 )εt In conclusion, I feel that this report has given a valuable insight into analysing and forecasting the incident count of recorded terrorist attacks worldwide. While my model proved successful in describing the data, and also correctly forecasted January and February data for 1993, it is uncertain whether this accuracy would hold up in more long-term forecasts or would cater for the increase in terrorist attacks since the turn of the millennium. Thus the model would need to be inspected again in the future and updated so as to accommodate new observations and to ensure accuracy. 14.Appendices: Appendix 1-References: 1: The Actuary (Edition October 2011) 2: http://www.start.umd.edu/gtd/ Appendix 2-Data: Number Month Date Incidents Number Month Date Incidents 1 Jan-80 220 81 Sep-86 217 1501401301201101009080706050403020101 600 500 400 300 200 100 Time Incidents Time Series Plot for Incidents of Recorded Terrorist Attacks (with forecasts and their 95% confidence limits)
  • 17. 2 Feb-80 181 82 Oct-86 199 3 Mar-80 254 83 Nov-86 167 4 Apr-80 298 84 Dec-86 211 5 May-80 198 85 Jan-87 242 6 Jun-80 273 86 Feb-87 269 7 Jul-80 224 87 Mar-87 227 8 Aug-80 184 88 Apr-87 306 9 Sep-80 216 89 May-87 246 10 Oct-80 240 90 Jun-87 295 11 Nov-80 207 91 Jul-87 297 12 Dec-80 168 92 Aug-87 289 13 Jan-81 209 93 Sep-87 289 14 Feb-81 214 94 Oct-87 250 15 Mar-81 206 95 Nov-87 314 16 Apr-81 208 96 Dec-87 162 17 May-81 223 97 Jan-88 288 18 Jun-81 175 98 Feb-88 324 19 Jul-81 196 99 Mar-88 359 20 Aug-81 265 100 Apr-88 276 21 Sep-81 187 101 May-88 326 22 Oct-81 234 102 Jun-88 335 23 Nov-81 200 103 Jul-88 340 24 Dec-81 268 104 Aug-88 260 25 Jan-82 233 105 Sep-88 238 26 Feb-82 180 106 Oct-88 326 27 Mar-82 277 107 Nov-88 319 28 Apr-82 252 108 Dec-88 330 29 May-82 236 109 Jan-89 324 30 Jun-82 164 110 Feb-89 378 31 Jul-82 216 111 Mar-89 320 32 Aug-82 224 112 Apr-89 342 33 Sep-82 173 113 May-89 359 34 Oct-82 251 114 Jun-89 272 35 Nov-82 137 115 Jul-89 323 36 Dec-82 203 116 Aug-89 366 37 Jan-83 292 117 Sep-89 499 38 Feb-83 198 118 Oct-89 472 39 Mar-83 233 119 Nov-89 377 40 Apr-83 221 120 Dec-89 290 41 May-83 296 121 Jan-90 285 42 Jun-83 251 122 Feb-90 240 43 Jul-83 218 123 Mar-90 397 44 Aug-83 225 124 Apr-90 338 45 Sep-83 236 125 May-90 413 46 Oct-83 259 126 Jun-90 394 47 Nov-83 233 127 Jul-90 371 48 Dec-83 209 128 Aug-90 340 49 Jan-84 278 129 Sep-90 294
  • 18. 50 Feb-84 286 130 Oct-90 323 51 Mar-84 373 131 Nov-90 275 52 Apr-84 370 132 Dec-90 217 53 May-84 299 133 Jan-91 399 54 Jun-84 249 134 Feb-91 336 55 Jul-84 345 135 Mar-91 275 56 Aug-84 331 136 Apr-91 327 57 Sep-84 294 137 May-91 349 58 Oct-84 233 138 Jun-91 350 59 Nov-84 239 139 Jul-91 514 60 Dec-84 197 140 Aug-91 427 61 Jan-85 234 141 Sep-91 406 62 Feb-85 184 142 Oct-91 528 63 Mar-85 224 143 Nov-91 434 64 Apr-85 156 144 Dec-91 339 65 May-85 422 145 Jan-92 367 66 Jun-85 298 146 Feb-92 335 67 Jul-85 263 147 Mar-92 515 68 Aug-85 266 148 Apr-92 367 69 Sep-85 205 149 May-92 459 70 Oct-85 217 150 Jun-92 307 71 Nov-85 231 151 Jul-92 389 72 Dec-85 217 152 Aug-92 390 73 Jan-86 224 153 Sep-92 457 74 Feb-86 201 154 Oct-92 507 75 Mar-86 300 155 Nov-92 532 76 Apr-86 249 156 Dec-92 453 77 May-86 248 157 Jan-93 487 78 Jun-86 344 158 Feb-93 413 79 Jul-86 267 159 Mar-93 493 80 Aug-86 236