
Recommended
More Related Content
What's hot
What's hot (20)
Similar to How economic growth alone is not enough to reduce poverty in South Asia
Similar to How economic growth alone is not enough to reduce poverty in South Asia (20)
More from Saurabh Mishra
How economic growth alone is not enough to reduce poverty in South Asia
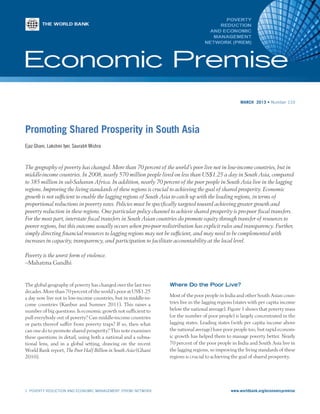
- 1. 1 POVERTY REDUCTION AND ECONOMIC MANAGEMENT (PREM) NETWORK www.worldbank.org/economicpremise MARCH 2013 • Number 110 Promoting Shared Prosperity in South Asia Ejaz Ghani, Lakshmi Iyer, Saurabh Mishra The global geography of poverty has changed over the last two decades.Morethan70percentoftheworld’spooratUS$1.25 a day now live not in low-income countries, but in middle-in- come countries (Kanbur and Sumner 2011). This raises a number of big questions. Is economic growth not sufficient to pull everybody out of poverty? Can middle-income countries or parts thereof suffer from poverty traps? If so, then what can one do to promote shared prosperity? This note examines these questions in detail, using both a national and a subna- tional lens, and in a global setting, drawing on the recent World Bank report, The Poor Half Billion in South Asia (Ghani 2010). The geography of poverty has changed. More than 70 percent of the world’s poor live not in low-income countries, but in middle-income countries. In 2008, nearly 570 million people lived on less than US$1.25 a day in South Asia, compared to 385 million in sub-Saharan Africa. In addition, nearly 70 percent of the poor people in South Asia live in the lagging regions. Improving the living standards of these regions is crucial to achieving the goal of shared prosperity. Economic growth is not sufficient to enable the lagging regions of South Asia to catch up with the leading regions, in terms of proportional reductions in poverty rates. Policies must be specifically targeted toward achieving greater growth and poverty reduction in these regions. One particular policy channel to achieve shared prosperity is pro-poor fiscal transfers. For the most part, interstate fiscal transfers in South Asian countries do promote equity through transfer of resources to poorer regions, but this outcome usually occurs when pro-poor redistribution has explicit rules and transparency. Further, simply directing financial resources to lagging regions may not be sufficient, and may need to be complemented with increases in capacity, transparency, and participation to facilitate accountability at the local level. Poverty is the worst form of violence. —Mahatma Gandhi Where Do the Poor Live? Most of the poor people in India and other South Asian coun- tries live in the lagging regions (states with per capita income below the national average). Figure 1 shows that poverty mass (or the number of poor people) is largely concentrated in the lagging states. Leading states (with per capita income above the national average) have poor people too, but rapid econom- ic growth has helped them to manage poverty better. Nearly 70 percent of the poor people in India and South Asia live in the lagging regions, so improving the living standards of these regions is crucial to achieving the goal of shared prosperity.
- 2. 2 POVERTY REDUCTION AND ECONOMIC MANAGEMENT (PREM) NETWORK www.worldbank.org/economicpremise gions. This can be achieved by improving the business envi- ronmentfortheprivatesector,supportingmarketintegration, improving connectivity, and ensuring macroeconomic stabil- ity. The government can also intervene directly in sectors or locations in which the private sector is reluctant to invest. Another strategy is to promote pro-poor fiscal transfers and devolve power to local governments who may then imple- ment policies more suited to local conditions. The second One way to achieve shared prosperity is through econom- ic growth. The first part of this note shows that current pat- terns of economic growth do not appear to be enough. Lag- ging regions have slower growth than leading ones. While there is poverty reduction in both leading and lagging regions, lagging regions do not display greater poverty reduction in proportional terms. Policies should therefore aim to acceler- ate the growth rate and poverty reduction of the lagging re- Source: Reprinted from The Poor Half Billion in South Asia—What Is Holding Back Lagging Regions? Note: Lagging and leading states: in most developing and industrial countries, lagging regions are defined as those areas where growth and income seriously lag behind average national peformance. In this map, a state is defined as lagging if its per capita income is below the national average. Leading Areas Lagging Areas Low Poverty Mass High Poverty Mass* No Data INDIAINDIA BHUTANBHUTAN BANGLADESHBANGLADESH AFGHANISTANAFGHANISTAN MYANMARMYANMAR SRI LANKASRI LANKA MALDIVESMALDIVES PAKISTANPAKISTAN NEPALNEPAL NorthernNorthern North CentralNorth Central EasternEastern CentralCentral UvaUva SouthernSouthern WesternWestern North WesternNorth Western SabaragamuwaSabaragamuwa MizoramMizoram TripuraTripura ManipurManipur NagalandNagaland Arunachal Pradesh Arunachal Pradesh AssamAssam MeghalayaMeghalaya SikkimSikkim Tamil Nadu Tamil NaduKeralaKerala KarnatakaKarnataka GoaGoa Andhra Pradesh Andhra Pradesh MaharashtraMaharashtra Andaman and Nicobar Andaman and Nicobar OrissaOrissa ChhattisgarhChhattisgarh Madhya PradeshMadhya PradeshGujaratGujarat RajasthanRajasthan Uttar PradeshUttar Pradesh BiharBihar JharkhandJharkhand West Bengal West Bengal DelhiDelhi UttarakhandUttarakhand HaryanaHaryana PunjabPunjab EasternEastern CentralCentral WesternWesternMid Western Mid Western Far Western Far Western SindhSindh BalochistanBalochistan PunjabPunjab Khyber Pakhtunkhwa Khyber Pakhtunkhwa KhulnaKhulna BarisalBarisal DhakaDhaka SylhetSylhetRajshahiRajshahi ¯ * High poverty mass is defined as subnational areas of a country having a large poor population. In Bangladesh, high poverty mass is > 15 million persons; in India and Pakistan, > 20 million persons; in Nepal, > 1.5 million persons; and in Sri Lanka, > 0.6 million persons. Poverty Mass is Concentrated in Lagging Regions Note: Lagging and leading states: In most developing and industrial countries, lagging regions are defined as those areas where growth and income seriously lag behind average national peformance. In this map, a state is defined as lagging if its per capita income is below the national average. Figure 1. Poverty Mass Concentration in India
- 3. 3 POVERTY REDUCTION AND ECONOMIC MANAGEMENT (PREM) NETWORK www.worldbank.org/economicpremise part of this note examines whether the current fiscal decen- tralization programs are working to the benefit of the poor regions in South Asia. Poverty Convergence across Countries and Regions Poverty itself can become a constraint to growth through channels such as lower savings or investment rates; dismal education or health outcomes; poor access to credit or prop- erty rights; incomplete insurance markets, which increase the risks of crop failures, floods, and droughts; and high conflict rates. Such “poverty traps” limit the choices of economic agents, whether individuals, households or firms, to fully ex- press their economic potential. These traps can start a vicious cycle, with no income growth feeding into greater poverty, which in turn reduces growth even further. So, does evidence show that countries suffer from pover- ty traps? Not really. Figure 2 shows that countries with ini- tially higher levels of poverty experienced greater absolute re- ductions in the poverty headcount ratio—the proportion of the population living below the international poverty line of US$1.25 a day. These trends are further verified in regressions report- ed in table 1 and found to be statistically significant (table 1, column 1). If the absolute change in the headcount ratio is regressed on the initial poverty level, it shows a negative and statistically significant coefficient, even after control- ling for growth rates of per capita gross domestic product (GDP). Indicator Annualized changes in headcount ratio Annualized change in poverty gap Annualized change in poverty gap squared Absolute Proportional Absolute Proportional Absolute Proportional 1 Initial poverty > 10% 2 3 4 5 6 7 Initial poverty (level) -0.02*** (0.005) -0.02*** (0.010) Initial poverty (log) -0.006 (0.01) Initial poverty gap (level) -0.046*** (0.006) Initial poverty gap (log) -0.024*** (0.013) Initial poverty gap squared (level) -0.05*** (0.006 Initial poverty gap squared (log) -0.045*** (0.015) Growth rate of GDP per capita -0.25** (0.12) -0.31** (0.15) -0.01*** (0.004) -0.104* (0.061) -0.01*** (0.007) -0.05 (0.037) -0.022** (0.009) Observations 82 56 82 82 82 79 79 R-squared 0.97 0.32 0.13 0.48 0.21 0.60 0.37 Source: World Bank 2009b, 2009c. Notes: Robust standard errors are reported in parentheses. *** represents significance at 1 percent, ** represents significance at 5 percent, * represents significance at 10 percent. Poverty rate is defined as percentage of population living in households with consumption or income per person below the international US$1.25 poverty line. Annualized poverty change is for 1977–2007. Poverty gap is defined as the mean distance below the poverty line as a proportion of the poverty line. Squared poverty gap is defined as mean of the squared distances below the poverty line as a proportion of the poverty line. Table 1. Poverty Convergence across Countries Figure 2. Convergence in Poverty Headcount Ratios (absolute level) Source: World Bank 2009b. Notes: Poverty rate is for US$1.25. Time period for change in poverty is for 1977–2007. Number of observations is 91. annualizedchangeinpovertyrate initial poverty rate Djibouti Uzbekistan Tanzania Colombia Armenia Rwanda Nigera Guinea-Bissau Pakistan South Africa Mongolia Côte d’Ivoire Bolivia Sri Lanka Brazil Argentina Latvia Malaysia Morocco Tunisia Mexico Paraguay Guyana Guatemala Cambodia Lao PDRGhana Indonesia Vietnam Honduras Kenya Philippines Nicaragua Thailand Costa Rica China Mozambique Niger Sierra Leone Uganda Swaziland Central African Rep. GuineaNepal Bangladesh Burundi Madagascar Lesotho Zambia India Cameroon 0 20 100806040 -4 4 2 0 -2
- 4. 4 POVERTY REDUCTION AND ECONOMIC MANAGEMENT (PREM) NETWORK www.worldbank.org/economicpremise Using the reduction in headcount ratio is obviously an important way to measure economic progress. But there are two issues with using this measure. First, countries with low levels of poverty cannot display high values of poverty reduc- tion. The existence of a “floor value” of zero therefore may not capture all the progress in a country starting from low levels of poverty. One can partially control for the existence of such a floor value by restricting the sample to countries that had a head- count poverty ratio greater than 10 percent in the initial pe- riod. The results regarding convergence are robust to this re- striction (table 1, column 2). These results provide a basis for cautious optimism regarding progress in poor countries; poor countries may not be trapped in poverty forever. The second caveat to using absolute poverty change is the fact that reducing poverty from a high level might be easier than reducing poverty from an already low level. The latter might reflect more entrenched factors leading to poverty, in- cluding low levels of education or health problems or even persistent beliefs about the value of effort (for example, 12– 13 percent of the U.S. population has been under the national poverty line for more than a decade). Using a percentage change in poverty (or equivalently, a change in log poverty) gives a greater magnitude to poverty reductions starting from a low base. It also avoids the floor value problem. When one considers percentage changes in poverty, there is no longer any significant degree of convergence in poverty across countries (table 1, column 3). In other words, although poorer countries do reduce absolute numbers of people living in poverty, they do not reduce them proportionally faster than richer countries. This fact has also been documented in Ravallion (2012), who ascribes the lack of convergence to two reasons. The first is that initially poor countries do not grow as fast as not-so-poor countries, and the second is that, for a giv- en rate of growth, poverty reduction in proportional terms appears to be slower in poorer countries. In addition to the headcount ratio, other measures of poverty that take into account how far households are from the poverty line can also be examined. This is particularly im- portant in measuring extreme poverty, which may not be re- flected fully in a simple comparison of headcount ratios. The two measures to consider are the Poverty Gap (PG) Index and the Squared Poverty Gap (SPG) Index—where the poverty gap is the average distance of an individual from the poverty line (with those above having a gap of zero). Regressions using the PG or SPG measures show strong evidence of convergence across countries, with poorer coun- tries showing the largest reductions in these indices—both for absolute reductions as well as proportional ones. This result is encouraging. Even if poorer countries are not able to achieve huge reductions in the headcount ratio, they do appear to show the largest reductions in the depth and severity of pov- erty (table 1, columns 4–7). Although the poorest show the largest increases in consumption, they are so far from the pov- erty line that this progress does not show up in equivalent changes to the headcount ratio. Poverty Convergence in South Asia At the subnational level, examining poverty convergence/di- vergence shows that trends within India and across South Asian regions are similar to the earlier results for the global sample. At the subnational level, states with higher levels of poverty experienced greater absolute reductions in the head- count ratio (table 2, columns 1 and 2). As in the global sample, however, they did not experience greater proportional reduc- tions in the headcount ratio (table 2, columns 3 and 4), sug- gesting that more needs to be done in the lagging regions to align them with the leading ones. When looking at measures of poverty depth and severity, once again the initially worse-off regions showed greater improvements in these measures than the initially better-off regions (table 2, columns 5 and 7). Unlike the global sample, however, the lagging regions in India do not show proportionally better performance in re- ducing the PG or the SPG measures (table 2, columns 6 and 8). This is a worrisome sign that poverty reduction in the lag- ging regions of India and South Asia needs to be accelerated, especially with regard to extreme poverty. Overall, these results provide for cautious optimism on shared prosperity and progress in the lagging regions. There is little evidence of persistent poverty traps at a regional level in South Asia, or even among developing countries as a whole. However, there is also no room for complacency. Lagging re- gions are not catching up with the leading regions in terms of per capita income or in health indicators, or even in propor- tionate terms for poverty reduction. As discussed earlier, one solution is to implement poli- cies to accelerate growth in the lagging regions. Another is to redistribute resources across regions in an effort to improve living standards. The next section reviews fiscal decentraliza- tion arrangements in South Asia and examines whether these result in greater transfers to the lagging regions. Fiscal Decentralization Arrangements in South Asia A typical cross-country measure of fiscal decentralization is the share of total revenues or expenditures that are collected by subnational governments. India is quite decentralized compared with the world average: subnational (state and lo- cal) governments collect 34 percent of all government reve- nues and are in charge of 52 percent of total government ex- penditures (table 3). Like many large federal nations, states in India receive transfers from the central government through a variety of mechanisms. The first consists of tax shares and grants decided
- 5. 5 POVERTY REDUCTION AND ECONOMIC MANAGEMENT (PREM) NETWORK www.worldbank.org/economicpremise by a nonpolitical Finance Commission, which places weights on factors such as the state’s area (10 percent), population (25 percent), per capita income (50 percent), and other factors in- cluding the state’s own revenues as a fraction of state domestic product (7.5 percent).1 The second source of funding is from the Planning Commission, which is in charge of formulating national five-year plans and makes grants and loans for imple- menting state development plans. The Planning Commission takes into account the state population and the gap between state per capita income and the national average, among other factors, when deciding state-level allocations. Third, various central government ministries give grants to their counterparts in the states for specified projects either wholly funded by the center (central sector projects) or requiring the states to share a proportion of the cost (centrally sponsored schemes). These grants are wholly discretion- ary and often are not coordinated with Plan- ning Commission transfers, although they are meant to serve similar objectives. In addition to these explicit transfers from the central government to the states, a number of “hidden” or “implicit” transfers arise from the large subsidies provided by the central government for food and fertilizer. In 2007–8, the central government had bud- geted about 1.34 percent of overall GDP to be paid out in subsidies, the bulk of which paid for subsidized food sales through the Food Corporation of India, and for fertilizers. Ad- ditionally, subsidized borrowing resources for the states are provided by either the central government or government-owned financial Indicator Annualized change in headcount ratio (absolute) Annualized change in headcount ratio (proportional) Annualized change in poverty gap Annualized change in poverty gap squared South Asia India South Asia India India, absolute India, proportional India, absolute India, proportional 1 2 3 4 5 6 7 8 Initial poverty (level) -0.03*** (0.01) -0.02*** (0.01) Initial poverty (log) -0.01 (0.01) -0.002 (0.01) Initial poverty gap (level) -0.03*** (0.01) Initial poverty gap (log) 0.001 (0.01) Initial poverty gap squared (level) -0.04*** (0.01) Initial poverty gap squared (log) -0.003 (0.01) Growth rate of GDP per capita -0.04 (0.07) -0.06 (0.07) -0.26 (0.30) 0.31 (0.31) 0.45 (1.19) -0.10 (0.33) 0.03 (0.72) 0.02 (0.39) Observations 29 18 29 18 18 18 18 18 R-squared 0.21 0.14 0.05 0.02 0.31 0.003 0.46 0.002 Source: World Bank staff calculations using the National Sample Survey Organization’s (NSSO) 55th and 61st round, http://mospi.nic.in/Mospi_New/site/Home.aspx. Note: Robust standard errors are reported in parentheses. *** represents significance at 1 percent, ** represents significance at 5 percent, * represents significance at 10 percent. South Asia includes states in India (1994–2005), Pakistan (1999–2005), and Sri Lanka (1996–2002). Odisha is deleted from the sample for the India region. South Asia: Odisha, Tripura, and Northern have been removed. Table 2. Poverty Convergence in India and South Asia Country % of government revenue raised by subnational governments % of government expenditure by subnational governments Transfers to subna- tional governmental units as a share of subnational revenues India 33.6 52 39 Bangladesh < 2 3–4 64–70 Pakistan 7.3 30.3 81.1 Sri Lanka 7 12 82.5 World 21.7 29.1 32.5 China 59.7 81.5 35 Canada 52.2 59.7 21.3 United States 41.1 49.3 28.9 Mexico 23.5 23.1 47 Sources: India, Canada, Mexico, and world figures are from Government Finance Statistics (GFS 1999); U.S. and Mexico figures are from GFS 2006; world average is based on the 41 countries in the GFS database. Table 3. Extent of Fiscal Decentralization in South Asia and the World
- 6. 6 POVERTY REDUCTION AND ECONOMIC MANAGEMENT (PREM) NETWORK www.worldbank.org/economicpremise institutions. The largest component of fiscal transfers in India comes from the tax-sharing schemes, but the discretionary transfers and the subsidies put together are almost as large as the tax shares. Achieving Equity through Fiscal Transfers In most countries, fiscal transfers ensure equity across sub- national regions. This equity is important for economic and political reasons. Poorer regions have a lower base of eco- nomic activity to tax, and typically these regions spend con- siderably less on social services, including education and health care. Figure 3 shows social spending per capita across states of India. Achieving horizontal equity through fiscal transfers can ensure a level playing field. This equity can be particularly im- portant if the government services are important inputs into future growth potential, such as in developing a healthy and educated workforce. Growing regional disparities can cause political tensions, and fiscal transfers can offset some of these disparities. Does the system of fiscal decentralization in India trans- fer more revenue to poorer regions? When looking at the dif- ferent components of fiscal transfers in India, it is clear that horizontal equity is being achieved only through the tax-shar- ing schemes of the Finance Commission (figure 4a). The state plan grants administered by the Planning Commission do not seem to be directed toward the poorer states (figure 4b), whereas the discretionary schemes show higher per capita ex- penditures in the richer states (figure 4c). Food subsidies per capita are roughly uniform across poor and rich states, that is, if it is assumed that all subsidies are used for the sale of food by the Food Corporation of India (figure 4d). Conversely, if one allocates food subsidies on the assumption that all the subsidies are spent in food procure- ment at above-market prices, then the highest levels of subsi- dies are given to the leading states of Punjab, Haryana, and Maharashtra (figure 4e). The true picture is probably a mix of production and consumption subsidies, but the conclu- sion is that these food subsidies are not significantly higher in poorer regions. The second-largest source of subsidies, fer- tilizer, benefits richer regions much more than poorer re- gions, because the richer regions tend to consume more fer- tilizer (figure 4f). If the subsidies are meant to improve welfare programs and investment levels in lagging regions, they need to be targeted to those regions, rather than to a specific good or service that may be consumed more heavily in richer states. In Pakistan and Sri Lanka, poorer regions are obtaining a higher level of per capita fiscal transfers. In Sri Lanka, the highest levels of per capita funding have been allocated to the North-East Province, the center of a long-running Tamil sepa- ratist movement. In this sense, fiscal transfers appear to ad- dress a political problem as well. In Bangladesh, however, no explicit mandates direct resource transfers toward poorer re- gions. The World Bank’s recent Public Expenditure Report on Bangladesh raised the concern that poorer regions are be- ing allocated lower levels of per capita development funding (World Bank 2009a). Helping Lagging Regions The focus on shared prosperity does not necessarily imply re- ducing inequality, but rather emphasizes the need for a social, economic, and institutional arrangement that maximizes the incomes of the less well off. Moreover, policies and programs that are consistent with these objectives have to be fiscally sus- tainable. The right policies for a country are those that are part of a detailed social contract that aims to end poverty per- manently, along an intertemporally balanced growth path and in an environmentally sustainable fashion. The well-being of lagging and poorer states is constrained by the total availability of resources. One way of overcoming the resources problem would be to divert resources from ex- isting subsidy-oriented programs toward safety nets, educa- tion, health, and infrastructure. Another is to accelerate the privatization of central public sector enterprises (PSEs) and earmark the proceeds from these sales specifically to the de- velopment of much needed economic and social infrastruc- ture in the lagging regions. This would be a much more effec- tive way of helping the poorer states than the traditional approach of pushing existing PSEs to make commercial in- vestments in the less developed states. Such initiatives have done little in the past for the economic development of the area and have often increased the probability of driving the PSEs into sickness. On the other hand, privatizing existing central PSEs, and using the proceeds to build social and eco- nomic infrastructure in the backward states will increase the efficiency with which existing PSE assets are used, while si- multaneously helping to improve the efficiency of resource use in the poorer states and hopefully leveraging a greater flow of private investment. Figure 3. Social Service Expenditures across Indian States, 2006–7 Source: Ministry of Finance 2008, 2009. Andhra Pradesh Bihar Chhattisgarh Gujarat Haryana Jharkhand Karnataka Kerala Madhya Pradesh Maharashtra Odisha Punjab Rajasthan Tamil Nadu Uttar Pradesh West Bengal 500 1,000 1,500 10,000 20,000 30,000 40,000 real gross state domestic product per capita per capita social services expenditure fitted values socialservicespercapita 2,000
- 7. 7 POVERTY REDUCTION AND ECONOMIC MANAGEMENT (PREM) NETWORK www.worldbank.org/economicpremise Figure 4. Different Types of Fiscal Transfers to Lagging Regions in India, 2005–6 Andhra Pradesh Bihar Chattisgarh Gujrat Haryana Jharkhand Karnataka Kerela Madhya Pradesh Maharashtra Orissa Punjab Rajasthan Tamil Nadu Uttar Pradesh West Bengal 400 600 800 1,000 1,200 10,000 20,000 30,000 40,000 per capita GDP (1999–2000 prices) tax share tranfers per capita fitted values a. Tax shares Andhra Pradesh Bihar Chattisgarh Gujrat Haryana Jharkhand Karnataka Kerela Madhya Pradesh Maharashtra Odisha Punjab Rajasthan Tamil Nadu Uttar Pradesh West Bengal 100 150 200 250 300 10,000 20,000 30,000 40,000 per capita GDP (1999–2000 prices) state plan tranfers per capita fitted values b. State plan schemes Sources: Ministry of Finance 2008; Food Corporation of India for food subsidy allocation. Note: States in India can obtain resources from the central government in three main ways. The first consists of tax shares and grants decided by a nonpolitical Finance Commis- sion. Centrally sponsored schemes give various ministries grants to their counterparts in the states for specified projects either wholly funded by the center (central sector projects) or requiring the states to share a proportion of the cost (centrally sponsored schemes). These are wholly discretionary and often are not coordinated with Planning Commission transfers. In addition to these explicit transfers from the center to the states, a number of hidden or implicit transfers arise from the large subsidies provided by the central government for food and fertilizer, the existence of subsidized borrowing resources for the states from the central government or government-owned financial institutions, and tax exportation. The largest component of fiscal transfers in India comes from tax-sharing schemes, for which the Finance Commission has an explicit mandate to help poorer states. Andhra Pradesh Bihar Chattisgarh Gujrat Haryana Jharkhand Karnataka Kerela Madhya Pradesh Maharashtra Odisha Punjab Rajasthan Tamil Nadu Uttar Pradesh West Bengal 1 2 3 4 10,000 20,000 30,000 40,000 per capita GDP (1999–2000 prices) per capita food subsidy (sales) fitted values d.Food subsidy Andhra Pradesh Bihar Chattisgarh Haryana Karnataka Madhya Pradesh Maharashtra Odisha Punjab Tamil NaduUttar Pradesh West Bengal 0 10 20 30 40 10,000 20,000 30,000 40,000 per capita GDP (1999–2000 prices) per capita food subsidy (purchases) fitted values e.Food subsidy (purchases) Andhra Pradesh Bihar Chattisgarh Gujrat Haryana Jharkhand Karnataka Kerela Madhya Pradesh Maharashtra Odisha Punjab Rajasthan Tamil Nadu Uttar Pradesh West Bengal 200 300 400 500 600 700 10,000 20,000 30,000 40,000 per capita GDP (1999–2000 prices) discretionary transfers per capita fitted values c. Discretionary schemes Andhra Pradesh Chattisgarh Gujrat Haryana Jharkhand Karnataka Kerela Madhya Pradesh Maharashtra Odisha Punjab Rajasthan Tamil Nadu Uttar Pradesh West Bengal 10,000 20,000 30,000 40,000 per capita GDP (1999–2000 prices) per capita fertilizer subsidy fitted values f. Fertilizer subsidy Bihar 0 2 4 6 Conclusion The current patterns of economic growth are not sufficient to enable the lagging regions of South Asia to catch up with the leading regions in terms of proportional poverty reduction. Given that South Asia has the world’s largest number of peo- ple living below the poverty line, and that the majority of the poor are in lagging regions, policies must be specifically tar-
- 8. 8 POVERTY REDUCTION AND ECONOMIC MANAGEMENT (PREM) NETWORK www.worldbank.org/economicpremise geted toward achieving greater growth and poverty reduction in these regions. One particular policy measure to achieve shared prosper- ity is pro-poor fiscal transfers. The performance of South Asian countries in achieving horizontal equity through fiscal transfers is mixed. For the most part, the systems of interstate fiscal transfers in South Asian countries do transfer a greater amount of resources to poorer regions, suggesting that they are working to achieve greater equity. However, this outcome usually occurs when interstate fiscal transfers are transparent and have explicit rules, and this is not always the case. Further, simply directing financial resources to lagging regions may not be sufficient and may need to be comple- mented with increases in capacity, accountability, and partici- pation at the local level, so that poor regions can make full use of these resources. Fiscal decentralization and other resource transfer poli- cies can be complementary to policies that directly aim to ac- celerate the growth rate in lagging regions. This can be done by improving the business environment for the private sector, supporting market integration, improving connectivity, and ensuring macroeconomic stability. The government can also intervene directly in sectors or locations in which the private sector is reluctant to invest. Policy makers need to boost shared prosperity and take another look at the Millennium Development Goal para- digm. A new lens is needed—one that shifts the focus of policy from national to subnational level, and from leading to lag- ging regions, where poverty, gender disparity, and human misery are concentrated. About the Authors Ejaz Ghani is a Lead Economist in the Poverty Reduction and Economic Management (PREM) Economic Policy and Debt De- partment. Lakshmi Iyer is an Associate Professor at the Harvard Business School. Saurabh Mishra is at the International Mone- tary Fund’s Research Department. Note 1. These figures are for the 12th Finance Commission. The 13th Finance Commission (Ministry of Finance 2009), whose recommendations apply from 2010–15, assigned weights as follows: state area, 10 percent; population, 25 per- cent; fiscal discipline, 17.5 percent (measured as the improve- ment in the ratio of the state’s own revenue to total expendi- ture, relative to all other states); and fiscal capacity distance, 47.5 percent (measured as the difference between the state’s estimated per capita revenue and the per capita revenue of Haryana, the second highest state in terms of revenue per capita). References Ahluwalia, M. 2000. “Economic Performance of States in the Post Reforms Period.” Economic and Political Weekly May (6): 1637–48. Bardhan, Pranab. 2002. “Decentralization of Governance and De- velopment.” Journal of Economic Perspectives 16 (4): 185–205. Chen, Shaohua, and Martin Ravallion. 2008. “The Developing World Is Poorer Than We Thought, But No Less Successful in the Fight against Poverty.” World Bank Policy Research Working Paper 4703, Washington, DC. Galasso, E., and M. Ravallion. 2005. “Decentralized Targeting of an Anti-Poverty Program.” Journal of Public Economics 89: 705–27. Galiani, Sebastian, Paul Gertler, and Ernesto Schargrodsky. 2008. “School Decentralization: Helping the Good Get Better, But Leaving the Poor Behind.” Journal of Public Economics 92: 2106–20. Ghani, Ejaz, ed. 2010. The Poor Half Billion in South Asia—What Is Holding Back Lagging Regions? Oxford University Press. Ghani, Ejaz, L. Iyer, and S. Mishra. 2010. “Are Lagging Regions Catching up with Leading Regions?” In The Poor Half Billion in South Asia—What Is Holding Back Lagging Regions?, ed. E. Ghani. Oxford University Press. International Monetary Fund. 2006. Government Finance Statistics. March. Kanbur, Ravi, and Andy Sumner. 2011. “Poor Countries or Poor People? Development Assistance and the New Geography of Global Poverty.” http://kanbur.dyson.cornell.edu/papers/Kan- burSumnerPoorCountriesOrPoorPeople.pdf. Kraay, Aart. 2006. “When Is Growth Pro-Poor? Evidence from a Panel of Countries.” Journal of Development Economics 80: 198–227. Lopez, Humberto, and Luis Serven. 2009. “Too Poor to Grow.” World Bank Policy Research Working Paper 5012, Washington, DC. Ministry of Finance, India. 2008. Indian Public Finance Statistics, 2007–8. New Delhi. ———. 2009. Report of the Thirteenth Finance Commission (2010– 2015), Chapter 8. http://fincomindia.nic.in/ShowContentOne. aspx?id=28&Section=1. Ravallion, Martin. 2012. “Why Don’t We See Poverty Conver- gence?” American Economic Review 102 (1): 504–23. Seabright, Paul. 1996. “Accountability and Decentralization in Government: An Incomplete Contracts Model.” European Economic Review 40 (1): 61–89. World Bank. 2009a. Bangladesh Public Expenditure Review. Wash- ington, DC. ———. 2009b. PovcalNet. PovcalNet Online Poverty Analysis Tool. http://iresearch.worldbank.org/PovcalNet/index.htm. ———. 2009c. World Development Indicators, World Bank. ———. 2008. “Qualitative Decentralization Indicators.” World Bank. The Economic Premise note series is intended to summarize good practices and key policy findings on topics related to economic policy. They are produced by the Poverty Reduction and Economic Management (PREM) Network Vice-Presidency of the World Bank. The views expressed here are those of the authors and do not necessarily reflect those of the World Bank. The notes are available at: www.worldbank.org/economicpremise.