SlideShare a Scribd company logo
1 of 21
Download to read offline
ISSN 2348-3156 (Print)
International Journal of Social Science and Humanities Research ISSN 2348-3164 (online)
Vol. 10, Issue 1, pp: (233-253), Month: January - March 2022, Available at: www.researchpublish.com
Page | 233
Research Publish Journals
THE ECONOMIC IMPLICATIONS OF
HIGH DEBTS PROFILE TO A
DEVELOPING NATION: EMPHASIS ON
NIGERIA
Dr. Amieyeofori Valentine Felix, PhD
ENERGYHUBNG.COM, 2022
Abstract: Public debts if secured and managed sustainably have been shown to boost economic growth and
development, especially for developing economies. Unfortunately, Nigeria’s increasing debt profile, has not been
managed efficiently and transparently to produce the desired economic benefits, but rather, as noted in this paper,
the country may be treading towards the threshold of debt unsustainability at debt to GDP ratio of 40%. The
country uses more than 90% of its revenue to service its debts, which, the paper noted has pushed the country into
debt distress, macroeconomic challenges- financial and currency crises, high unemployment, and extreme poverty
of nearly 50% of the total population. The paper thus proffered strategic policy recommendations, such as
reducing cost of government, switching to interest free debt instruments, and asset-linked securitization; removal
of fuel subsidies, and finally ensure transparent and ensuring public, parliamentary and creditors’ scrutiny of the
public debts.
1. INTRODUCTION
When it comes to the concept of classification of countries according to the level of their development, there is no
generally acceptable criterion mostly because of the large and easily discernible differences in the standard of living
enjoyed by citizens of different countries. Consequently, the three major international organizations, United Nations
Development Programme (UNDP), World Bank, and the International Monetary Fund (IMF), all have different but
closely related development taxonomies to differentiate the levels of development of countries. The UNDP classification
is built around Human Development Index (HDI). (Nielson 2011). The Human Development Index (HDI) is a statistical
tool used to measure a country's overall achievement in its social and economic dimensions. The social and economic
dimensions of a country are based on the health of people, their level of education attainment and their standard of living.
It was created by Pakistani economist Mahbub ul Haq in 1990 which was further used to measure the country's
development by the United Nations Development Program (UNDP). (The Economics Times, 2021). Human
Development Index value is determined by combining a country's scores in a vast and wide-ranging assortment of
indicators including life expectancy, literacy rate, rural populations' access to electricity, GDP per capita, exports and
imports, homicide rate, multidimensional poverty index, income inequality, internet availability, and many more. These
indicators are compiled into a single number between 0 and 1.0, with 1.0 being the highest possible human development.
HDI is divided into four tiers: very high human development (0.8-1.0), high human development (0.7-0.79), medium
human development (0.55-.70), and low human development (below 0.55). (World Population Review, 2021). Every
year UNDP ranks countries based on the HDI report released in their annual report. HDI is one of the best tools to keep
track of the level of development of a country, as it combines all major social and economic indicators that are responsible
for economic development. (The Economics Times, 2021). Most developed countries have an HDI score of 0.8 or above
(in the very high human development tier). These countries have stable governments, widespread education, healthcare,
high life expectancies, and growing, powerful economies. In contrast to this are the world's least developed countries
(LDCs), which tend to have HDI scores below 0.55, in the "low human development" category. LDCs face unstable
ISSN 2348-3156 (Print)
International Journal of Social Science and Humanities Research ISSN 2348-3164 (online)
Vol. 10, Issue 1, pp: (233-253), Month: January - March 2022, Available at: www.researchpublish.com
Page | 234
Research Publish Journals
governments, widespread poverty, lack of access to healthcare, and poor education. Additionally, these countries have
low income and low life expectancies, coupled with high birth rates. Based on the UNDP 2020 HDI Report, there are 66
countries in the very high DHI with Norway at the top with 0.957, Denmark as 10th
with 0.940, the UK on 13th
with
0.932; the USA on 16th
with 0.926, while Mauritius, is ranked 66th
with 0.804. There are 52 countries in the High HDI
group with Seychelles on top of this group as 67th
on the table with 0.796; China is ranked 85th
with 0.761; Algeria is 91st
with 0.728; South Africa is ranked 114 with 0.709, while Gabon is the last member on this group as 119th
with 0.703.
There are 36 countries under the Medium HDI with Kyrgstan on top of this list as 120th
with 0.697; Namibia at 137th
with
0.646, Ghana is 138th
with 0.611, Cameroon is 153th with 0.563, while Comoros is last on this list as 156th
with 0.554.
The last group, Low HDI contains 32 countries with Mauritania on top of this list as 157th
with 0.546, Nigeria is 161th
with 0.539, South Sudan is 185th
with 0.433, while Niger is the last on this list at 189th
with 0.394. (World Population
Review, 2021).
The World Bank brought out its first development classification, called the World Development Index (WDI) in 1978 in
its World Development Report. The 1978 WDI classified countries into three groups: Developing countries, industrialized
countries, and Capital-surplus oil exporting countries. The developing countries were further classified as low income
with Gross National Income per capita (GNI/n) of USD$250 or less, and middle-income countries with GNI/n of
USD$250 and above. Another classification was introduced in 1989 with the introduction of high-income category with
GNI/n above USD$6000. The WDI further split the middle-income developing countries into lower and upper middle-
income countries, while the category of industrialized countries was abolished. (Nielson, 2011). (World Economic
Situation and Prospects 2014). The World Bank‘s classifications are updated each year on July 1 and are based on GNI
per capita in current USD, and the classifications are generally changed for two reasons: (i) In each country, factors such
as economic growth, inflation, exchange rates, and population growth influence GNI per capita. Revisions to national
accounts methods and data can also have an influence in specific cases. (ii) To keep the income classification thresholds
fixed in real terms, they are adjusted annually for inflation. (Hamadeh et al 2021).
Table 1: New World Bank Country Classifications -Income Level – 2021-2022
Group July 1, 2021 (new) July 1, 2020 (old)
Low Income
Lower-middle income 1,046 – 4,095 1,035 – 4,045
Upper-middle income 4,096-12,695 4,046- 12,535
High income >12,695 >12,535
Finally, the IMF in its International Financial Statistics (IFS) published in 1948 classified the countries into Industrial
countries, (2) other high-income countries (3) less developed countries. This system was further classified in early 1970
into (1) Industrial countries (2) primary producing countries in more developed areas and (3) primary producing countries
in less developed areas. By mid 1970s, the classification has further moved to (1) industrial countries (2) other Europe,
Australia, New Zealand, South Africa (3) oil exporting countries, and (4) other less developed areas. Further refinement
of the classification in 1997 renamed the Industrial countries as Advanced Countries group, while in 2004, the WDI
introduced the developing and emerging economies categories, to separate them from the categories of Advanced
economies. (Nielson, 2011). Advanced Economies are sub-catergorised into Euro Area, Major Advanced Economies
(G7), Newly Industrialized Asian Economies, Other Advanced Economies (Advanced Economies excluding G7 and Euro
Area), and the European Union. The Emerging and Developing Economies are sub categorised into Central and Eastern
Europe, Commonwealth of Independent States, Developing Asia, ASEAN-5, Latin America and the Caribbean, Middle
East and North Africa, Sub-Saharan Africa. (Gbadamosi, 2021).
Generally, the following characteristics separate developed or advanced economies from developing economies:
Developed countries have the following features; High level of per capita income, Predominance of industrial activities,
Significant share in manufactured product in GNP, high level of foreign exchange reserves, Predominance of tertiary
institutions of commerce and banking industry, high level of technology and product capitalization, high level of
economic development and growth, and better condition of living for the generality of the people. At the bottom of the
ladder are underdeveloped or least developed economies with the following features: low revenue/capital income;
preponderance of agriculture, industrial backwardness, capital deficiency (low rate of capital formation, technical
progress and shortage of savings), Rapid population growth, Unemployment and under employment, prevalence of
ISSN 2348-3156 (Print)
International Journal of Social Science and Humanities Research ISSN 2348-3164 (online)
Vol. 10, Issue 1, pp: (233-253), Month: January - March 2022, Available at: www.researchpublish.com
Page | 235
Research Publish Journals
backward technology, underutilization of natural resources, and unsuitable political and social structure. Consequently,
developing economies fall in between the developed and the least developed economies with the following features:
increase in national income, increase in investment level, increase in industrial production, increase in agro production
both the concentration and diversification, modernization of agriculture, increase in social overheads, improvement in
stock and capital formation, high capacity to export manufactured goods, massive establishment of promotional structure,
and reorientation of social institution. (Otokiti, 2004). Developing Economies are very diverse group of economies,
ranging from large economies with dynamic economic growth, referred as emerging economies, like China, India or
Brazil which are experiencing growth in GDP and exports even in the period of crises. Others are the smaller and middle-
income economies with some specific factor on which they base their development. The last subgroup of Developing
Economies are those countries who are economically vulnerable and usually record decline in their GDP, classified by the
United Nations as Least Developed Economies (LDC). These economies are usually also very indebted so they have the
worst position in the global economy
2. CURRENT GLOBAL ECONOMIC PERSPECTIVES
The ongoing pandemic continues to shape the path for global economic activity, with severe outbreaks continuing to
weigh on growth in many countries. The most recent wave of COVID-19 is now centered in some emerging market and
developing economies (EMDEs), where more transmissible and virulent strains are spreading and where vaccine access
remains limited. Vaccination remains especially feeble in low-income countries (LICs). In contrast, advanced economies
have generally seen substantial vaccination progress, which has helped limit the spread of COVID-19. Amid continued
vaccination, economic activity is firming across major advanced economies most notably in the United States, where the
recovery is being powered by substantial fiscal support Growth in China remains solid but has moderated as authorities
have shifted their focus from buttressing activity to reducing financial stability risks. Many other countries, primarily
EMDEs, are experiencing subdued pickups alongside surges of COVID-19 cases, even if recent waves of infections
appear to be less disruptive to economic activity than previous ones.
Figure 1: Progress in vaccination against COVID-19 by Economies: Source: IMF, 2021
Recoveries in fragile and conflict-affected LICs are particularly weak, as the pandemic has exacerbated underlying
challenges. Whereas global manufacturing activity has firmed, with industrial production surpassing its pre-pandemic
level, services activity especially travel and tourism remains soft. Global financial conditions have tightened somewhat,
partly reflecting a rise in U.S. bond yields amid increased inflation pressures. Nevertheless, they remain generally
supportive, reflecting continued extraordinary policy accommodation by major central banks. Commodity prices have
increased markedly, owing to the improving global outlook as well as commodity-specific supply factors. The recovery in
global activity and in commodity prices is contributing to an increase in inflation, especially in some EMDEs that have
ISSN 2348-3156 (Print)
International Journal of Social Science and Humanities Research ISSN 2348-3164 (online)
Vol. 10, Issue 1, pp: (233-253), Month: January - March 2022, Available at: www.researchpublish.com
Page | 236
Research Publish Journals
experienced currency depreciation. (World Bank, 2021). Against this background, the global economy is projected to
grow 5.9 percent in 2021 and 4.9 percent in 2022, 0.1 percentage point lower for 2021 than in the July forecast. The
downward revision for 2021 reflects a downgrade for advanced economies in part due to supply disruptions and for low-
income developing countries, largely due to worsening pandemic dynamics. This is partially offset by stronger near-term
prospects among some commodity-exporting emerging market and developing economies. Rapid spread of Delta and the
threat of new variants have increased uncertainty about how quickly the pandemic can be overcome. Policy choices have
become more difficult, with limited room to maneuver. (IMF, 2021)
Table 2: IMF Economic Projection
Figure 2: Global Economic Activity Indicators. Source: IMF, 2021
ISSN 2348-3156 (Print)
International Journal of Social Science and Humanities Research ISSN 2348-3164 (online)
Vol. 10, Issue 1, pp: (233-253), Month: January - March 2022, Available at: www.researchpublish.com
Page | 237
Research Publish Journals
The recovery is not assured: the possibility remains that additional COVID-19 waves, further vaccination delays,
mounting debt levels, or rising inflationary pressures deliver setbacks. First and foremost, expanding vaccine distribution
and deployment, especially to developing countries, is a precondition to economic recovery. This requires overcoming
obstacles in procuring and distributing vaccines including by redirecting excess vaccine supplies from some advanced
economies to developing countries that have delivery programs in place. This also entails expanding vaccines production,
lifting trade restrictions on vaccine inputs, and improving the transparency of vaccine orders, options and delivery
schedules. Attention to debt is another critical task. The last decade saw the largest, fastest, and most broad based increase
in debt levels around the world. The pandemic, which spurred an unprecedented buildup in government debt in many
economies, amplified this trend. These developments highlight the importance of careful use of debt financed spending. In
particular, capital need be allowed to flow for productive uses, especially in countries that have implemented large-scale
fiscal support. Effective domestic revenue mobilization and robust medium-term fiscal frameworks are essential to widen
fiscal space, foster policy credibility, and bolster debt sustainability. Improved debt management and debt transparency
are critical components of sound governance. These challenges are particularly important for low-income countries, half
of whom faced debt distress or were at high risk of it even before the pandemic struck. The resources required to service
debt—due to high interest rates and elevated debt levels divert funds from investment in health, nutrition, education, and
other critical development needs. It will take continued global cooperation—including greater participation by the private
sector to provide debt relief to the poorest countries and fund the investments needed to foster and sustain longer-term
growth. (World Bank, 2021).
3. PUBLIC DEBT AND ECONOMIC DEVELOPMENT
Growing any economy especially in this era of fourth industrial revolution requires that countries invest in critical areas
such as artificial intelligence, machine learning, technological development, and human capital, and these would require
massive amount of funds, which in most cases are raised from external borrowing as internal funds such as revenues from
trade and taxation might not be sufficient. This is because, taxation creates distortionary effects on economic growth, and
therefore is less popular among the policymakers. Public debt is therefore only feasible option to finance government
expenditures and other development projects if the country lacks funds, and this is consistent with the Ricardian
invariance theorem, in which taxation gives excess burden to the public by increasing the cost of living and reducing the
purchasing power of people. (Rahman et al, 2019). The World Bank defined government or public debt as the entire stock
of direct government fixed-term contractual obligations to others outstanding on a particular date. It includes domestic
and foreign liabilities such as currency and money deposits, securities other than shares, and loans. It is the gross amount
of government liabilities reduced by the amount of equity and financial derivatives held by the government. Because debt
is a stock rather than a flow, it is measured as of a given date, usually the last day of the fiscal year. (World Bank, 2021).
According to Hakura, 2020, of the IMF, a debt instrument is a financial claim that requires payment of interest, principal,
or both by the debtor to the creditor at a future date. Technically, a debt is regarded essentially as that which a person or
group of people legally owes another or an obligation that is enforceable by legal action to make payment for money
owed to another. It is the disbursement of funds made available to a needy entity (or nation) by a wealthy entity or
institution, for development and consumption purposes on certain terms of repayment. Thus, a debt owed by a
government is called public debt, which can be incurred from domestic and or international financial markets, and where
the debt is obtained for investment in assets or infrastructure, it is referred to be reproductive debt, while borrowings to
finance wars and recurrent expenditures are called dead-weight debts. Domestic debts are debts secured within the
jurisdiction of the government, while external debt refers to unpaid portion of foreign resources acquired from
developmental purposes and balance of payment support, which are not repaid as they fall due. (Senibi et al, 2016).
Hakura, 2020 added that the definition of public debt varies depending on its purpose, and that the commonly used narrow
definition of public debt only covers the budgetary central government, and thus rather limiting. A broader definition
would thus include the general government (budgetary central government, state and local government, extrabudgetary
units, and social security funds). This definition thus combines general government with public nonfinancial corporations
and public financial corporations, including the central bank. It also covers publicly guaranteed debt (debt the public
sector does not hold but has an obligation to cover) and external public debt (debt held by nonresidents of the country).
Eke and Akujuobi, 2021, in their paper described public debt as one of the major indicators of the macroeconomic
variables that forms the image of countries in the international markets. As one of the determinants of foreign direct
investment flows, prudent management of public debt creates economic prosperity and stability through resources
ISSN 2348-3156 (Print)
International Journal of Social Science and Humanities Research ISSN 2348-3164 (online)
Vol. 10, Issue 1, pp: (233-253), Month: January - March 2022, Available at: www.researchpublish.com
Page | 238
Research Publish Journals
mobilization with low borrowing cost and limited financial risk exposure. Public debt is also one of the approaches used
in financing government projects, which include debts at national, state and local governments that revealed how much
public spending is financed through borrowing instead of taxation. However, public debt can rise and become a burden
due to overreliance on external borrowings to augment capital formation in the nation‗s economy. The debt becomes a
burden when interest payments on the borrowed fund places pressure on the current account of the government, resulting
into debt overhang, which is a condition by which the expected repayment on external debt falls short of the contractual
value of debt. If the level of a nation‗s debt is expected to exceed the country‗s ability to repay with some probability in
the future, expected debt service is likely to be an increasing function of the output level of the country. (Eke and
Akujuobi, 2021).
According to Ranasinghe, 2021 of the Institute of International Finance, (IIF), Global debt rose to a new record high of
nearly $300 trillion in the second quarter of 2021 though debt-to-GDP ratio declined for the first time since the start of the
pandemic as economic growth rebounded. Total debt levels, which include government, household and corporate and
bank debt, rose $4.8 trillion to $296 trillion at the end of June 2021 as shown in figure 3, after a slight decline in the first
quarter, to stand $36 trillion above pre-pandemic levels and according to IIF, if the borrowing continues at this pace,
global debt can exceed $300 trillion. The rise in debt levels was the sharpest among emerging markets, with total debt
rising $3.5 trillion in the second quarter from the preceding three months to reach almost $92 trillion.
Figure 3. Global Debt Situation. Source: Ranasinghe, 2021
Debt as a share of gross domestic product fell to around 353% in the second quarter, from a record high of 362% in the
first three months of this year. The IIF said that of the 61 countries it monitored, 51 recorded a decline in debt-to-GDP
levels, mostly on the back of a strong rebound in economic activity. The IIF further reported that China has seen a steeper
rise in its debt levels compared with other countries, while emerging-market debt excluding China rose to a fresh record
high at $36 trillion in the second quarter of 2021, driven by a rise in government borrowing. The IIF noted that after a
slight decline in the first quarter, debt among developed economies especially the euro area rose again in the second
quarter, 2021 (Ranasinghe, 2021).
3.1 External Debts for Developing Nations
The situation of any debtor countries has a specific character, and thus making it impossible to enumerate all the factors
contributing to the occurrence of external debt. However, one of the core reasons for taking external loans are
undoubtedly deficiencies in one‘s own capital and the aspirations related to development, consumption, and expansion.
(Gorniewicz, 2009). Countries incur debt by borrowing, as borrowing enable countries to finance important development
programs and projects. This notwithstanding, the reasons for running into debt depend mainly on the level of the
development of a country, and thus differ for economically well-developed countries and for developing countries.
Despite these multifarious differences, some common causes, which are typical of developing countries, may be
distinguished, starting with the most general classification, the internal (dependent on the debtor country) and external
(independent of the debtor country) sources of external debt. The internal sources (dependent on the policies followed by
ISSN 2348-3156 (Print)
International Journal of Social Science and Humanities Research ISSN 2348-3164 (online)
Vol. 10, Issue 1, pp: (233-253), Month: January - March 2022, Available at: www.researchpublish.com
Page | 239
Research Publish Journals
debtor countries) of the occurrence of external debt include: 1) Investment policies and liberal import norms, 2) Budget
and finance policy and currency policy, 3) National capital flight. (Gorniewicz, 2009). Debt accumulation offers both
benefits and costs, and also some challenges, which is mostly the difficulties in managing the debt transparently. The
benefits depend heavily on how productively the debt is used, the cyclical position of the economy, and the extent of
financial market development. Additional debt accumulation by emerging and developing economies may be needed to
invest in growth-enhancing projects (e.g., infrastructure, health, and education), and to protect vulnerable groups. During
periods of weak growth, it may also be appropriate to borrow in order to employ expansionary fiscal policy to stimulate
activity. Moreover, government debt could act as a safe asset when borrowing conditions of investors are tightened.
Temporary debt accumulation also plays an important role to stabilize short-term macroeconomic fluctuations. During
recessions, borrowing for government spending or tax cuts can provide the necessary fiscal stimulus to support activity.
(Kose et al 2020).
3.2 Debt Sustainability
While debt is a veritable financial instrument for development, it must be handled cautiously as if taken too far can
become a burden and overwhelm a country‘s finances, at worst leading to default. Elevated debt, according to Hakura,
2020, in low-income countries and emerging market economies in recent years has raised concerns about countries‘
capacity to sustain these levels of debt. COVID-19 is adding to spending needs as countries seek to mitigate the health
and economic effects of the crisis. The resulting rise in public debt will likely heighten the tension between meeting
important development goals and containing debt vulnerabilities. It is therefore imperative for governments to properly
assess its debt sustainability, and this can only be productive if such exercise covers all types of debt that pose a risk to a
country‘s public finances. According to Hakura, 2020, it will be detrimental and lead to unexpected consequences, if the
government only focuses on a narrowly defined concept of public debt and cited a situation where the debt burden of a
loss-making state-owned enterprise can easily become the burden of the central government since such debt is publicly
guaranteed, leading to unexpected weakening in a country‘s debt sustainability. In how much debt is sustainable, Hakura,
2020, highlighted some factors that could determine how much debt a country can carry before the burden becomes too
much. A country‘s debt-carrying capacity depends on such factors as the quality of institutions and debt management
capacity, policies, and macroeconomic fundamentals, all of which can change over time, as it is also influenced by the
global economic environment. Hakura, 2020, who is also a deputy division chief in the IMF‘s Strategy, Policy, and
Review Department, mentioned that the IMF‘s frameworks for debt sustainability assessment in low-income countries
and countries with access to capital markets take into consideration individual countries‘ debt-carrying capacity. The
assessments are calibrated in reference to previous episodes of debt distress for groups of countries with similar economic
characteristics. The calibrations lead to debt sustainability analysis thresholds for key public debt indicators that signal
higher risk if that indicator exceeds (or is expected to exceed) its threshold and can be either based on historical
experience or convey information about the likelihood of future debt distress. These frameworks, Hakura, 2020 added,
consider the degree of uncertainty in the projections of the debt and debt service indicators. This is done through fan
charts and stress tests. Because these assessments are based on projections of debt, interest, and key macroeconomic
variables, both frameworks also rely on tools to help to gauge the realism of these forecasts. The IMF‘s approach to debt
sustainability also leaves room for informed judgment. While low interest rates have arguably increased countries‘
capacity to borrow, it does not however, necessarily translate into an ability to handle higher debt service. Even if interest
rates are low and the availability of financing is ample, experience has shown that there are limits to countries‘ debt-
carrying capacity and that rising debt-service burdens need to be carefully managed.
Another factor that will play a significant role in debt sustainability is growth, as all things being equal, higher growth
improves debt dynamics. Indeed, most historical cases of significant debt reductions without restructuring have involved a
surge in growth. In many of these cases, however, growth was driven by factors outside the countries‘ control, such as a
global boom, the coming onstream of natural resources exports, or improved terms of trade (a country receiving relatively
higher prices for its exports and paying relatively lower import prices). According to Hakura, 2020, without such external
impulses, stimulating growth domestically for a sustained period can be difficult, and can require new debt for instance, to
fund public investment. With the current uncertain outlook for growth, debt service needs to be carefully managed, and
strengthening debt management and debt data should be top priorities. She concluded that, while advanced economies and
emerging markets, carry out frequent debt sustainability analysis that focuses on the general government, low-income
countries rarely complete coverage of both public and publicly guaranteed debt. Again, it is important that the
ISSN 2348-3156 (Print)
International Journal of Social Science and Humanities Research ISSN 2348-3164 (online)
Vol. 10, Issue 1, pp: (233-253), Month: January - March 2022, Available at: www.researchpublish.com
Page | 240
Research Publish Journals
sustainability assessment must also include the holders of public debt, and that assessments of debt sustainability carried
out by the IMF and World Bank cover both domestic and external public sector debt, while sovereign credit rating
agencies focus more on the risk of debt distress on market-based external public sector debt.
3.3 The Cost of High Debt to Developing Economies
The most basic cost of public debt is the servicing cost of the interest to be paid to creditors. An important argument
against heavy borrowing, which may outweigh the benefits of borrowing in some countries, is that rollover costs, the costs
of refinancing when debt matures can increase sharply during periods of financial stress and even trigger a financial crisis.
High debt can also limit the feasible size and effectiveness of fiscal stimulus during downturns and constrain growth over
the long term by crowding out productivity-enhancing private investment. There is also the issue of increasing
vulnerability to financial crises with high debt, as a growing debt-to-GDP ratio could erode investor confidence, requiring
the government to pay a rising risk premium on its debt. These pressures could culminate in a debt crisis if investors fear
that the accumulation of government debt is no longer sustainable. There is also a great chance of currency crises with
rapid debt accumulations, and this can happen when investor fear about the ability of the debtor country to repay foreign-
currency denominated debt. High debt can also lead to a banking crisis if private sector balance sheet vulnerabilities
trigger banking panics. Financial crises tend to result in large economic costs with large effects on economic activity, and
as has been observed, many recessions follow from financial crises, and financial crises often tend to make these
recessions worse than a ―normal‖ business cycle recession. One other cost of increasing debt is to constrain government
action during downturns, as high debt has capacity to constrain governments‘ ability to respond to downturns with
countercyclical fiscal policy, as was the case during the global financial crisis: fiscal stimulus during 2008-09 was
considerably smaller in countries with high debt than in those with low government debt. High government debt tends to
render expansionary fiscal policy less effective. In theory, high government debt can reduce the size of fiscal multipliers
through two channels. (Kose et al 2020).
First, there is the Ricardian channel, when a government with a weak fiscal position implements fiscal stimulus,
households expect tax increases sooner than in an economy with a strong fiscal position. The perceived negative wealth
effect leads households to cut consumption and save more, thereby weakening the impact of the stimulus on output. Thus,
the net effect of such fiscal policy in an economy with a weaker fiscal position will only generate smaller multiplier effect
on such economies. The second channel is an investor sentiment channel, as countries with high sovereign debt are more
likely to have to pay a risk premium to borrow. When debt is higher, fiscal stimulus can increase creditors‘ concerns
about sovereign credit risk, raising sovereign bond yields and, hence, borrowing costs across the whole economy. Higher
risk premia, especially during times of sovereign financial stress, have been shown to feed into lower corporate
borrowing, which will in turn crowd out private investment and consumption, reducing the fiscal multiplier. (Kose et al
2020). Contributing to the discourse on the cost of debt on developing nations, UNCTAD, 2021 added that developing
nations face critical challenges due to external indebtedness particularly in a context of floating exchange rate systems,
open capital accounts and fast integration into international financial markets. These nations according to UNCTAD,
2021, are therefore experiencing recurrent vulnerability to external shocks, especially for commodity dependent
economies during commodity price volatilities, as external debt serving obligations requires sufficient export earnings,
coupled with exchange rate volatility, both of which affect the value of debt owed externally. Developing countries are
also cornered to raise development finance on commercial terms in the international financial markets due to insufficient
international public finance flows and limited access to concessional resources. They are also further constrained to open
their domestic financial markets to non-resident investors, while their citizens resort to borrowing from overseas. These
external financial sources, while they help capital-scarce countries to quickly raise much-needed funds, they also expose
them to higher risk profiles of debt contracts, i.e. shorter maturities and more volatile financing costs, as well as to sudden
reversals of private capital inflows. In conjunction with other exogenous shocks, such as natural disasters, pandemics or
episodes of political instability, external debt burdens deemed sustainable by international creditors can quickly become
unsustainable. (UNCTAD, 2021). According to UNCTAD 2021 the external debt of developing nations grew to a record
high in 2020, with worsening risk profiles, reaching upto $10.6 trillion in the wake of the COVID-19 pandemic. This is
more than twice their value of US$4.4 trillion registered in 2009, and more than four-fold their level of US$2.3 trillion in
2000 as shown in figure 4.
ISSN 2348-3156 (Print)
International Journal of Social Science and Humanities Research ISSN 2348-3164 (online)
Vol. 10, Issue 1, pp: (233-253), Month: January - March 2022, Available at: www.researchpublish.com
Page | 241
Research Publish Journals
Figure 4. External Debt Stock for developing economies. Source: UNCTAD, 2021
The debt stock translated an average ratio of external debt to GDP from 23 per cent in 2008 (its lowest point in the last 20
years) to 31 per cent in 2020, as shown in figure 5, being the highest annual increase since the financial crisis, probably as
a result of the COVID-19 crisis.
Figure 5. External Debt stock as a percentage of GDP for Developing Economies. Source. UNCTAD, 2021
These trends are largely influenced by China, whose economy accounted for 23 per cent of total external debt stocks of
developing economies and 44 per cent of their GDP in 2020. During the period 2009-2020 China‘s external debt stock
grew at a slightly higher rate than the developing countries average, but its GDP grew much faster. As a result, the
average ratio of external debt to GDP for developing economies excluding China is 13 percentage points higher, reaching
44 per cent of their GDP in 2020. At the same time, the public-private composition of long-term external debt changed,
with the share of Private debt in overall external debt surpassing that of Public debt from 2011 to 2016 and practically
remaining at similar levels since then. In addition, the share of short-term debt (characterized by higher risk profiles)
increased, from 16 per cent of overall external debt in 2000 to 26 per cent in 2020, with a peak at 33 per cent in 2013.
Figure 5 also shows that over the past two decades, overall external debt stocks have not only risen markedly across all
developing regions, but has also been accompanied by a rising share of short-term debt and Public long-term debt. Given
their deeper financial systems, most of the international private lending into developing countries went to high-income
and upper-middle income economies, particularly in Asia and Latin America, with significant presence in Central Asia
and sub-Saharan Africa as shown in figure 6.
0
2000
4000
6000
8000
10000
12000 2000
2001
2002
2003
2004
2005
2006
2007
2008
2009
2010
2011
2012
2013
2014
2015
2016
2017
2018
2019
2020
External debt stocks, developing economies
(Billions of current US$)
0
10
20
30
40
2000
2001
2002
2003
2004
2005
2006
2007
2008
2009
2010
2011
2012
2013
2014
2015
2016
2017
2018
2019
2020
External debt stocks as a percentage of GDP,
developing economies
(Percentage)
Private Public Short-term debt
ISSN 2348-3156 (Print)
International Journal of Social Science and Humanities Research ISSN 2348-3164 (online)
Vol. 10, Issue 1, pp: (233-253), Month: January - March 2022, Available at: www.researchpublish.com
Page | 242
Research Publish Journals
Figure 6. External Debt Stock, developing economies by Region. Source. UNCTAD, 2021
Figure 5 further shows that developing countries now patronize more of private creditors, especially through public
bonds, to refinance their external debt obligations in international financial markets with strong speculative features than
the traditional official bilateral and multilateral creditors, which are generally more stable and in more favorable terms.
Besides the principal debt, one of the consequences of these rising debt profile is the increasing debt service costs on
public external debt, as debt service ratios are important indicators of a country‘s debt sustainability. The ratio reflects on
how a government can meet its external creditor claims on the public sector through export revenues. A persistent
deterioration of this ratio signals an inability to generate enough foreign exchange income to meet external creditor
obligations on a country‘s debt, and thus potential debt distress in the absence of multilateral support or effective
sovereign debt restructuring. According to the UNCTAD 2021 report, only high-income developing countries have
maintained a stable ratio of external long-term private debt to export revenues of around two to four per cent in the last
decade. They achieved this through issuance of more domestic public debt, with a view to avoiding currency mismatches,
which has its problems of creating maturity mismatches. In contrast, the debt service ratios of other developing economies
have increased markedly since 2012 across all other income categories: in middle-income countries this ratio rose from
3.3 per cent in 2012 to 7.1 per cent in 2020 and in low-income countries from 2.9 to 6.7 per cent. The squeeze on
government revenues from service payments on external debt was particularly drastic in Sub-Saharan Africa, where this
ratio jumped from a low point of 3.3 per cent in 2011 to 10 per cent in 2020. This is of concern since low-income
developing countries still rely predominantly on public financing to mobilize resources for structural transformation, yet
also struggle the most with limited fiscal space given their shallow domestic financial and banking systems and limited
options to refinance maturing debt obligations in the international financial markets.
3.4 Challenges with Debt Transparency
One of the challenges confronting developing economies‘ debt is the opaqueness of these debts due to lack of
transparency in debt management. The World Bank in its recent report on Debt Transparency in Developing Economies
showed that current global debt surveillance depends on a patchwork of databases with different standards and definitions,
resulting in large gaps in debt information for many low-income developing countries. (World Bank, 2021). Furthermore,
World Bank chief economist, Carmen Reinhart, stated that existing systems for tracking the sovereign debts of the poorest
countries are inadequate and mask hidden debts, as they are likely to owe far more than the record levels currently
estimated (Iyatse et al, 2021).
The Report revealed that where those debt data exist, they are mostly limited to central government loans and securities,
inclusion of other public sector components and debt instruments. This finding indicates that some Low-Income
Developing Countries (LIDCs), have debt data across various sources with variations in these data as high as 30 percent
of a country‘s gross domestic product. These huge differences are attributable to differing definitions and standards and
recording errors, and according to the World Bank report, these challenges expose LIDCs to the dangers of inadequate
debt transparency such as the risk of debt distress and delayed debt restructurings and threatens the ability of countries to
0
1000
2000
3000
4000
5000
East Asia &
Pacific
Latin America
& Caribbean
Middle East &
North Africa
South Asia Central Asia Sub-Saharan
Africa
External debt stocks, developing economies, by
region
(Billions of current US$)
2000 2020
ISSN 2348-3156 (Print)
International Journal of Social Science and Humanities Research ISSN 2348-3164 (online)
Vol. 10, Issue 1, pp: (233-253), Month: January - March 2022, Available at: www.researchpublish.com
Page | 243
Research Publish Journals
overcome the pandemic and generate a green, resilient, and inclusive recovery. The Report further showed that the
inherent opaqueness of their debt data makes it difficult for these governments to make sound decisions about borrowing,
and thus cause about 44% of low-income countries to face a high risk of debt distress while 12% are already experiencing
it. As a solution to these problems, the World Bank Report made the following high-priority recommendations to resolve
the challenges: (i) Develop a sound public debt management legal framework to establish clear debt authorization
provisions, and requiring the disclosure of public debt information, regulating its content and frequency and making it
easily accessible to all stakeholders; (ii) Publish core public and publicly guaranteed debt statistics at the general
government level annually, including information on individual debt instruments contracted; (iii) Limit and define the
scope of confidentiality clauses in borrowing, and refrain from those that require secrecy; (iv) Develop and adopt strict
analytical and monitoring processes for approval and implementation of resource-backed loans, and finally (v) Provide a
definition of public debt in line with international standards, announce the country‘s debt management objectives,
and provide a list of permitted debt instruments, transactions or sources of funding. However, due to the global
inclusiveness of these debt distresses, the race for debt transparency would need to involve international financial
institutions, debtors, creditors, and other stakeholders, such as credit-rating agencies and civil society.
According to the World Bank Group President David Malpass, the poorest countries are already on the path of emerging
from the COVID-19 pandemic with the largest debt burdens in the last few decades, but limited debt transparency will
delay critical debt reconciliation and restructuring for these countries (Iyatse et al, 2021). These challenges
notwithstanding, the World Bank Report further estimated that for low income developing countries to meet the
Sustainable Development Goals by 2030, they will need to invest at least 4.5 per cent of national GDP each year
on infrastructure alone. This will translate to about $429 billion between 2023-2025, and considering their revenue
bases, these funds will have to come from external financing through new borrowing, and to ensure that this
financing contributes effectively to development outcomes and does not undermine long-term debt sustainability,
the World Bank emphasized the need for debt transparency improvement by these economies. (Adenuga, 2021)
3.5 Empirical Findings on Public Debt and Economic Growth
While debt instrument fosters development goals, Soluso (2003) asserted that countries borrow for two broad reasons:
macroeconomic, that is, to finance higher levels of consumption and investment or to finance transitory balance of
payment deficit and avoid budget constraint and in turn, boost economic growth and reduce poverty. It is this constant
need for governments to borrow to finance budget deficit that leads to the external debt, which has also become a medium
used by countries to bridge their deficits and carry out economic projects that are able to increase the standard of living of
the citizenry and promote sustainable growth and development. Generally, the expectation is that public borrowing ought
to accelerate economic growth and improves total factor productivity through an increase in output which in turn
enhances Gross Domestic Product (GDP) growth of a nation. However, several empirical studies on the nexus between
public debt and economic growth are divided in their conclusions. Nur et al, 2019 carried out a systemic review of the
public debt and economic growth nexus by reviewing 33 articles on the subject, an came out with a summary that Overall,
24 of 33 articles which were investigated revealed a linear positive and negative or insignificant relationship between
public debt and economic growth. Linear positive relationship indicates that the economy can grow as the debt level
increases, which is a preferred condition since the country is able to increase public debt to meet their national objectives
such as enhancing their infrastructures, investing in human capital and so on. The linear negative relationship on the other
hand indicates that the economic growth is declining when the country increases its debt level, which will cause many
projects to be postponed, as additional debts will only lead to the slowdown of the economic growth. As a result, the
country might not be able to remain competitive since investors would no longer interested to invest in the country.
Regardless of the type of public debt, Nur et al, 2019 found that most of the articles on public debt and economic growth
from 2017 to 2019 showed a significant negative relationship between the two series. They further observed that the
relationship is applicable to all types of economies, regardless of whether they are lower-middle-income, upper-middle-
income or high-income economies. The negative relationship is consistent with the conventional view of debt, in which
there will be a crowding-out effect on the private investment when the economy is facing high debt problem. Those that
exhibited linear positive relationship showed that public debt can also contribute to higher economic growth, as an
increase in public debt will help to stimulate aggregate demand and output, among others, via the employment generation
and productive investment. However, this relationship is only applicable in the short-run. If it continues to increase in the
long run, the effect can switch to becoming negative. Therefore, it is important for the government to be alert on the debt
ISSN 2348-3156 (Print)
International Journal of Social Science and Humanities Research ISSN 2348-3164 (online)
Vol. 10, Issue 1, pp: (233-253), Month: January - March 2022, Available at: www.researchpublish.com
Page | 244
Research Publish Journals
threshold that can switch the debt‘s effect from positive to negative. On the issue of debt threshold, Nur et al, 2019 cited
the Reinhart-Rogoff hypothesis which argued that public debt can positively affect the economic growth if the debt to
GDP level is lesser than 90%, as once the debt-to-GDP is beyond the threshold, the effect changes to negative. However,
the debt level that is beyond 90% of the GDP indicates that the countries are among the highly indebted countries. Nur et
al, 2019 also cited other studies that found the threshold to be lower than 50% especially amongst European countries and
advanced economies such as Belgium, Canada, United Kingdom and United States. However, there is yet any mutual
consensus on the right threshold for each country or group of economies as the threshold for each country depends on
their current economic situation, the period of studies, the method and the proxies used to test the relationship.
Regardless, Rahman et al, 2019 noted that countries such as Lebanon and Greece that have a debt threshold more than
90% must start to reduce their public debt level to ensure greater economic prosperity in the future, as further increase in
public debt will not only burden the current generation due to an increase in taxation and reduce in investments.
Other empirical studies, mostly on Nigeria, and a few other countries as cited in this paper also confirmed the liner
positive and negative relationships between public debt and economic growth. In their works on the effect of public debt
on economic growth in Nigeria, covering the period 1981-2018, Eke and Akunjobi (2021) showed that a significant short-
run relationship exists between Nigeria's public debt and economic growth. Alenjandro and Ifeana (2017) work on the
impact of government debt on gross domestic product in 16 Latin American economies including Bolivia, Argentina,
Chile, Brazil, Costa Rica, Colombia, Dominican Republic, Mexico, Honduras, Panama, Nicaragua, Peru, Paraguay,
Venezuela and Uruguay for the period 1960-2015, showed that public debt has a positive impact on GDP growth but
declines to close to zero beyond public debt-to-GDP ratios between 64% and 71% up to this threshold, additional debt has
a stimulating impact on growth. Isaac and Rosa (2016) studies on the effect of public debt and public investments on
economic growth in Mexico for the period 1993-2012 showed that public debt has a positive influence on public
investment and economic growth in the economy. However, Naeem (2015) work on public debt and economic growth in
the Philippines for the period 1975-2010 showed that public external debt has a negative and significant impact on
economic growth and investment, which confirm the existence of a debt overhang effect. This negative impact was also
seen in the works of Lucky and Godday (2017) on the nexus between the public debts structure and the growth
performance of the Nigerian economy for the period 1990-2015 using multiple regression analyses. Similar results were
also obtained by Elom-Obed, Odo, Elom and Anoke (2017) on the nexus between public debt and economic growth in
Nigeria for the period 1980-2015 using co-integration test, Vector Error Correction Model (VECM) and Granger causality
test. The empirical results revealed that external debt and domestic debt have negative and significant effects on economic
growth in Nigeria.
Abula and Ben (2016) work on the effect of public debt on economic development in Nigeria from 1986 to 2014 also
showed that external debt servicing and external debt stock have a negative and insignificant impact on economic
development in Nigeria while domestic debt stock has a significant influence on economic development. The results also
showed that domestic debt service payment has a negative and significant effect on economic development in Nigeria.
Ayadi and Ayadi (2008) work on the impact of the huge external debt, with its servicing requirements on economic
growth of Nigerian and South African and revealed negative impact of debt and its servicing requirement on the economic
growth of Nigeria and South Africa. Audu (2004) investigation on the impact of external debt on economic growth and
public investment in Nigeria from 1970-2002, found that debt servicing pressure in the country has had a significant
adverse effect on the growth process and past debt accumulation negatively affect public investment. Malik, and Hayat
(2010) also investigated the nexus between external debt and economic growth in Pakistan for the period between 1972 –
2005, and found that external debt is negatively and significantly related to economic growth, while the work of
Abdelmawla and Mohammed (2005) on the impact of external debt on economic growth of Sudan for the period between
1978 – 2001, showed that export earnings have a significant positive impact while external debt and inflation had negative
impact on Sudan‘s economic growth. Finally, Karogol (2002) also confirmed that debt service is negatively related to
economic growth in the long-run for Turkey during 1956 – 1996.
4. NIGERIA PUBLIC DEBT
Nigeria‘s external debt can be traced to 1958 when about $ 28 million US dollars was contracted from the World Bank for
railway construction, and remained significantly low between 1958 and 1977, until 1978 due to the fall in oil prices that
exerted a negative influence on government finances. Consequently, the first major borrowing of $1 billion US dollars
referred to as Jumbo loan was contracted from the international capital market (ICM) in 1978. The spate of borrowing as
ISSN 2348-3156 (Print)
International Journal of Social Science and Humanities Research ISSN 2348-3164 (online)
Vol. 10, Issue 1, pp: (233-253), Month: January - March 2022, Available at: www.researchpublish.com
Page | 245
Research Publish Journals
shown in figure 7, has been on the upward trend due to increasing fiscal deficits driven by the higher level of external debt
servicing became a major threat to growth of the nation. The resultant effect of large accumulation of debt exposes the
nation to high debt burden. (Sulaiman and Azeez, 2012).
Figure 7: Nigeria Historical Debt Profile – 1970 – 2019. Source: Macrotrends, 2021
This spiraling debt profile has raised serious concerns among Nigerians on the debt sustainability of the country amid
dwindling revenue to meet the debt obligations to creditors. Historically, data from the Debt Management Office (DMO)
showed that federal government debt both local and foreign debt rose from N3.55 trillion in 1999 to N26.91 trillion at the
end of March 2021, representing a whopping 658 percent increase in 21 years, covering the administrations of Olusegun
Obasanjo, Umar Musa Yar‘Adua, Goodluck Jonathan, and the current Muhammadu Buhari. This is despite Chief
Olusegun Obasanjo led government securing debt relief in 2006 as the first African country to settle its public debt under
a scheme devised to help the world‘s poorest and indebted states. The country under Chief Olusegun Obasanjo paid off
$18 billion to secure forgiveness of the balance of its nearly $30 billion debts to the London and Paris clubs of foreign
creditors. The debt forgiveness is seen as a dip in the chart in figure 7 above. (Yusuf, 2021). Figure 8 shows the debt
status of each administration from Chief Olusegun Obasanjo from 1999 to 2007, to President Yar‘Adua from 2007 to
2010, and President Jonathan from 2010 to 2015, and finally the administration of President Buhari from 2015 to 2021,
which clearly shows the increasing domestic and foreign debt stock that has become a source of concern for all
stakeholders. The chart also shows the impact of debt forgiveness during President Obasanjo administration, which was
sustained during President Yar‘Adua government. The debt stock began the upward swing from 2011 and became
astronomical in the administration of President Buhari.
Figure 8: Nigeria Debt Structure from 1999 to 2021. Sources – Yusuf, 2021, and other sources.
-
10,000,000,000.00
20,000,000,000.00
30,000,000,000.00
40,000,000,000.00
50,000,000,000.00
60,000,000,000.00
1/1/1970
1/1/1973
1/1/1976
1/1/1979
1/1/1982
1/1/1985
1/1/1988
1/1/1991
1/1/1994
1/1/1997
1/1/2000
1/1/2003
1/1/2006
1/1/2009
1/1/2012
1/1/2015
1/1/2018
Nigerian Historical Debt ($USD), 1970-2019
0
5
10
15
20
25
30
35
40
1999
2000
2001
2002
2003
2004
2005
2006
2007
2008
2009
2010
2011
2012
2013
2014
2015
2016
2017
2018
2019
2020
2021
Nigerian Debt Structure - 1999 - 2021
Domestic Debt (N-trillion) External Debt ($ billion)
ISSN 2348-3156 (Print)
International Journal of Social Science and Humanities Research ISSN 2348-3164 (online)
Vol. 10, Issue 1, pp: (233-253), Month: January - March 2022, Available at: www.researchpublish.com
Page | 246
Research Publish Journals
With a current debt of N35.465 trillion as of June 30, 2021, or $93.5 billion, the country may be on the part to debt
unsustainability according to Director-General of the Debt Management Office unless there is swift turn to grow its
revenue base. (Ifeanyi, 2021). A breakdown of the total public debt showed that external debt was N13.711 trillion ($36.1
billion), representing 38.66 per cent, while domestic debt stood at N21.754 trillion ($57.3 billion), representing 61.34 per
cent of the total stock. A further breakdown indicates that the Federal Government accounted for N11. 828 trillion ($31.2
billion) of the external debt and N17. 632 trillion ($46.5 billion) of the domestic debt. States and the FCT‘s external debt
stood at N1.883 trillion, with a domestic debt stock of N4.122 trillion. A breakdown of source of the external debt showed
that the bulk of the debt is owed to multilaterals (World Bank Group and the African Development Bank Group), which
accounted for 54.88 per cent, while commercial debt (Eurobonds and Diaspora bonds) accounted for 31.88 per cent.
Bilateral debts (China, France, Japan, India and Germany) make up for 12. 70 per cent, while Promissory Notes represent
0. 54 per cent. (Ujah, 2021). Despite these debt volume, the senate continued to approve a set of three different loan
requests by President Muhammadu Buhari in July, 2021, totaling N 2.343 trillion, which is approximately $6 billion
and another $8.3 billion and €490 million. (Ojekunle, 2021). The Senate again in November 2021 approved additional
$16 billion, €1 billion and a grant of $125 million as foreign loans for President Muhammadu Buhari to fund his
administration‘s legacy projects. They specifically approved the issuance of €500 million from the Bank of Industries and
€750 million Eurobond in the International Capital Market, and only asked the President to forward the terms and
conditions of the loans from the funding agencies to the National Assembly. According to the senate committee on local
and foreign debts, the projects, which funds are requested for in the 2018-2020 borrowing plan, are ongoing. They
affirmed that the projects would stimulate a rebirth of commercial and engineering activities and the consequent tax
revenues payable to government as a result of these productive activities will increase. (Iyatse et al 2021).
According to Babalola, 2021, the ballooning debt stock is attributable to the decades of misrule and financial imprudence
of its military and political leaders. This view had earlier been expanded by President Olusegun Obasanjo in his remarks
on the debt stock, who identified such factors as political rascality, bad governance, abuse of office and power, criminal
corruption, mismanagement and waste, misplaced priorities, fiscal indiscipline, weak control, monitoring and evaluation
mechanisms, and a community that was openly tolerant of corruption and other underhand and extra-legal methods of
primitive accumulation, as being responsible for the Nigerian debt crisis. A case in point is the recent loan approved by
the senate in November 2021, where some Senators raised eyebrow over the absence of terms and conditions attached to
the loan request. The Deputy Senate President, Ovie Omo-Agege, expressed concern over the issue, as some members
were side blinded over the terms and conditions attached to the loans. He stated that the senators went through the terms
but noted that they were written in Chinese language, something that was also privy to the Budget Office, but regardless,
the loans were approved by the senate. (Iyatse etal, 2021). It has also been observed that the government clearly rebuffed
the Fiscal Responsibility Act, and the CBN Act 2007, as it exceeded the fiscal borrowing threshold as stipulated in the
fiscal act, which according to the Finance, Budget and Planning Minister was due to the COVID-19 pandemic. The fiscal
responsibility Act provided for 25% as the government‘s borrowing limit as a percent of GDP, but this was exceeded in
2020 at 34.8 %. Also, in 2020, the country recorded a budget deficit of about 4% of GDP, which also exceeded the 3%
threshold in the fiscal responsibility Act. On overdraft, section 38, sub-section 1 and 2, of the CBN Act, provided that
government shall not at any time exceed 5 percent of the previous year‘s actual revenue of the Federal Government in
over draft, but again, by the end of 2020, CBN overdrafts to the government exceeded the limit by 69 percent of the
revenue generated in 2019: the government‘s revenue in the year was N4.1 trillion, and overdraft stood at N2.9 trillion. In
order to create more room for borrowing, earlier this year, the federal executive council (FEC) had strategically raised the
borrowing limit to 40 percent in its Medium-term debt management strategy for Nigeria for the period 2020-
2023. (Ojekunle, 2021).
5. IMPLICATIONS OF NIGERIA’S HIGH DEBT PROFILE
Already, the World Bank, has ranked Nigeria among the top 10 countries with the highest debt risk exposure, sitting in the
fifth position with $11.7 billion debt exposure, behind India ($22 billion), Bangladesh ($18.1 billion), Pakistan ($16.4
billion), and Vietnam ($14.1 billion). The huge debt and low revenue base are impacting negatively on Nigeria‘s
sustainability as debt service obligations gulped 97 per cent of the country‘s total revenue in 2020. In the meantime,
another N3.3 trillion has been set aside for debt servicing in the assented 2021 budget, which is about a quarter (24.3 per
cent) of the entire N13.6 trillion total expenditure. Though the debt to GDP is at 33%, and still within sustainable level,
ISSN 2348-3156 (Print)
International Journal of Social Science and Humanities Research ISSN 2348-3164 (online)
Vol. 10, Issue 1, pp: (233-253), Month: January - March 2022, Available at: www.researchpublish.com
Page | 247
Research Publish Journals
the major problem is the low revenue base. According to IMF debt sustainability framework, the debt becomes
unsustainable when debt to GDP crosses the 40% threshold, and at the pace of borrowing, Nigeria debt will soon cross
this sustainability threshold. (Yusuf, 2021). Also, Nigeria‘s 2022 record budget of 16.39 trillion naira ($39.8 billion)
already has an inbuilt deficit of 6.26 trillion naira, or 3.39% of GDP which is expected to be funded by new borrowing,
proceeds from privatizations and drawdowns on loans secured for specific projects. (Reuter, 2021). The implication of the
growing debt service is that the government is expending nearly all its revenue in servicing recurrent expenditure and
debts, with very little or any development, which ofcourse pushes the Federal Government to resort to more foreign loans
which will continuously increase the nation‘s external debt profile. According to Wilson Erumebor, a senior economist at
Nigerian Economic Summit Group, Nigeria is confronted with rising expenditure with relatively small growth in revenue
thus always experiencing a wide fiscal deficit that will still be financed by borrowing. Wilson Erumebor estimated that
Nigeria‘s total debt could be as high as N48.7 trillion when AMCON‘s liabilities and CBN‘s ways and means are factored
into the total debt. (Ojekunle, 2021).
As a consequence of it high debt stock and debt service ratio, the country is already experiencing financial and currency
crises seen in the perpetual deteriorating dollar-naira exchange rate. Nigerian exchange rate was N0.7 or 70 kobo to a One
US dollar in 1971 and became N22 to a dollar at the turn of the current democratic transition in 1999. By 2015, when
President Buhari came in, it was exchanging at N197.87 to the dollar. The Dollar is presently exchanging for N430 in
2021 at the official platform, while it is exchanging for between N530-N 550 at the parallel market as of November 2021.
The central bank has devalued the currency three times since March 2020 after lower oil prices put pressure on dollar
reserves and prompted the regulator to ration foreign exchange. There‘s been no official announcement about plans for a
fourth devaluation although the bank is selling dollars at less than the official rate, signaling that it would prefer a weaker
currency. According to Osae-Brown and Onu,, 2017, the consistency of the interventions at the 444 naira-per-dollar levels
likely indicates that this is a preferred level if the CBN decides to devalue the naira,‖ Lagos-based Chapel Hill Denham
said in a note to clients Monday. The Central Bank of Nigeria has been selling the US dollar at 444 naira per dollar to
investors for almost three weeks, while the official spot rate is about 415 naira to the greenback, according to
traders. (Osae-Brown and Onu, 2021). As the government spends most of its revenue on debt servicing, very little is left
for development purposes, which is evident in the rather slow economic development as proxied as HDI in figure 9.
Figure 9: HDI comparison between Ghana and Nigeria from 1990 – 2019. Source: Country Economy/HDI
Figure 9 showed that Ghana moved its economy from low HDI to Medium HDI between 1999 and 2019, while Nigeria
remained as low HDI country despite the ballooning debts by government to develop the economy and the wellbeing of
its citizens. As a matter of fact, Nigeria dropped three spots to 161 in 2019 from 158 in 2018 among 189 countries in the
2020 Human Development Index (HDI).
0
0.1
0.2
0.3
0.4
0.5
0.6
0.7
1990 1992 1994 1996 1998 2000 2002 2004 2006 2008 2010 2012 2014 2016 2018
HDI Comparison between Ghana and Nigeria
Ghana Nigeria
Nigeria
ISSN 2348-3156 (Print)
International Journal of Social Science and Humanities Research ISSN 2348-3164 (online)
Vol. 10, Issue 1, pp: (233-253), Month: January - March 2022, Available at: www.researchpublish.com
Page | 248
Research Publish Journals
Another fallout of the high debt stock is the increasing unemployment rate as shown in figure 10.
Figure 10. Nigeria historical unemployment Rate.
The unemployment rate of 33.3% indicates that one in three of the 69.7 million-strong labor force in Nigeria either did
nothing or worked for less than 20 hours a week, making them unemployed, according to the Nigerian definition of
unemployment. Another 15.9 million worked less than 40 hours a week, making them underemployed. (Ajiboye, 2021).
Figure 11 shows the inflation trend with current inflation of 15%
Figure 11. Nigeria inflation trend.
As shown in figure 11, inflation was in single digits in 2014 through 2015, compared to its current value of 17.75% in
2021. This high inflation has driven more Nigerians into poverty as according to the World Bank, seven million
Nigerians have been driven into poverty due to the 22% increase in the price of food, and food prices contribute about
60% to the current inflation rate. The rising food prices exacerbated the present poverty as it reduces the real purchasing
power of households and shifts expenditures away from essential items such as health, education and housing. Onyeiwu,
2021 asserted that the average Nigerian household spends about 56% of income on food, the highest in the world, whereas
countries like US, UK, Canada, and Australia spend 6.4%, 8.2%, 9.1%, and 9.8%. Nigeria‘s high expenditure on food
implies that a slight increase in food prices would push more people into multidimensional poverty. Multidimensional
poverty measures poverty by income, and by the access people have to health, education and living standard indicators,
ISSN 2348-3156 (Print)
International Journal of Social Science and Humanities Research ISSN 2348-3164 (online)
Vol. 10, Issue 1, pp: (233-253), Month: January - March 2022, Available at: www.researchpublish.com
Page | 249
Research Publish Journals
which include sanitation, drinking water, electricity, and housing. By this measure, World Bank estimates that 47.3%
Nigerians, or 98 million people, live in multidimensional poverty, most of which are located in northern Nigeria. This
poverty rate does not include Borno State, where insurgency has prevented data collection. If the World Bank‘s income
poverty threshold of $3.20 per day is used, Nigeria‘s poverty rate is 71% or about 147 million poor people. This compared
unfavorably to lower rates for some oil-producing developing countries like Brazil (9.1%), Mexico (6.5%), Ecuador
(9.7%) and Iran (3.1%). (Onyeiwu, 2021). The depreciation in the value of the Naira has also resulted in steep increases in
the prices of imported food items, such as rice, sugar, milk, beverages, and frozen food, (Ajiboye, 2021).
6. STRATEGIES AND POLICY DIRECTIONS FOR MANAGING NIGERIA’S RISING DEBT
PROFILE
The increasing debt profile, and the unrelentless tendencies of the Nigerian government to borrow has been a source of
concerns to economists and other economic stakeholders both locally and at the international platforms. This section thus
presents some measures at handling the debt problems.
(i) The World Bank in its November 2021 Nigeria Development Update made some policy recommendations for the
President Buhari administration to help in mitigating its rising debt problems. According to the World Bank, if the
current debt accumulation levels are maintained, the country‘s debt-to-GDP ratio will hit the 40 percent threshold by
2025. It also reported that Nigeria has the worst revenue-to-GDP ratio among 115 countries, including Haiti.
Therefore, as a policy shift towards managing its high debt stock, the World Bank recommended that the country
completely removes fuel subsidy in 2022, since the subsidy only benefits the rich and not the poor. The Bank asserted
that PMS subsidies, are regressive because PMS is used primarily in light- and medium-duty motor vehicles, which
are rarely owned by the poor. Raising PMS prices tends to have minimal adverse effects on poor households;
therefore, governments worldwide have typically prioritized eliminating PMS subsidies over those that apply to other
fuels. It reported that Nigeria is the only country in the world with a universal price subsidy that applies exclusively
to PMS. Universal price subsidies for liquid fuels are almost always regressive, as the rich consume far more fuel
than the poor. (Tijani, 2021).
The World Bank also recommended that the government taxes what it called ―Sin Goods‖ such as cigarette, alcohol,
sugary drinks to increase its revenue base. It also strongly recommended that the President Buhari Administration
cuts back on its request for overdrafts from the CBN through the Ways and Means financing system and asked the
Federal Government to keep overdrafts to levels stipulated by law. Finally, the Bank advised the government to
reduce delays in border and port clearance by simplifying and harmonizing documents, streamlining, automating
procedures, and introducing risk-based customs interventions.‖ It also strongly recommended that the government
opens all boarders for trade (Tijani, 2021). Reacting to the World Bank recommendation on fuel subsidy, the Federal
Government through the GMD, NNPC confirmed that fuel subsidy will be removed by end February 2022 and a liter
of Petrol might sell between N320-340 by end of February 2022.
(ii) In addition to the World Bank‘s recommendation, Griffiths, 2019, proffered additional steps in managing the debts of
developing economies through careful selection of the opportunities, costs and risks of different sources of
borrowing. Griffiths 2019 observed that many low-income economies lack strong capacity for debt management
mainly due to their lack of demand, accountability and political commitment. He also recommended that lenders play
a key role in improving the borrowing options available to low-income countries, which will require creditors to offer
State Contingent Debt Instruments (SCDIs) that could pause repayments for borrower facing repayment difficulties.
Griffiths, 2019 also recommended flexible debt contracts that allows for easier restructuring of debt and endorse
better contractual terms and conditions. Such contracts could contain ‗standstills‘ clauses where repayments are
halted during difficult periods or supporting mediation and arbitration mechanisms. He also emphasized the need for
increased accountability and debt transparency at the country level, so that domestic citizens and parliaments can
provide incentives for governments to improve debt contraction, use, and management. This will require the setting
up of a public debt register that can be accessed easily by all stakeholders, including multilateral actors and private
sector creditors. This level of public disclosure of lending contracts, according to Griffiths, 2019, would allow
parliaments, journalists, and civil society organizations to serve as watch dog to the executive arm of government.
(iii) Hakura, 2020 also suggested other ways of mobilizing financing, such as by raising domestic revenue, improving the
efficiency of spending, reducing corruption, and improving the business environment. While She recognized that
ISSN 2348-3156 (Print)
International Journal of Social Science and Humanities Research ISSN 2348-3164 (online)
Vol. 10, Issue 1, pp: (233-253), Month: January - March 2022, Available at: www.researchpublish.com
Page | 250
Research Publish Journals
these steps may take some time to materialize, Hakura, 2020 recommended that countries should be prepared to keep
debt sustainable and ensure that it does not jeopardize growth and stability, as unsustainable debts can lead to debt
distress, and defaults in debt settlement. Defaults can cause borrowing countries to lose market access and suffer
higher borrowing costs, in addition to harming growth and investment. As a way forward, she proffered three key
policy steps for countries that are considering fresh debts (i) new borrowing should be consistent with fiscal spending
and deficit plans, and such new borrowing must guarantee debt sustainability. (ii) Countries must evaluate the
returns from investing the borrowed fund to the overall cost of accumulating debt. Debt that finances productive
social and infrastructure spending can lead to higher income that may ultimately offset the cost of debt service and
help balance the risks to debt sustainability (iii) There must be transparent debt reporting and debt statistics in the
context of comprehensive medium-term debt management strategies. Debt statistics should include coverage of
public and publicly guaranteed debt that is as broad as possible, including debt of state-owned enterprises. Sharing
this data with lenders can encourage responsible lending.
(iv) In addition to the views of Griffiths, 2019, and Hakura, 2020, Teriba, 2021 recommended that Nigeria aggressively
restructures its debt portfolio by replacing interest-paying commercial bonds with interest-free commercial bonds on
a wholesale basis to drastically reduce or eliminate the N4.9 trillion annual average interest payments that is projected
in the 2022-2024 MTEF. He stated that this has become the trend in the global debt market as Malaysia, Saudi
Arabia, and about six other governments, mostly from oil-producing countries, successfully issued interest-free
commercial bonds to replace interest-paying ones; corporate bonds were 38 percent; supranational bonds were 10
percent. Teriba, 2021 also recommended a shift to asset-linked debts instruments, as assets can easily be converted
for equity-securitization at home or abroad, similar to what Saudi Arabia, did with ARAMCO, in initially issuing IPO
at home before seeking Sukuk globally. He stressed that asset-linked securitization converts dead, idle, and
underutilized public corporate, infrastructure, physical, and intangible assets into liquid cash flow without the burden
of interest payments through the budget. The advantage of this, is that commercial investors are willing to wait for
profits or rent since most of such securities have investment-grade ratings by foremost agencies.
(v) Finally, one of the core solutions to reducing debt is for the government to cut down its costs of running the
government. Nigeria runs one of the most expensive government structures globally, spending more than 70% of its
budget on recurrent expenditure and less than 30% on Capital expenditure. Most of the recurrent expenditure funds
the legislatures and the executive arms of government, with 109 senators on an average remuneration of $450,000 per
annum, with a total senate staff of 829 aides besides retinue of support staff also paid by the National Assembly. The
House of Representatives consists of 360 members with annual remuneration of $398,000 per member, and this also
besides their 1,880 aides and retinue of support staff, all in the payroll of the National assembly. When compared
with the United States, with a population of about 330 million spread across 50 states, and a GDP in excess of $22
trillion, the US has 435 house of representative members and 100 senators, with each member of both houses
receiving the same $174,000 per annum. In terms of GDP per capita, the USA has $66,144, while Nigeria has $2,209,
yet Nigeria pays her legislatures far more than the USA. The Presidency also gulps a large chunk of the annual
revenue through retinue of aides, ranging from Special Advisers to Senior Special Assistants to Special Assistants to
both the President, Vice President, and other senior government officials. This is outside of the current 43 ministries
each with their with its retinue of aides and special assistants. Surprisingly, the US and other leading democracies
across the world, run leaner governments: the US has 15 Secretaries (Ministers) as members of Cabinet for its 50
States, while the United Kingdom has just 21 ministers, who are also members of Parliament, House of Lords and
House of Commons. India, with a population of about 1.4 billion people, has only 19 ministers in her cabinet and
presided over by the Prime Minister, while Germany has 15 cabinet ministers. Finally, Ghana‘s constitution allows
for a minimum of 10 cabinet ministers and a maximum of 19. (Otti, 2021). The Federal Government confirmed
through the Minister of Labour and Employment, Mr Chris Ngige that the federal government under President
Muhammadu Buhari borrows funds from international sources to pay salaries of workers because of a shortfall in the
country‘s revenue. (Olowookere, 2021).
As one of the strategies of managing the increasing debt burden, the Federal Government has recently initiated the process
of implementing the Report of the Committee on the Restructuring and Rationalization of Federal Government
Parastatals, Commissions and Agencies, chaired by Stephen Oronsaye. The Committee, which was constituted August 18,
2011, and submitted its report on April 16, 2014. The report recommended that of the 541 Statutory and Non-Statutory
ISSN 2348-3156 (Print)
International Journal of Social Science and Humanities Research ISSN 2348-3164 (online)
Vol. 10, Issue 1, pp: (233-253), Month: January - March 2022, Available at: www.researchpublish.com
Page | 251
Research Publish Journals
Federal Government Parastatals, Agencies and Commissions, 263 statutory agencies should be reduced to 161, 38
agencies should be abolished, 52 agencies should be merged, and 14 should revert back to Departments in Ministries.
(Idoko, 2021). Following the recommendations of the Oronsaye Report, Otti, 2021 also recommended that the Presidency
be cut down by about 40%, and this has to be across board including the Presidential fleet, There has also been calls for
the reduction of the members of the national assembly to a manageable size to reduce the overall cost of governance.
7. CONCLUSIONS AND RECOMMENDATIONS
Public debts if secured and managed sustainably have been shown to boost economic growth and development, especially
for developing economies. Unfortunately, Nigeria‘s increasing debt profile, has not been managed efficiently and
transparently to produce the desired economic benefits, but rather, as noted in this paper, the country may be treading
towards the threshold of debt unsustainability at debt to GDP ratio of 40%. The country uses more than 90% of its
revenue to service its debts, which, the paper noted has pushed the country into debt distress, macroeconomic challenges-
financial and currency crises, high unemployment, and extreme poverty of nearly 50% of the total population. The paper
thus proffered strategic policy recommendations, such as reducing cost of government, switching to interest free debt
instruments, and asset-linked securitization; removal of fuel subsidies, and finally ensure transparent and ensuring public,
parliamentary and creditors‘ scrutiny of the public debts.
REFERENCES
[1] Abula, M. and Ben, D. M. (2016). The impact of public debt on economic development of Nigeria. Asian Research
Journal of Arts & Social Sciences, 1(1): 1-16.
[2] Adenuga, A (2021): World Bank demands debt transparency, says Nigeria, others need $429bn
https://punchng.com/wbank-demands-debt-transparency-says-nigeria-others-need-429bn/
[3] Ajiboye, A (2021): Inflation targeting in Nigeria, https://mixtafrica.com/inflation-targeting-in-nigeria/
[4] Alejandro, D. J., & Ileana, R. J. (2017). The impact of government debt on economic growth: An overview for Latin
America. Department of Economics, University of Perugia (IT), Working Paper, 28, 1-11
[5] Asabe Shehu Yar‘adua Foundation (2020): A Case Study of the problematic nature of development plan in Nigeria.
[6] Ayadi, F.S and Ayadi, F.O (2008). The Impact of External Debt on Economic Growth: A Comparative Study of
Nigeria and South Africa, Journal of Sustainable Development in Africa, Vol. 10, No.3, 234-264.
[7] Babalola, A.A (2021): Nigeria‘s high debt profile: Payroll not the only cause
https://www.vanguardngr.com/2021/10/nigerias-high-debt-profile-payroll-not-the-only-cause/ Aare Afe Babalola,
[8] Dhara Ranasinghe, D (2021): Global debt is fast approaching record $300 trillion – IIF
https://www.reuters.com/business/global-debt-is-fast-approaching-record-300-trillion-iif-2021-09-14/
[9] Eke, C. K., Akunjuobi, N.E (2021): Public Debt and Economic Growth in Nigeria: An Empirical Investigation,
International Journal of Development and Management Review (INJODEMAR) Vol. 16, No. 1
[10] Ekundayo, W.J (2015): National Development in Nigeria and the indispensable lessons for Nigeria to learn from the
Asian Tigers, Journal Of Good Governance And Sustainable Development In Africa (Jggsda), Vol. 2, No 4.
[11] Elom-Obed, O.F., Odo, S. I., Elom, O. O., & Anoke, C. I. (2017). Public debt and economic growth in Nigeria.
Asian Research Journal of Arts & Social Sciences, 4 (3): 1-16.
[12] Gbadamosi, A (2021): Understanding the developed and developing country taxonomy.
(https://www.a4id.org/policy/understanding-the-developeddeveloping-country-taxonomy/
[13] Górniewicz, G (2009): The Problem of External Debt Of Developing Countries (The Case Of North Africa) Les
Cahiers du CREAD n°87 /2009
[14] Griffiths, J (2019): Solving the low-income country debt crisis: four solutions https://odi.org/en/insights/solving-the-
low-income-country-debt-crisis-four-solutions/
ISSN 2348-3156 (Print)
International Journal of Social Science and Humanities Research ISSN 2348-3164 (online)
Vol. 10, Issue 1, pp: (233-253), Month: January - March 2022, Available at: www.researchpublish.com
Page | 252
Research Publish Journals
[15] Hakura, D (2020): What is debt sustainability. https://www.imf.org/external/pubs/ft/fandd/2020/09/what-is-debt-
sustainability-basics.htm
[16] Hamadeh, N., Van Rompaey, C and Metreu, E (2021): New World Bank country classifications by income level:
2021-2022,https://blogs.worldbank.org/opendata/new-world-bank-country-classifications-income-level-2021-2022
[17] Idoko, C (2021): FG Set To Scrap, Merge Agencies, Inaugurates Committee On Implementation Of Oronsaye
Report. https://tribuneonlineng.com/fg-set-to-scrap-merge-agencies-inaugurates-committee-on-implementation-of-
oronsaye-report/
[18] IMF (2021): Economic Projection: Global Activity Indicators, https://www.imf.org/en/Publications/WEO/Issues/
2021/ 10/12/world-economic-outlook-october-2021
[19] IMF, (2021): World Economic Outlook, Recovery during a Pandemic
[20] Isaac, S., and Rosa, G. (2016). Public debt, public investment and economic growth in Mexico, International
Journal of Financial Studies, 4(6): 1-14.
[21] Iyatse, G., Abuh, A and Daka, T (2021): Senate okays Buhari‘s $16b, €1b, $125m loan request without terms.
https://guardian.ng/news/senate-okays-buharis-16b-e1b-125m-loan-request-without-terms/
[22] Karagol, E. (2002). The Causality Analysis of External Debt Service and GNP: The Case of Turkey, Central Bank
Review, 2(1), 39-64.
[23] Kose, M, A., Ohnsorege, F and Sugawara, N (2020): Benefits and Costs of Debt the dose makes the poison. Policy
Research Working Paper 9166, World Bank Group, Prospects Group February 2020
[24] Lucky, E. U., & Godday, O. O. (2017). The Nigeria debt structure and its effects on economic performance.
International Journal of Business and Management Review, 5 (10): 79-88.
[25] Malik, S., Hayat, M.K. & Hayat, M.U (2010). External Debt and Economic Growth: Empirical Evidence from
Pakistan‖, International Research Journal of Finance and Economics, ISSN 1450-2887, Issue 44, 88-97.
[26] Nielsen L (2011): Classification of Countries based on their level of development: How it is done and How it could be done.
IMF Working Paper, Strategy, Policy and Review Department.
[27] Nur,H.R., Shafinar, S., and Abdul, R. R. (2019). How does public debt affect economic growth? A systemic review,
Cogent Business and Management, 6(170133): 1-16
[28] Ojekunle, A (2021): From Obasanjo to Buhari… how FG‘s debt profile surged 658% to N26.9trn in 21 years,
https://www.thecable.ng/from-obasanjo-to-buhari-how-fgs-debt-profile-surged-658-to-n26-9trn-in-21-years
[29] Olowookere, D (2021): Ngige Confirms FG Borrows from World Bank, Others to Pay Salaries,
https://businesspost.ng/economy/ngige-confirms-fg-borrows-from-world-bank-others-to-pay-salaries/
[30] Onyeiwu, S (2021): Nigeria‘s poverty profile is grim. It‘s time to move beyond handouts.
https://theconversation.com/nigerias-poverty-profile-is-grim-its-time-to-move-beyond-handouts-163302
[31] Osae-Brown, A and Onu, E (2021): Nigeria Signals Preference for Weaker Naira Exchange Rate,
https://www.bloomberg.com/news/articles/2021-11-23/nigeria-signals-preference-for-weaker-naira-exchange-rate
[32] Otokiti S (2004): International Business, Pumark Nigeria Limited, First Edition
[33] Otti, A (2021): Cost of running government in Nigeria unsustainable
[34] https://www.vanguardngr.com/2021/03/cost-of-running-government-in-nigeria-unsustainable-alex-otti/
[35] Rapley J (2007): Understanding Development- Theory and Practice in the Third World, Third Edition, Lynne
Rienner Publishers
[36] Senibi,V., Oduntan,E., Uzoma,O., Senibi,E and Oluwaseun, A (2016): Public Debt and External Reserve: The
Nigerian Experience (1981–2013), , Hindawi Publishing Corporation Economics Research International Volume
2016, Article ID 1957017, 7 pages http://dx.doi.org/10.1155/2016/1957017
ISSN 2348-3156 (Print)
International Journal of Social Science and Humanities Research ISSN 2348-3164 (online)
Vol. 10, Issue 1, pp: (233-253), Month: January - March 2022, Available at: www.researchpublish.com
Page | 253
Research Publish Journals
[37] Smith, L (2021): How Governments Reduce the National Debt, https://www.investopedia.com/articles/economics/
11/successful-ways-government-reduces-debt.asp, pdated
[38] Soludo, C.C. (2003). Debt Poverty and Inequality in Okonjo Iweala, Soludo, and Muntar (Eds), The Debt Trap in
Nigeria, Africa World Press NJ, pp. 23-74.
[39] Sulaiman, L.A and Azeez, B.A (2012): Effect of External Debt on Economic Growth of Nigeria, Journal of
Economics and Sustainable Development www.iiste.org ISSN 2222-1700 (Paper) ISSN 2222-2855 (Online) Vol.3,
No.8,
[40] World Economic Situation and Prospect (2014): Country Classification
[41] Teriba, A (2021): Finding a way out of Nigeria‘s high debt costs, https://www.vanguardngr.com/2021/09/finding-a-
way-out-of-nigerias-high-debt-costs/
[42] Tijani, M (2021): Kill subsidy, cut CBN loans, raise ‗sin‘ taxes… 7 things World Bank wants Buhari to do in 2022
[43] The Economic Times (2021): Definition of 'Human Development Index, (The Economics Times.
http://economictimes.indiatimes.com/definition/human-development-index).
[44] UNCTAD (2021): Developing country external debt: From growing sustainability concerns to potential crisis in the
time of COVID-19, https://sdgpulse.unctad.org/debt-sustainability/
[45] Ujah, E (2021): Nigeria owing N35.5trn, local debt stands at N21 trillion
https://www.vanguardngr.com/2021/09/nigeria-owing-n35-5trn-local-debt-stands-at-n21-trillion/
[46] World Population Review (2021): HDI by Country. (https://worldpopulationreview.com/country-rankings/hdi-by-
country).
[47] World Bank (2021): Global Economic Prospects, 2021, World Bank Group Flagship Report
[48] https://databank.worldbank.org/metadataglossary/world-development-indicators/series/GC.DOD.TOTL.GD.ZS
[49] World Bank (2021): Report: Debt Transparency in Developing Economies
https://www.worldbank.org/en/topic/debt/publication/report-debt-transparency-in-developing-economies,
[50] https://www.macrotrends.net/countries/NGA/nigeria/external-debt-stock
[51] Yusuf, K (2021): Inside Nigeria‘s Debt Crisis: Howforeign loan under Buhari triples past govts‘combined figure
[52] https://www.premiumtimesng.com/news/headlines/489041-inside-nigerias-debt-crisis-how-foreign-loan-under-
buhari-triples-past-govts-combined-figure.html
[53] https://countryeconomy.com/hdi/ghana, https://countryeconomy.com/hdi/nigeria
[54] https://www.macrotrends.net/countries/NGA/nigeria/unemployment-rate
[55] https://www.thecable.ng/kill-subsidy-cut-cbn-loans-raise-sin-taxes-7-things-world-bank-wants-buhari-to-do-in-
2022,

More Related Content

Similar to THE ECONOMIC IMPLICATIONS OF HIGH DEBTS PROFILE TO A DEVELOPING NATION: EMPHASIS ON NIGERIA

UN World Economic Situation and Prospects 2014
UN   World Economic Situation and Prospects 2014UN   World Economic Situation and Prospects 2014
UN World Economic Situation and Prospects 2014asafeiran
 
Unit 11. socioeconomic inequalities
Unit 11. socioeconomic inequalitiesUnit 11. socioeconomic inequalities
Unit 11. socioeconomic inequalitiesmmm-g
 
Unit 11. socioeconomic inequalities
Unit 11. socioeconomic inequalitiesUnit 11. socioeconomic inequalities
Unit 11. socioeconomic inequalitiesmmm-g
 
Five decades of development aid to nigeria the impact on human development
Five decades of development aid to nigeria the impact on human developmentFive decades of development aid to nigeria the impact on human development
Five decades of development aid to nigeria the impact on human developmentAlexander Decker
 
11.five decades of development aid to nigeria the impact on human development
11.five decades of development aid to nigeria the impact on human development11.five decades of development aid to nigeria the impact on human development
11.five decades of development aid to nigeria the impact on human developmentAlexander Decker
 
Rethinking development
Rethinking developmentRethinking development
Rethinking developmentP.L. Dhar
 
Rwanda Case Study
Rwanda Case StudyRwanda Case Study
Rwanda Case StudyMandy Cross
 
slide.pptx
slide.pptxslide.pptx
slide.pptxKhugo1
 
UNDERSTANDING ECONOMIC POVERTY AND EQUALITY.pptx
UNDERSTANDING ECONOMIC POVERTY AND EQUALITY.pptxUNDERSTANDING ECONOMIC POVERTY AND EQUALITY.pptx
UNDERSTANDING ECONOMIC POVERTY AND EQUALITY.pptxJAMESFRANCISGOSE
 
Measuring Financial Inclusion the Global Findex
Measuring Financial Inclusion the Global FindexMeasuring Financial Inclusion the Global Findex
Measuring Financial Inclusion the Global FindexDr Lendy Spires
 
THE LEAST DEVELOPED COUNTRIES REPORT 2018 AND MYANMAR
THE LEAST DEVELOPED COUNTRIES REPORT 2018 AND MYANMARTHE LEAST DEVELOPED COUNTRIES REPORT 2018 AND MYANMAR
THE LEAST DEVELOPED COUNTRIES REPORT 2018 AND MYANMARMYO AUNG Myanmar
 
Complete lecutures of e.o.p
Complete lecutures of e.o.pComplete lecutures of e.o.p
Complete lecutures of e.o.pFreya Ava
 
Arab Strategy Forum
Arab Strategy ForumArab Strategy Forum
Arab Strategy ForumSDGsPlus
 
IMF report on djibouti all sector 2012
IMF report on djibouti all sector 2012IMF report on djibouti all sector 2012
IMF report on djibouti all sector 2012Parti Djibouti
 
Rural industrialization
Rural industrializationRural industrialization
Rural industrializationP.L. Dhar
 
Economic growth and inequality.
Economic growth and inequality.Economic growth and inequality.
Economic growth and inequality.Kübra Bayram
 

Similar to THE ECONOMIC IMPLICATIONS OF HIGH DEBTS PROFILE TO A DEVELOPING NATION: EMPHASIS ON NIGERIA (20)

UN World Economic Situation and Prospects 2014
UN   World Economic Situation and Prospects 2014UN   World Economic Situation and Prospects 2014
UN World Economic Situation and Prospects 2014
 
Unit 11. socioeconomic inequalities
Unit 11. socioeconomic inequalitiesUnit 11. socioeconomic inequalities
Unit 11. socioeconomic inequalities
 
Unit 11. socioeconomic inequalities
Unit 11. socioeconomic inequalitiesUnit 11. socioeconomic inequalities
Unit 11. socioeconomic inequalities
 
Five decades of development aid to nigeria the impact on human development
Five decades of development aid to nigeria the impact on human developmentFive decades of development aid to nigeria the impact on human development
Five decades of development aid to nigeria the impact on human development
 
11.five decades of development aid to nigeria the impact on human development
11.five decades of development aid to nigeria the impact on human development11.five decades of development aid to nigeria the impact on human development
11.five decades of development aid to nigeria the impact on human development
 
Rethinking development
Rethinking developmentRethinking development
Rethinking development
 
Rwanda Case Study
Rwanda Case StudyRwanda Case Study
Rwanda Case Study
 
slide.pptx
slide.pptxslide.pptx
slide.pptx
 
UNDERSTANDING ECONOMIC POVERTY AND EQUALITY.pptx
UNDERSTANDING ECONOMIC POVERTY AND EQUALITY.pptxUNDERSTANDING ECONOMIC POVERTY AND EQUALITY.pptx
UNDERSTANDING ECONOMIC POVERTY AND EQUALITY.pptx
 
vicious circle of poverty
vicious circle of povertyvicious circle of poverty
vicious circle of poverty
 
Measuring Financial Inclusion the Global Findex
Measuring Financial Inclusion the Global FindexMeasuring Financial Inclusion the Global Findex
Measuring Financial Inclusion the Global Findex
 
THE LEAST DEVELOPED COUNTRIES REPORT 2018 AND MYANMAR
THE LEAST DEVELOPED COUNTRIES REPORT 2018 AND MYANMARTHE LEAST DEVELOPED COUNTRIES REPORT 2018 AND MYANMAR
THE LEAST DEVELOPED COUNTRIES REPORT 2018 AND MYANMAR
 
Complete lecutures of e.o.p
Complete lecutures of e.o.pComplete lecutures of e.o.p
Complete lecutures of e.o.p
 
Arab Strategy Forum
Arab Strategy ForumArab Strategy Forum
Arab Strategy Forum
 
IMF report on djibouti all sector 2012
IMF report on djibouti all sector 2012IMF report on djibouti all sector 2012
IMF report on djibouti all sector 2012
 
Rural industrialization
Rural industrializationRural industrialization
Rural industrialization
 
Financing for development final project
Financing for development final projectFinancing for development final project
Financing for development final project
 
Financing for development final project
Financing for development final projectFinancing for development final project
Financing for development final project
 
Economic growth and inequality.
Economic growth and inequality.Economic growth and inequality.
Economic growth and inequality.
 
Sub-Saharan Africa Economic Outlook
Sub-Saharan Africa Economic OutlookSub-Saharan Africa Economic Outlook
Sub-Saharan Africa Economic Outlook
 

More from Research Publish Journals (Publisher)

Differentiated Learning Exemplars for Students’ Academic Achievement in Engl...
Differentiated Learning Exemplars for  Students’ Academic Achievement in Engl...Differentiated Learning Exemplars for  Students’ Academic Achievement in Engl...
Differentiated Learning Exemplars for Students’ Academic Achievement in Engl...Research Publish Journals (Publisher)
 
Students’ Awareness of Cavite Agritourism: Basis for a Proposed Information ...
Students’ Awareness of Cavite Agritourism:  Basis for a Proposed Information ...Students’ Awareness of Cavite Agritourism:  Basis for a Proposed Information ...
Students’ Awareness of Cavite Agritourism: Basis for a Proposed Information ...Research Publish Journals (Publisher)
 
Combining the Best of Online and Face-to-Face Learning: Hybrid and Blended L...
Combining the Best of Online and Face-to-Face  Learning: Hybrid and Blended L...Combining the Best of Online and Face-to-Face  Learning: Hybrid and Blended L...
Combining the Best of Online and Face-to-Face Learning: Hybrid and Blended L...Research Publish Journals (Publisher)
 
Teachers’ Views on the Role of Non-verbal Communication in EFL Classrooms
Teachers’ Views on the Role of Non-verbal  Communication in EFL ClassroomsTeachers’ Views on the Role of Non-verbal  Communication in EFL Classrooms
Teachers’ Views on the Role of Non-verbal Communication in EFL ClassroomsResearch Publish Journals (Publisher)
 
An Inquiry on the Awareness of Education Students about the Issues and Trend...
An Inquiry on the Awareness of Education  Students about the Issues and Trend...An Inquiry on the Awareness of Education  Students about the Issues and Trend...
An Inquiry on the Awareness of Education Students about the Issues and Trend...Research Publish Journals (Publisher)
 
THE CHALLENGE OF USING BLENDED LEARNING IN THE TEACHING OF ENGLISH AS A FOR...
THE CHALLENGE OF USING BLENDED  LEARNING IN THE TEACHING OF  ENGLISH AS A FOR...THE CHALLENGE OF USING BLENDED  LEARNING IN THE TEACHING OF  ENGLISH AS A FOR...
THE CHALLENGE OF USING BLENDED LEARNING IN THE TEACHING OF ENGLISH AS A FOR...Research Publish Journals (Publisher)
 
DELEGATION OF DUTIES AS A PRINCIPALS’ MOTIVATIONAL PRACTICE ON TEACHER RETE...
DELEGATION OF DUTIES AS A  PRINCIPALS’ MOTIVATIONAL PRACTICE  ON TEACHER RETE...DELEGATION OF DUTIES AS A  PRINCIPALS’ MOTIVATIONAL PRACTICE  ON TEACHER RETE...
DELEGATION OF DUTIES AS A PRINCIPALS’ MOTIVATIONAL PRACTICE ON TEACHER RETE...Research Publish Journals (Publisher)
 
Impact of Covid-19 on Education: Challenges Faced By Students, Teachers and ...
Impact of Covid-19 on Education: Challenges  Faced By Students, Teachers and ...Impact of Covid-19 on Education: Challenges  Faced By Students, Teachers and ...
Impact of Covid-19 on Education: Challenges Faced By Students, Teachers and ...Research Publish Journals (Publisher)
 
The Potentials of Automated Feedback Systems for Instructors in Higher Educa...
The Potentials of Automated Feedback Systems  for Instructors in Higher Educa...The Potentials of Automated Feedback Systems  for Instructors in Higher Educa...
The Potentials of Automated Feedback Systems for Instructors in Higher Educa...Research Publish Journals (Publisher)
 
IMPACT OF COVID-19 PANDEMIC ON FILIPINO PASSENGERS’ CRUISE INTENTION
IMPACT OF COVID-19 PANDEMIC ON  FILIPINO PASSENGERS’ CRUISE  INTENTIONIMPACT OF COVID-19 PANDEMIC ON  FILIPINO PASSENGERS’ CRUISE  INTENTION
IMPACT OF COVID-19 PANDEMIC ON FILIPINO PASSENGERS’ CRUISE INTENTIONResearch Publish Journals (Publisher)
 
Effect of Sport Injuries on the Level of Confidence and Anxiety among Athlet...
Effect of Sport Injuries on the Level of  Confidence and Anxiety among Athlet...Effect of Sport Injuries on the Level of  Confidence and Anxiety among Athlet...
Effect of Sport Injuries on the Level of Confidence and Anxiety among Athlet...Research Publish Journals (Publisher)
 
THE IMPACT OF TRAINING AND DEVELOPMENT ON EMPLOYEES PERFORMANCE IN AN ORGAN...
THE IMPACT OF TRAINING AND  DEVELOPMENT ON EMPLOYEES  PERFORMANCE IN AN ORGAN...THE IMPACT OF TRAINING AND  DEVELOPMENT ON EMPLOYEES  PERFORMANCE IN AN ORGAN...
THE IMPACT OF TRAINING AND DEVELOPMENT ON EMPLOYEES PERFORMANCE IN AN ORGAN...Research Publish Journals (Publisher)
 
Impact of Schemes Designed for Women in Goa on their Self-Esteem and Psychol...
Impact of Schemes Designed for Women in Goa  on their Self-Esteem and Psychol...Impact of Schemes Designed for Women in Goa  on their Self-Esteem and Psychol...
Impact of Schemes Designed for Women in Goa on their Self-Esteem and Psychol...Research Publish Journals (Publisher)
 
A comparative study between the new and old university laws in Saudi Arabia
A comparative study between the new and old  university laws in Saudi ArabiaA comparative study between the new and old  university laws in Saudi Arabia
A comparative study between the new and old university laws in Saudi ArabiaResearch Publish Journals (Publisher)
 
Teachers’ Level of Knowledge and Attitude, Stressors and Coping Mechanisms I...
Teachers’ Level of Knowledge and Attitude,  Stressors and Coping Mechanisms I...Teachers’ Level of Knowledge and Attitude,  Stressors and Coping Mechanisms I...
Teachers’ Level of Knowledge and Attitude, Stressors and Coping Mechanisms I...Research Publish Journals (Publisher)
 
A Stereotypical Framework of Pressure, Trauma and Relief in Chitra Banerjee ...
A Stereotypical Framework of Pressure,  Trauma and Relief in Chitra Banerjee ...A Stereotypical Framework of Pressure,  Trauma and Relief in Chitra Banerjee ...
A Stereotypical Framework of Pressure, Trauma and Relief in Chitra Banerjee ...Research Publish Journals (Publisher)
 
Modular and Recorded Video Lessons in Teaching Music, Arts, Physical Educati...
Modular and Recorded Video Lessons in  Teaching Music, Arts, Physical Educati...Modular and Recorded Video Lessons in  Teaching Music, Arts, Physical Educati...
Modular and Recorded Video Lessons in Teaching Music, Arts, Physical Educati...Research Publish Journals (Publisher)
 
Impact of Workplace Bullying to Work Performance among Filipino Cruise Staff
Impact of Workplace Bullying to Work  Performance among Filipino Cruise StaffImpact of Workplace Bullying to Work  Performance among Filipino Cruise Staff
Impact of Workplace Bullying to Work Performance among Filipino Cruise StaffResearch Publish Journals (Publisher)
 

More from Research Publish Journals (Publisher) (20)

Differentiated Learning Exemplars for Students’ Academic Achievement in Engl...
Differentiated Learning Exemplars for  Students’ Academic Achievement in Engl...Differentiated Learning Exemplars for  Students’ Academic Achievement in Engl...
Differentiated Learning Exemplars for Students’ Academic Achievement in Engl...
 
Students’ Awareness of Cavite Agritourism: Basis for a Proposed Information ...
Students’ Awareness of Cavite Agritourism:  Basis for a Proposed Information ...Students’ Awareness of Cavite Agritourism:  Basis for a Proposed Information ...
Students’ Awareness of Cavite Agritourism: Basis for a Proposed Information ...
 
Combining the Best of Online and Face-to-Face Learning: Hybrid and Blended L...
Combining the Best of Online and Face-to-Face  Learning: Hybrid and Blended L...Combining the Best of Online and Face-to-Face  Learning: Hybrid and Blended L...
Combining the Best of Online and Face-to-Face Learning: Hybrid and Blended L...
 
The Impact of COVID-19 Crisis on Teaching and Learning English
The Impact of COVID-19 Crisis on Teaching  and Learning EnglishThe Impact of COVID-19 Crisis on Teaching  and Learning English
The Impact of COVID-19 Crisis on Teaching and Learning English
 
Teachers’ Views on the Role of Non-verbal Communication in EFL Classrooms
Teachers’ Views on the Role of Non-verbal  Communication in EFL ClassroomsTeachers’ Views on the Role of Non-verbal  Communication in EFL Classrooms
Teachers’ Views on the Role of Non-verbal Communication in EFL Classrooms
 
CRITICAL THINKING AND ONLINE LEARNING DURING THE PANDEMIC
CRITICAL THINKING AND ONLINE  LEARNING DURING THE PANDEMICCRITICAL THINKING AND ONLINE  LEARNING DURING THE PANDEMIC
CRITICAL THINKING AND ONLINE LEARNING DURING THE PANDEMIC
 
An Inquiry on the Awareness of Education Students about the Issues and Trend...
An Inquiry on the Awareness of Education  Students about the Issues and Trend...An Inquiry on the Awareness of Education  Students about the Issues and Trend...
An Inquiry on the Awareness of Education Students about the Issues and Trend...
 
THE CHALLENGE OF USING BLENDED LEARNING IN THE TEACHING OF ENGLISH AS A FOR...
THE CHALLENGE OF USING BLENDED  LEARNING IN THE TEACHING OF  ENGLISH AS A FOR...THE CHALLENGE OF USING BLENDED  LEARNING IN THE TEACHING OF  ENGLISH AS A FOR...
THE CHALLENGE OF USING BLENDED LEARNING IN THE TEACHING OF ENGLISH AS A FOR...
 
DELEGATION OF DUTIES AS A PRINCIPALS’ MOTIVATIONAL PRACTICE ON TEACHER RETE...
DELEGATION OF DUTIES AS A  PRINCIPALS’ MOTIVATIONAL PRACTICE  ON TEACHER RETE...DELEGATION OF DUTIES AS A  PRINCIPALS’ MOTIVATIONAL PRACTICE  ON TEACHER RETE...
DELEGATION OF DUTIES AS A PRINCIPALS’ MOTIVATIONAL PRACTICE ON TEACHER RETE...
 
Impact of Covid-19 on Education: Challenges Faced By Students, Teachers and ...
Impact of Covid-19 on Education: Challenges  Faced By Students, Teachers and ...Impact of Covid-19 on Education: Challenges  Faced By Students, Teachers and ...
Impact of Covid-19 on Education: Challenges Faced By Students, Teachers and ...
 
The Potentials of Automated Feedback Systems for Instructors in Higher Educa...
The Potentials of Automated Feedback Systems  for Instructors in Higher Educa...The Potentials of Automated Feedback Systems  for Instructors in Higher Educa...
The Potentials of Automated Feedback Systems for Instructors in Higher Educa...
 
IMPACT OF COVID-19 PANDEMIC ON FILIPINO PASSENGERS’ CRUISE INTENTION
IMPACT OF COVID-19 PANDEMIC ON  FILIPINO PASSENGERS’ CRUISE  INTENTIONIMPACT OF COVID-19 PANDEMIC ON  FILIPINO PASSENGERS’ CRUISE  INTENTION
IMPACT OF COVID-19 PANDEMIC ON FILIPINO PASSENGERS’ CRUISE INTENTION
 
Effect of Sport Injuries on the Level of Confidence and Anxiety among Athlet...
Effect of Sport Injuries on the Level of  Confidence and Anxiety among Athlet...Effect of Sport Injuries on the Level of  Confidence and Anxiety among Athlet...
Effect of Sport Injuries on the Level of Confidence and Anxiety among Athlet...
 
THE IMPACT OF TRAINING AND DEVELOPMENT ON EMPLOYEES PERFORMANCE IN AN ORGAN...
THE IMPACT OF TRAINING AND  DEVELOPMENT ON EMPLOYEES  PERFORMANCE IN AN ORGAN...THE IMPACT OF TRAINING AND  DEVELOPMENT ON EMPLOYEES  PERFORMANCE IN AN ORGAN...
THE IMPACT OF TRAINING AND DEVELOPMENT ON EMPLOYEES PERFORMANCE IN AN ORGAN...
 
Impact of Schemes Designed for Women in Goa on their Self-Esteem and Psychol...
Impact of Schemes Designed for Women in Goa  on their Self-Esteem and Psychol...Impact of Schemes Designed for Women in Goa  on their Self-Esteem and Psychol...
Impact of Schemes Designed for Women in Goa on their Self-Esteem and Psychol...
 
A comparative study between the new and old university laws in Saudi Arabia
A comparative study between the new and old  university laws in Saudi ArabiaA comparative study between the new and old  university laws in Saudi Arabia
A comparative study between the new and old university laws in Saudi Arabia
 
Teachers’ Level of Knowledge and Attitude, Stressors and Coping Mechanisms I...
Teachers’ Level of Knowledge and Attitude,  Stressors and Coping Mechanisms I...Teachers’ Level of Knowledge and Attitude,  Stressors and Coping Mechanisms I...
Teachers’ Level of Knowledge and Attitude, Stressors and Coping Mechanisms I...
 
A Stereotypical Framework of Pressure, Trauma and Relief in Chitra Banerjee ...
A Stereotypical Framework of Pressure,  Trauma and Relief in Chitra Banerjee ...A Stereotypical Framework of Pressure,  Trauma and Relief in Chitra Banerjee ...
A Stereotypical Framework of Pressure, Trauma and Relief in Chitra Banerjee ...
 
Modular and Recorded Video Lessons in Teaching Music, Arts, Physical Educati...
Modular and Recorded Video Lessons in  Teaching Music, Arts, Physical Educati...Modular and Recorded Video Lessons in  Teaching Music, Arts, Physical Educati...
Modular and Recorded Video Lessons in Teaching Music, Arts, Physical Educati...
 
Impact of Workplace Bullying to Work Performance among Filipino Cruise Staff
Impact of Workplace Bullying to Work  Performance among Filipino Cruise StaffImpact of Workplace Bullying to Work  Performance among Filipino Cruise Staff
Impact of Workplace Bullying to Work Performance among Filipino Cruise Staff
 

Recently uploaded

Call Girls In Yusuf Sarai Women Seeking Men 9654467111
Call Girls In Yusuf Sarai Women Seeking Men 9654467111Call Girls In Yusuf Sarai Women Seeking Men 9654467111
Call Girls In Yusuf Sarai Women Seeking Men 9654467111Sapana Sha
 
OAT_RI_Ep19 WeighingTheRisks_Apr24_TheYellowMetal.pptx
OAT_RI_Ep19 WeighingTheRisks_Apr24_TheYellowMetal.pptxOAT_RI_Ep19 WeighingTheRisks_Apr24_TheYellowMetal.pptx
OAT_RI_Ep19 WeighingTheRisks_Apr24_TheYellowMetal.pptxhiddenlevers
 
Call Girls Service Nagpur Maya Call 7001035870 Meet With Nagpur Escorts
Call Girls Service Nagpur Maya Call 7001035870 Meet With Nagpur EscortsCall Girls Service Nagpur Maya Call 7001035870 Meet With Nagpur Escorts
Call Girls Service Nagpur Maya Call 7001035870 Meet With Nagpur Escortsranjana rawat
 
Bladex Earnings Call Presentation 1Q2024
Bladex Earnings Call Presentation 1Q2024Bladex Earnings Call Presentation 1Q2024
Bladex Earnings Call Presentation 1Q2024Bladex
 
High Class Call Girls Nashik Maya 7001305949 Independent Escort Service Nashik
High Class Call Girls Nashik Maya 7001305949 Independent Escort Service NashikHigh Class Call Girls Nashik Maya 7001305949 Independent Escort Service Nashik
High Class Call Girls Nashik Maya 7001305949 Independent Escort Service NashikCall Girls in Nagpur High Profile
 
Interimreport1 January–31 March2024 Elo Mutual Pension Insurance Company
Interimreport1 January–31 March2024 Elo Mutual Pension Insurance CompanyInterimreport1 January–31 March2024 Elo Mutual Pension Insurance Company
Interimreport1 January–31 March2024 Elo Mutual Pension Insurance CompanyTyöeläkeyhtiö Elo
 
Monthly Market Risk Update: April 2024 [SlideShare]
Monthly Market Risk Update: April 2024 [SlideShare]Monthly Market Risk Update: April 2024 [SlideShare]
Monthly Market Risk Update: April 2024 [SlideShare]Commonwealth
 
VIP Call Girls LB Nagar ( Hyderabad ) Phone 8250192130 | ₹5k To 25k With Room...
VIP Call Girls LB Nagar ( Hyderabad ) Phone 8250192130 | ₹5k To 25k With Room...VIP Call Girls LB Nagar ( Hyderabad ) Phone 8250192130 | ₹5k To 25k With Room...
VIP Call Girls LB Nagar ( Hyderabad ) Phone 8250192130 | ₹5k To 25k With Room...Suhani Kapoor
 
Authentic No 1 Amil Baba In Pakistan Authentic No 1 Amil Baba In Karachi No 1...
Authentic No 1 Amil Baba In Pakistan Authentic No 1 Amil Baba In Karachi No 1...Authentic No 1 Amil Baba In Pakistan Authentic No 1 Amil Baba In Karachi No 1...
Authentic No 1 Amil Baba In Pakistan Authentic No 1 Amil Baba In Karachi No 1...First NO1 World Amil baba in Faisalabad
 
Instant Issue Debit Cards - School Designs
Instant Issue Debit Cards - School DesignsInstant Issue Debit Cards - School Designs
Instant Issue Debit Cards - School Designsegoetzinger
 
Attachment Of Assets......................
Attachment Of Assets......................Attachment Of Assets......................
Attachment Of Assets......................AmanBajaj36
 
The Triple Threat | Article on Global Resession | Harsh Kumar
The Triple Threat | Article on Global Resession | Harsh KumarThe Triple Threat | Article on Global Resession | Harsh Kumar
The Triple Threat | Article on Global Resession | Harsh KumarHarsh Kumar
 
fca-bsps-decision-letter-redacted (1).pdf
fca-bsps-decision-letter-redacted (1).pdffca-bsps-decision-letter-redacted (1).pdf
fca-bsps-decision-letter-redacted (1).pdfHenry Tapper
 
Quantitative Analysis of Retail Sector Companies
Quantitative Analysis of Retail Sector CompaniesQuantitative Analysis of Retail Sector Companies
Quantitative Analysis of Retail Sector Companiesprashantbhati354
 
(办理学位证)加拿大萨省大学毕业证成绩单原版一比一
(办理学位证)加拿大萨省大学毕业证成绩单原版一比一(办理学位证)加拿大萨省大学毕业证成绩单原版一比一
(办理学位证)加拿大萨省大学毕业证成绩单原版一比一S SDS
 
Stock Market Brief Deck for 4/24/24 .pdf
Stock Market Brief Deck for 4/24/24 .pdfStock Market Brief Deck for 4/24/24 .pdf
Stock Market Brief Deck for 4/24/24 .pdfMichael Silva
 
Malad Call Girl in Services 9892124323 | ₹,4500 With Room Free Delivery
Malad Call Girl in Services  9892124323 | ₹,4500 With Room Free DeliveryMalad Call Girl in Services  9892124323 | ₹,4500 With Room Free Delivery
Malad Call Girl in Services 9892124323 | ₹,4500 With Room Free DeliveryPooja Nehwal
 
government_intervention_in_business_ownership[1].pdf
government_intervention_in_business_ownership[1].pdfgovernment_intervention_in_business_ownership[1].pdf
government_intervention_in_business_ownership[1].pdfshaunmashale756
 
Classical Theory of Macroeconomics by Adam Smith
Classical Theory of Macroeconomics by Adam SmithClassical Theory of Macroeconomics by Adam Smith
Classical Theory of Macroeconomics by Adam SmithAdamYassin2
 

Recently uploaded (20)

Call Girls In Yusuf Sarai Women Seeking Men 9654467111
Call Girls In Yusuf Sarai Women Seeking Men 9654467111Call Girls In Yusuf Sarai Women Seeking Men 9654467111
Call Girls In Yusuf Sarai Women Seeking Men 9654467111
 
OAT_RI_Ep19 WeighingTheRisks_Apr24_TheYellowMetal.pptx
OAT_RI_Ep19 WeighingTheRisks_Apr24_TheYellowMetal.pptxOAT_RI_Ep19 WeighingTheRisks_Apr24_TheYellowMetal.pptx
OAT_RI_Ep19 WeighingTheRisks_Apr24_TheYellowMetal.pptx
 
Call Girls Service Nagpur Maya Call 7001035870 Meet With Nagpur Escorts
Call Girls Service Nagpur Maya Call 7001035870 Meet With Nagpur EscortsCall Girls Service Nagpur Maya Call 7001035870 Meet With Nagpur Escorts
Call Girls Service Nagpur Maya Call 7001035870 Meet With Nagpur Escorts
 
Bladex Earnings Call Presentation 1Q2024
Bladex Earnings Call Presentation 1Q2024Bladex Earnings Call Presentation 1Q2024
Bladex Earnings Call Presentation 1Q2024
 
High Class Call Girls Nashik Maya 7001305949 Independent Escort Service Nashik
High Class Call Girls Nashik Maya 7001305949 Independent Escort Service NashikHigh Class Call Girls Nashik Maya 7001305949 Independent Escort Service Nashik
High Class Call Girls Nashik Maya 7001305949 Independent Escort Service Nashik
 
Interimreport1 January–31 March2024 Elo Mutual Pension Insurance Company
Interimreport1 January–31 March2024 Elo Mutual Pension Insurance CompanyInterimreport1 January–31 March2024 Elo Mutual Pension Insurance Company
Interimreport1 January–31 March2024 Elo Mutual Pension Insurance Company
 
Monthly Market Risk Update: April 2024 [SlideShare]
Monthly Market Risk Update: April 2024 [SlideShare]Monthly Market Risk Update: April 2024 [SlideShare]
Monthly Market Risk Update: April 2024 [SlideShare]
 
VIP Call Girls LB Nagar ( Hyderabad ) Phone 8250192130 | ₹5k To 25k With Room...
VIP Call Girls LB Nagar ( Hyderabad ) Phone 8250192130 | ₹5k To 25k With Room...VIP Call Girls LB Nagar ( Hyderabad ) Phone 8250192130 | ₹5k To 25k With Room...
VIP Call Girls LB Nagar ( Hyderabad ) Phone 8250192130 | ₹5k To 25k With Room...
 
Authentic No 1 Amil Baba In Pakistan Authentic No 1 Amil Baba In Karachi No 1...
Authentic No 1 Amil Baba In Pakistan Authentic No 1 Amil Baba In Karachi No 1...Authentic No 1 Amil Baba In Pakistan Authentic No 1 Amil Baba In Karachi No 1...
Authentic No 1 Amil Baba In Pakistan Authentic No 1 Amil Baba In Karachi No 1...
 
Instant Issue Debit Cards - School Designs
Instant Issue Debit Cards - School DesignsInstant Issue Debit Cards - School Designs
Instant Issue Debit Cards - School Designs
 
Attachment Of Assets......................
Attachment Of Assets......................Attachment Of Assets......................
Attachment Of Assets......................
 
The Triple Threat | Article on Global Resession | Harsh Kumar
The Triple Threat | Article on Global Resession | Harsh KumarThe Triple Threat | Article on Global Resession | Harsh Kumar
The Triple Threat | Article on Global Resession | Harsh Kumar
 
fca-bsps-decision-letter-redacted (1).pdf
fca-bsps-decision-letter-redacted (1).pdffca-bsps-decision-letter-redacted (1).pdf
fca-bsps-decision-letter-redacted (1).pdf
 
Quantitative Analysis of Retail Sector Companies
Quantitative Analysis of Retail Sector CompaniesQuantitative Analysis of Retail Sector Companies
Quantitative Analysis of Retail Sector Companies
 
(办理学位证)加拿大萨省大学毕业证成绩单原版一比一
(办理学位证)加拿大萨省大学毕业证成绩单原版一比一(办理学位证)加拿大萨省大学毕业证成绩单原版一比一
(办理学位证)加拿大萨省大学毕业证成绩单原版一比一
 
Stock Market Brief Deck for 4/24/24 .pdf
Stock Market Brief Deck for 4/24/24 .pdfStock Market Brief Deck for 4/24/24 .pdf
Stock Market Brief Deck for 4/24/24 .pdf
 
Malad Call Girl in Services 9892124323 | ₹,4500 With Room Free Delivery
Malad Call Girl in Services  9892124323 | ₹,4500 With Room Free DeliveryMalad Call Girl in Services  9892124323 | ₹,4500 With Room Free Delivery
Malad Call Girl in Services 9892124323 | ₹,4500 With Room Free Delivery
 
🔝+919953056974 🔝young Delhi Escort service Pusa Road
🔝+919953056974 🔝young Delhi Escort service Pusa Road🔝+919953056974 🔝young Delhi Escort service Pusa Road
🔝+919953056974 🔝young Delhi Escort service Pusa Road
 
government_intervention_in_business_ownership[1].pdf
government_intervention_in_business_ownership[1].pdfgovernment_intervention_in_business_ownership[1].pdf
government_intervention_in_business_ownership[1].pdf
 
Classical Theory of Macroeconomics by Adam Smith
Classical Theory of Macroeconomics by Adam SmithClassical Theory of Macroeconomics by Adam Smith
Classical Theory of Macroeconomics by Adam Smith
 

THE ECONOMIC IMPLICATIONS OF HIGH DEBTS PROFILE TO A DEVELOPING NATION: EMPHASIS ON NIGERIA

  • 1. ISSN 2348-3156 (Print) International Journal of Social Science and Humanities Research ISSN 2348-3164 (online) Vol. 10, Issue 1, pp: (233-253), Month: January - March 2022, Available at: www.researchpublish.com Page | 233 Research Publish Journals THE ECONOMIC IMPLICATIONS OF HIGH DEBTS PROFILE TO A DEVELOPING NATION: EMPHASIS ON NIGERIA Dr. Amieyeofori Valentine Felix, PhD ENERGYHUBNG.COM, 2022 Abstract: Public debts if secured and managed sustainably have been shown to boost economic growth and development, especially for developing economies. Unfortunately, Nigeria’s increasing debt profile, has not been managed efficiently and transparently to produce the desired economic benefits, but rather, as noted in this paper, the country may be treading towards the threshold of debt unsustainability at debt to GDP ratio of 40%. The country uses more than 90% of its revenue to service its debts, which, the paper noted has pushed the country into debt distress, macroeconomic challenges- financial and currency crises, high unemployment, and extreme poverty of nearly 50% of the total population. The paper thus proffered strategic policy recommendations, such as reducing cost of government, switching to interest free debt instruments, and asset-linked securitization; removal of fuel subsidies, and finally ensure transparent and ensuring public, parliamentary and creditors’ scrutiny of the public debts. 1. INTRODUCTION When it comes to the concept of classification of countries according to the level of their development, there is no generally acceptable criterion mostly because of the large and easily discernible differences in the standard of living enjoyed by citizens of different countries. Consequently, the three major international organizations, United Nations Development Programme (UNDP), World Bank, and the International Monetary Fund (IMF), all have different but closely related development taxonomies to differentiate the levels of development of countries. The UNDP classification is built around Human Development Index (HDI). (Nielson 2011). The Human Development Index (HDI) is a statistical tool used to measure a country's overall achievement in its social and economic dimensions. The social and economic dimensions of a country are based on the health of people, their level of education attainment and their standard of living. It was created by Pakistani economist Mahbub ul Haq in 1990 which was further used to measure the country's development by the United Nations Development Program (UNDP). (The Economics Times, 2021). Human Development Index value is determined by combining a country's scores in a vast and wide-ranging assortment of indicators including life expectancy, literacy rate, rural populations' access to electricity, GDP per capita, exports and imports, homicide rate, multidimensional poverty index, income inequality, internet availability, and many more. These indicators are compiled into a single number between 0 and 1.0, with 1.0 being the highest possible human development. HDI is divided into four tiers: very high human development (0.8-1.0), high human development (0.7-0.79), medium human development (0.55-.70), and low human development (below 0.55). (World Population Review, 2021). Every year UNDP ranks countries based on the HDI report released in their annual report. HDI is one of the best tools to keep track of the level of development of a country, as it combines all major social and economic indicators that are responsible for economic development. (The Economics Times, 2021). Most developed countries have an HDI score of 0.8 or above (in the very high human development tier). These countries have stable governments, widespread education, healthcare, high life expectancies, and growing, powerful economies. In contrast to this are the world's least developed countries (LDCs), which tend to have HDI scores below 0.55, in the "low human development" category. LDCs face unstable
  • 2. ISSN 2348-3156 (Print) International Journal of Social Science and Humanities Research ISSN 2348-3164 (online) Vol. 10, Issue 1, pp: (233-253), Month: January - March 2022, Available at: www.researchpublish.com Page | 234 Research Publish Journals governments, widespread poverty, lack of access to healthcare, and poor education. Additionally, these countries have low income and low life expectancies, coupled with high birth rates. Based on the UNDP 2020 HDI Report, there are 66 countries in the very high DHI with Norway at the top with 0.957, Denmark as 10th with 0.940, the UK on 13th with 0.932; the USA on 16th with 0.926, while Mauritius, is ranked 66th with 0.804. There are 52 countries in the High HDI group with Seychelles on top of this group as 67th on the table with 0.796; China is ranked 85th with 0.761; Algeria is 91st with 0.728; South Africa is ranked 114 with 0.709, while Gabon is the last member on this group as 119th with 0.703. There are 36 countries under the Medium HDI with Kyrgstan on top of this list as 120th with 0.697; Namibia at 137th with 0.646, Ghana is 138th with 0.611, Cameroon is 153th with 0.563, while Comoros is last on this list as 156th with 0.554. The last group, Low HDI contains 32 countries with Mauritania on top of this list as 157th with 0.546, Nigeria is 161th with 0.539, South Sudan is 185th with 0.433, while Niger is the last on this list at 189th with 0.394. (World Population Review, 2021). The World Bank brought out its first development classification, called the World Development Index (WDI) in 1978 in its World Development Report. The 1978 WDI classified countries into three groups: Developing countries, industrialized countries, and Capital-surplus oil exporting countries. The developing countries were further classified as low income with Gross National Income per capita (GNI/n) of USD$250 or less, and middle-income countries with GNI/n of USD$250 and above. Another classification was introduced in 1989 with the introduction of high-income category with GNI/n above USD$6000. The WDI further split the middle-income developing countries into lower and upper middle- income countries, while the category of industrialized countries was abolished. (Nielson, 2011). (World Economic Situation and Prospects 2014). The World Bank‘s classifications are updated each year on July 1 and are based on GNI per capita in current USD, and the classifications are generally changed for two reasons: (i) In each country, factors such as economic growth, inflation, exchange rates, and population growth influence GNI per capita. Revisions to national accounts methods and data can also have an influence in specific cases. (ii) To keep the income classification thresholds fixed in real terms, they are adjusted annually for inflation. (Hamadeh et al 2021). Table 1: New World Bank Country Classifications -Income Level – 2021-2022 Group July 1, 2021 (new) July 1, 2020 (old) Low Income Lower-middle income 1,046 – 4,095 1,035 – 4,045 Upper-middle income 4,096-12,695 4,046- 12,535 High income >12,695 >12,535 Finally, the IMF in its International Financial Statistics (IFS) published in 1948 classified the countries into Industrial countries, (2) other high-income countries (3) less developed countries. This system was further classified in early 1970 into (1) Industrial countries (2) primary producing countries in more developed areas and (3) primary producing countries in less developed areas. By mid 1970s, the classification has further moved to (1) industrial countries (2) other Europe, Australia, New Zealand, South Africa (3) oil exporting countries, and (4) other less developed areas. Further refinement of the classification in 1997 renamed the Industrial countries as Advanced Countries group, while in 2004, the WDI introduced the developing and emerging economies categories, to separate them from the categories of Advanced economies. (Nielson, 2011). Advanced Economies are sub-catergorised into Euro Area, Major Advanced Economies (G7), Newly Industrialized Asian Economies, Other Advanced Economies (Advanced Economies excluding G7 and Euro Area), and the European Union. The Emerging and Developing Economies are sub categorised into Central and Eastern Europe, Commonwealth of Independent States, Developing Asia, ASEAN-5, Latin America and the Caribbean, Middle East and North Africa, Sub-Saharan Africa. (Gbadamosi, 2021). Generally, the following characteristics separate developed or advanced economies from developing economies: Developed countries have the following features; High level of per capita income, Predominance of industrial activities, Significant share in manufactured product in GNP, high level of foreign exchange reserves, Predominance of tertiary institutions of commerce and banking industry, high level of technology and product capitalization, high level of economic development and growth, and better condition of living for the generality of the people. At the bottom of the ladder are underdeveloped or least developed economies with the following features: low revenue/capital income; preponderance of agriculture, industrial backwardness, capital deficiency (low rate of capital formation, technical progress and shortage of savings), Rapid population growth, Unemployment and under employment, prevalence of
  • 3. ISSN 2348-3156 (Print) International Journal of Social Science and Humanities Research ISSN 2348-3164 (online) Vol. 10, Issue 1, pp: (233-253), Month: January - March 2022, Available at: www.researchpublish.com Page | 235 Research Publish Journals backward technology, underutilization of natural resources, and unsuitable political and social structure. Consequently, developing economies fall in between the developed and the least developed economies with the following features: increase in national income, increase in investment level, increase in industrial production, increase in agro production both the concentration and diversification, modernization of agriculture, increase in social overheads, improvement in stock and capital formation, high capacity to export manufactured goods, massive establishment of promotional structure, and reorientation of social institution. (Otokiti, 2004). Developing Economies are very diverse group of economies, ranging from large economies with dynamic economic growth, referred as emerging economies, like China, India or Brazil which are experiencing growth in GDP and exports even in the period of crises. Others are the smaller and middle- income economies with some specific factor on which they base their development. The last subgroup of Developing Economies are those countries who are economically vulnerable and usually record decline in their GDP, classified by the United Nations as Least Developed Economies (LDC). These economies are usually also very indebted so they have the worst position in the global economy 2. CURRENT GLOBAL ECONOMIC PERSPECTIVES The ongoing pandemic continues to shape the path for global economic activity, with severe outbreaks continuing to weigh on growth in many countries. The most recent wave of COVID-19 is now centered in some emerging market and developing economies (EMDEs), where more transmissible and virulent strains are spreading and where vaccine access remains limited. Vaccination remains especially feeble in low-income countries (LICs). In contrast, advanced economies have generally seen substantial vaccination progress, which has helped limit the spread of COVID-19. Amid continued vaccination, economic activity is firming across major advanced economies most notably in the United States, where the recovery is being powered by substantial fiscal support Growth in China remains solid but has moderated as authorities have shifted their focus from buttressing activity to reducing financial stability risks. Many other countries, primarily EMDEs, are experiencing subdued pickups alongside surges of COVID-19 cases, even if recent waves of infections appear to be less disruptive to economic activity than previous ones. Figure 1: Progress in vaccination against COVID-19 by Economies: Source: IMF, 2021 Recoveries in fragile and conflict-affected LICs are particularly weak, as the pandemic has exacerbated underlying challenges. Whereas global manufacturing activity has firmed, with industrial production surpassing its pre-pandemic level, services activity especially travel and tourism remains soft. Global financial conditions have tightened somewhat, partly reflecting a rise in U.S. bond yields amid increased inflation pressures. Nevertheless, they remain generally supportive, reflecting continued extraordinary policy accommodation by major central banks. Commodity prices have increased markedly, owing to the improving global outlook as well as commodity-specific supply factors. The recovery in global activity and in commodity prices is contributing to an increase in inflation, especially in some EMDEs that have
  • 4. ISSN 2348-3156 (Print) International Journal of Social Science and Humanities Research ISSN 2348-3164 (online) Vol. 10, Issue 1, pp: (233-253), Month: January - March 2022, Available at: www.researchpublish.com Page | 236 Research Publish Journals experienced currency depreciation. (World Bank, 2021). Against this background, the global economy is projected to grow 5.9 percent in 2021 and 4.9 percent in 2022, 0.1 percentage point lower for 2021 than in the July forecast. The downward revision for 2021 reflects a downgrade for advanced economies in part due to supply disruptions and for low- income developing countries, largely due to worsening pandemic dynamics. This is partially offset by stronger near-term prospects among some commodity-exporting emerging market and developing economies. Rapid spread of Delta and the threat of new variants have increased uncertainty about how quickly the pandemic can be overcome. Policy choices have become more difficult, with limited room to maneuver. (IMF, 2021) Table 2: IMF Economic Projection Figure 2: Global Economic Activity Indicators. Source: IMF, 2021
  • 5. ISSN 2348-3156 (Print) International Journal of Social Science and Humanities Research ISSN 2348-3164 (online) Vol. 10, Issue 1, pp: (233-253), Month: January - March 2022, Available at: www.researchpublish.com Page | 237 Research Publish Journals The recovery is not assured: the possibility remains that additional COVID-19 waves, further vaccination delays, mounting debt levels, or rising inflationary pressures deliver setbacks. First and foremost, expanding vaccine distribution and deployment, especially to developing countries, is a precondition to economic recovery. This requires overcoming obstacles in procuring and distributing vaccines including by redirecting excess vaccine supplies from some advanced economies to developing countries that have delivery programs in place. This also entails expanding vaccines production, lifting trade restrictions on vaccine inputs, and improving the transparency of vaccine orders, options and delivery schedules. Attention to debt is another critical task. The last decade saw the largest, fastest, and most broad based increase in debt levels around the world. The pandemic, which spurred an unprecedented buildup in government debt in many economies, amplified this trend. These developments highlight the importance of careful use of debt financed spending. In particular, capital need be allowed to flow for productive uses, especially in countries that have implemented large-scale fiscal support. Effective domestic revenue mobilization and robust medium-term fiscal frameworks are essential to widen fiscal space, foster policy credibility, and bolster debt sustainability. Improved debt management and debt transparency are critical components of sound governance. These challenges are particularly important for low-income countries, half of whom faced debt distress or were at high risk of it even before the pandemic struck. The resources required to service debt—due to high interest rates and elevated debt levels divert funds from investment in health, nutrition, education, and other critical development needs. It will take continued global cooperation—including greater participation by the private sector to provide debt relief to the poorest countries and fund the investments needed to foster and sustain longer-term growth. (World Bank, 2021). 3. PUBLIC DEBT AND ECONOMIC DEVELOPMENT Growing any economy especially in this era of fourth industrial revolution requires that countries invest in critical areas such as artificial intelligence, machine learning, technological development, and human capital, and these would require massive amount of funds, which in most cases are raised from external borrowing as internal funds such as revenues from trade and taxation might not be sufficient. This is because, taxation creates distortionary effects on economic growth, and therefore is less popular among the policymakers. Public debt is therefore only feasible option to finance government expenditures and other development projects if the country lacks funds, and this is consistent with the Ricardian invariance theorem, in which taxation gives excess burden to the public by increasing the cost of living and reducing the purchasing power of people. (Rahman et al, 2019). The World Bank defined government or public debt as the entire stock of direct government fixed-term contractual obligations to others outstanding on a particular date. It includes domestic and foreign liabilities such as currency and money deposits, securities other than shares, and loans. It is the gross amount of government liabilities reduced by the amount of equity and financial derivatives held by the government. Because debt is a stock rather than a flow, it is measured as of a given date, usually the last day of the fiscal year. (World Bank, 2021). According to Hakura, 2020, of the IMF, a debt instrument is a financial claim that requires payment of interest, principal, or both by the debtor to the creditor at a future date. Technically, a debt is regarded essentially as that which a person or group of people legally owes another or an obligation that is enforceable by legal action to make payment for money owed to another. It is the disbursement of funds made available to a needy entity (or nation) by a wealthy entity or institution, for development and consumption purposes on certain terms of repayment. Thus, a debt owed by a government is called public debt, which can be incurred from domestic and or international financial markets, and where the debt is obtained for investment in assets or infrastructure, it is referred to be reproductive debt, while borrowings to finance wars and recurrent expenditures are called dead-weight debts. Domestic debts are debts secured within the jurisdiction of the government, while external debt refers to unpaid portion of foreign resources acquired from developmental purposes and balance of payment support, which are not repaid as they fall due. (Senibi et al, 2016). Hakura, 2020 added that the definition of public debt varies depending on its purpose, and that the commonly used narrow definition of public debt only covers the budgetary central government, and thus rather limiting. A broader definition would thus include the general government (budgetary central government, state and local government, extrabudgetary units, and social security funds). This definition thus combines general government with public nonfinancial corporations and public financial corporations, including the central bank. It also covers publicly guaranteed debt (debt the public sector does not hold but has an obligation to cover) and external public debt (debt held by nonresidents of the country). Eke and Akujuobi, 2021, in their paper described public debt as one of the major indicators of the macroeconomic variables that forms the image of countries in the international markets. As one of the determinants of foreign direct investment flows, prudent management of public debt creates economic prosperity and stability through resources
  • 6. ISSN 2348-3156 (Print) International Journal of Social Science and Humanities Research ISSN 2348-3164 (online) Vol. 10, Issue 1, pp: (233-253), Month: January - March 2022, Available at: www.researchpublish.com Page | 238 Research Publish Journals mobilization with low borrowing cost and limited financial risk exposure. Public debt is also one of the approaches used in financing government projects, which include debts at national, state and local governments that revealed how much public spending is financed through borrowing instead of taxation. However, public debt can rise and become a burden due to overreliance on external borrowings to augment capital formation in the nation‗s economy. The debt becomes a burden when interest payments on the borrowed fund places pressure on the current account of the government, resulting into debt overhang, which is a condition by which the expected repayment on external debt falls short of the contractual value of debt. If the level of a nation‗s debt is expected to exceed the country‗s ability to repay with some probability in the future, expected debt service is likely to be an increasing function of the output level of the country. (Eke and Akujuobi, 2021). According to Ranasinghe, 2021 of the Institute of International Finance, (IIF), Global debt rose to a new record high of nearly $300 trillion in the second quarter of 2021 though debt-to-GDP ratio declined for the first time since the start of the pandemic as economic growth rebounded. Total debt levels, which include government, household and corporate and bank debt, rose $4.8 trillion to $296 trillion at the end of June 2021 as shown in figure 3, after a slight decline in the first quarter, to stand $36 trillion above pre-pandemic levels and according to IIF, if the borrowing continues at this pace, global debt can exceed $300 trillion. The rise in debt levels was the sharpest among emerging markets, with total debt rising $3.5 trillion in the second quarter from the preceding three months to reach almost $92 trillion. Figure 3. Global Debt Situation. Source: Ranasinghe, 2021 Debt as a share of gross domestic product fell to around 353% in the second quarter, from a record high of 362% in the first three months of this year. The IIF said that of the 61 countries it monitored, 51 recorded a decline in debt-to-GDP levels, mostly on the back of a strong rebound in economic activity. The IIF further reported that China has seen a steeper rise in its debt levels compared with other countries, while emerging-market debt excluding China rose to a fresh record high at $36 trillion in the second quarter of 2021, driven by a rise in government borrowing. The IIF noted that after a slight decline in the first quarter, debt among developed economies especially the euro area rose again in the second quarter, 2021 (Ranasinghe, 2021). 3.1 External Debts for Developing Nations The situation of any debtor countries has a specific character, and thus making it impossible to enumerate all the factors contributing to the occurrence of external debt. However, one of the core reasons for taking external loans are undoubtedly deficiencies in one‘s own capital and the aspirations related to development, consumption, and expansion. (Gorniewicz, 2009). Countries incur debt by borrowing, as borrowing enable countries to finance important development programs and projects. This notwithstanding, the reasons for running into debt depend mainly on the level of the development of a country, and thus differ for economically well-developed countries and for developing countries. Despite these multifarious differences, some common causes, which are typical of developing countries, may be distinguished, starting with the most general classification, the internal (dependent on the debtor country) and external (independent of the debtor country) sources of external debt. The internal sources (dependent on the policies followed by
  • 7. ISSN 2348-3156 (Print) International Journal of Social Science and Humanities Research ISSN 2348-3164 (online) Vol. 10, Issue 1, pp: (233-253), Month: January - March 2022, Available at: www.researchpublish.com Page | 239 Research Publish Journals debtor countries) of the occurrence of external debt include: 1) Investment policies and liberal import norms, 2) Budget and finance policy and currency policy, 3) National capital flight. (Gorniewicz, 2009). Debt accumulation offers both benefits and costs, and also some challenges, which is mostly the difficulties in managing the debt transparently. The benefits depend heavily on how productively the debt is used, the cyclical position of the economy, and the extent of financial market development. Additional debt accumulation by emerging and developing economies may be needed to invest in growth-enhancing projects (e.g., infrastructure, health, and education), and to protect vulnerable groups. During periods of weak growth, it may also be appropriate to borrow in order to employ expansionary fiscal policy to stimulate activity. Moreover, government debt could act as a safe asset when borrowing conditions of investors are tightened. Temporary debt accumulation also plays an important role to stabilize short-term macroeconomic fluctuations. During recessions, borrowing for government spending or tax cuts can provide the necessary fiscal stimulus to support activity. (Kose et al 2020). 3.2 Debt Sustainability While debt is a veritable financial instrument for development, it must be handled cautiously as if taken too far can become a burden and overwhelm a country‘s finances, at worst leading to default. Elevated debt, according to Hakura, 2020, in low-income countries and emerging market economies in recent years has raised concerns about countries‘ capacity to sustain these levels of debt. COVID-19 is adding to spending needs as countries seek to mitigate the health and economic effects of the crisis. The resulting rise in public debt will likely heighten the tension between meeting important development goals and containing debt vulnerabilities. It is therefore imperative for governments to properly assess its debt sustainability, and this can only be productive if such exercise covers all types of debt that pose a risk to a country‘s public finances. According to Hakura, 2020, it will be detrimental and lead to unexpected consequences, if the government only focuses on a narrowly defined concept of public debt and cited a situation where the debt burden of a loss-making state-owned enterprise can easily become the burden of the central government since such debt is publicly guaranteed, leading to unexpected weakening in a country‘s debt sustainability. In how much debt is sustainable, Hakura, 2020, highlighted some factors that could determine how much debt a country can carry before the burden becomes too much. A country‘s debt-carrying capacity depends on such factors as the quality of institutions and debt management capacity, policies, and macroeconomic fundamentals, all of which can change over time, as it is also influenced by the global economic environment. Hakura, 2020, who is also a deputy division chief in the IMF‘s Strategy, Policy, and Review Department, mentioned that the IMF‘s frameworks for debt sustainability assessment in low-income countries and countries with access to capital markets take into consideration individual countries‘ debt-carrying capacity. The assessments are calibrated in reference to previous episodes of debt distress for groups of countries with similar economic characteristics. The calibrations lead to debt sustainability analysis thresholds for key public debt indicators that signal higher risk if that indicator exceeds (or is expected to exceed) its threshold and can be either based on historical experience or convey information about the likelihood of future debt distress. These frameworks, Hakura, 2020 added, consider the degree of uncertainty in the projections of the debt and debt service indicators. This is done through fan charts and stress tests. Because these assessments are based on projections of debt, interest, and key macroeconomic variables, both frameworks also rely on tools to help to gauge the realism of these forecasts. The IMF‘s approach to debt sustainability also leaves room for informed judgment. While low interest rates have arguably increased countries‘ capacity to borrow, it does not however, necessarily translate into an ability to handle higher debt service. Even if interest rates are low and the availability of financing is ample, experience has shown that there are limits to countries‘ debt- carrying capacity and that rising debt-service burdens need to be carefully managed. Another factor that will play a significant role in debt sustainability is growth, as all things being equal, higher growth improves debt dynamics. Indeed, most historical cases of significant debt reductions without restructuring have involved a surge in growth. In many of these cases, however, growth was driven by factors outside the countries‘ control, such as a global boom, the coming onstream of natural resources exports, or improved terms of trade (a country receiving relatively higher prices for its exports and paying relatively lower import prices). According to Hakura, 2020, without such external impulses, stimulating growth domestically for a sustained period can be difficult, and can require new debt for instance, to fund public investment. With the current uncertain outlook for growth, debt service needs to be carefully managed, and strengthening debt management and debt data should be top priorities. She concluded that, while advanced economies and emerging markets, carry out frequent debt sustainability analysis that focuses on the general government, low-income countries rarely complete coverage of both public and publicly guaranteed debt. Again, it is important that the
  • 8. ISSN 2348-3156 (Print) International Journal of Social Science and Humanities Research ISSN 2348-3164 (online) Vol. 10, Issue 1, pp: (233-253), Month: January - March 2022, Available at: www.researchpublish.com Page | 240 Research Publish Journals sustainability assessment must also include the holders of public debt, and that assessments of debt sustainability carried out by the IMF and World Bank cover both domestic and external public sector debt, while sovereign credit rating agencies focus more on the risk of debt distress on market-based external public sector debt. 3.3 The Cost of High Debt to Developing Economies The most basic cost of public debt is the servicing cost of the interest to be paid to creditors. An important argument against heavy borrowing, which may outweigh the benefits of borrowing in some countries, is that rollover costs, the costs of refinancing when debt matures can increase sharply during periods of financial stress and even trigger a financial crisis. High debt can also limit the feasible size and effectiveness of fiscal stimulus during downturns and constrain growth over the long term by crowding out productivity-enhancing private investment. There is also the issue of increasing vulnerability to financial crises with high debt, as a growing debt-to-GDP ratio could erode investor confidence, requiring the government to pay a rising risk premium on its debt. These pressures could culminate in a debt crisis if investors fear that the accumulation of government debt is no longer sustainable. There is also a great chance of currency crises with rapid debt accumulations, and this can happen when investor fear about the ability of the debtor country to repay foreign- currency denominated debt. High debt can also lead to a banking crisis if private sector balance sheet vulnerabilities trigger banking panics. Financial crises tend to result in large economic costs with large effects on economic activity, and as has been observed, many recessions follow from financial crises, and financial crises often tend to make these recessions worse than a ―normal‖ business cycle recession. One other cost of increasing debt is to constrain government action during downturns, as high debt has capacity to constrain governments‘ ability to respond to downturns with countercyclical fiscal policy, as was the case during the global financial crisis: fiscal stimulus during 2008-09 was considerably smaller in countries with high debt than in those with low government debt. High government debt tends to render expansionary fiscal policy less effective. In theory, high government debt can reduce the size of fiscal multipliers through two channels. (Kose et al 2020). First, there is the Ricardian channel, when a government with a weak fiscal position implements fiscal stimulus, households expect tax increases sooner than in an economy with a strong fiscal position. The perceived negative wealth effect leads households to cut consumption and save more, thereby weakening the impact of the stimulus on output. Thus, the net effect of such fiscal policy in an economy with a weaker fiscal position will only generate smaller multiplier effect on such economies. The second channel is an investor sentiment channel, as countries with high sovereign debt are more likely to have to pay a risk premium to borrow. When debt is higher, fiscal stimulus can increase creditors‘ concerns about sovereign credit risk, raising sovereign bond yields and, hence, borrowing costs across the whole economy. Higher risk premia, especially during times of sovereign financial stress, have been shown to feed into lower corporate borrowing, which will in turn crowd out private investment and consumption, reducing the fiscal multiplier. (Kose et al 2020). Contributing to the discourse on the cost of debt on developing nations, UNCTAD, 2021 added that developing nations face critical challenges due to external indebtedness particularly in a context of floating exchange rate systems, open capital accounts and fast integration into international financial markets. These nations according to UNCTAD, 2021, are therefore experiencing recurrent vulnerability to external shocks, especially for commodity dependent economies during commodity price volatilities, as external debt serving obligations requires sufficient export earnings, coupled with exchange rate volatility, both of which affect the value of debt owed externally. Developing countries are also cornered to raise development finance on commercial terms in the international financial markets due to insufficient international public finance flows and limited access to concessional resources. They are also further constrained to open their domestic financial markets to non-resident investors, while their citizens resort to borrowing from overseas. These external financial sources, while they help capital-scarce countries to quickly raise much-needed funds, they also expose them to higher risk profiles of debt contracts, i.e. shorter maturities and more volatile financing costs, as well as to sudden reversals of private capital inflows. In conjunction with other exogenous shocks, such as natural disasters, pandemics or episodes of political instability, external debt burdens deemed sustainable by international creditors can quickly become unsustainable. (UNCTAD, 2021). According to UNCTAD 2021 the external debt of developing nations grew to a record high in 2020, with worsening risk profiles, reaching upto $10.6 trillion in the wake of the COVID-19 pandemic. This is more than twice their value of US$4.4 trillion registered in 2009, and more than four-fold their level of US$2.3 trillion in 2000 as shown in figure 4.
  • 9. ISSN 2348-3156 (Print) International Journal of Social Science and Humanities Research ISSN 2348-3164 (online) Vol. 10, Issue 1, pp: (233-253), Month: January - March 2022, Available at: www.researchpublish.com Page | 241 Research Publish Journals Figure 4. External Debt Stock for developing economies. Source: UNCTAD, 2021 The debt stock translated an average ratio of external debt to GDP from 23 per cent in 2008 (its lowest point in the last 20 years) to 31 per cent in 2020, as shown in figure 5, being the highest annual increase since the financial crisis, probably as a result of the COVID-19 crisis. Figure 5. External Debt stock as a percentage of GDP for Developing Economies. Source. UNCTAD, 2021 These trends are largely influenced by China, whose economy accounted for 23 per cent of total external debt stocks of developing economies and 44 per cent of their GDP in 2020. During the period 2009-2020 China‘s external debt stock grew at a slightly higher rate than the developing countries average, but its GDP grew much faster. As a result, the average ratio of external debt to GDP for developing economies excluding China is 13 percentage points higher, reaching 44 per cent of their GDP in 2020. At the same time, the public-private composition of long-term external debt changed, with the share of Private debt in overall external debt surpassing that of Public debt from 2011 to 2016 and practically remaining at similar levels since then. In addition, the share of short-term debt (characterized by higher risk profiles) increased, from 16 per cent of overall external debt in 2000 to 26 per cent in 2020, with a peak at 33 per cent in 2013. Figure 5 also shows that over the past two decades, overall external debt stocks have not only risen markedly across all developing regions, but has also been accompanied by a rising share of short-term debt and Public long-term debt. Given their deeper financial systems, most of the international private lending into developing countries went to high-income and upper-middle income economies, particularly in Asia and Latin America, with significant presence in Central Asia and sub-Saharan Africa as shown in figure 6. 0 2000 4000 6000 8000 10000 12000 2000 2001 2002 2003 2004 2005 2006 2007 2008 2009 2010 2011 2012 2013 2014 2015 2016 2017 2018 2019 2020 External debt stocks, developing economies (Billions of current US$) 0 10 20 30 40 2000 2001 2002 2003 2004 2005 2006 2007 2008 2009 2010 2011 2012 2013 2014 2015 2016 2017 2018 2019 2020 External debt stocks as a percentage of GDP, developing economies (Percentage) Private Public Short-term debt
  • 10. ISSN 2348-3156 (Print) International Journal of Social Science and Humanities Research ISSN 2348-3164 (online) Vol. 10, Issue 1, pp: (233-253), Month: January - March 2022, Available at: www.researchpublish.com Page | 242 Research Publish Journals Figure 6. External Debt Stock, developing economies by Region. Source. UNCTAD, 2021 Figure 5 further shows that developing countries now patronize more of private creditors, especially through public bonds, to refinance their external debt obligations in international financial markets with strong speculative features than the traditional official bilateral and multilateral creditors, which are generally more stable and in more favorable terms. Besides the principal debt, one of the consequences of these rising debt profile is the increasing debt service costs on public external debt, as debt service ratios are important indicators of a country‘s debt sustainability. The ratio reflects on how a government can meet its external creditor claims on the public sector through export revenues. A persistent deterioration of this ratio signals an inability to generate enough foreign exchange income to meet external creditor obligations on a country‘s debt, and thus potential debt distress in the absence of multilateral support or effective sovereign debt restructuring. According to the UNCTAD 2021 report, only high-income developing countries have maintained a stable ratio of external long-term private debt to export revenues of around two to four per cent in the last decade. They achieved this through issuance of more domestic public debt, with a view to avoiding currency mismatches, which has its problems of creating maturity mismatches. In contrast, the debt service ratios of other developing economies have increased markedly since 2012 across all other income categories: in middle-income countries this ratio rose from 3.3 per cent in 2012 to 7.1 per cent in 2020 and in low-income countries from 2.9 to 6.7 per cent. The squeeze on government revenues from service payments on external debt was particularly drastic in Sub-Saharan Africa, where this ratio jumped from a low point of 3.3 per cent in 2011 to 10 per cent in 2020. This is of concern since low-income developing countries still rely predominantly on public financing to mobilize resources for structural transformation, yet also struggle the most with limited fiscal space given their shallow domestic financial and banking systems and limited options to refinance maturing debt obligations in the international financial markets. 3.4 Challenges with Debt Transparency One of the challenges confronting developing economies‘ debt is the opaqueness of these debts due to lack of transparency in debt management. The World Bank in its recent report on Debt Transparency in Developing Economies showed that current global debt surveillance depends on a patchwork of databases with different standards and definitions, resulting in large gaps in debt information for many low-income developing countries. (World Bank, 2021). Furthermore, World Bank chief economist, Carmen Reinhart, stated that existing systems for tracking the sovereign debts of the poorest countries are inadequate and mask hidden debts, as they are likely to owe far more than the record levels currently estimated (Iyatse et al, 2021). The Report revealed that where those debt data exist, they are mostly limited to central government loans and securities, inclusion of other public sector components and debt instruments. This finding indicates that some Low-Income Developing Countries (LIDCs), have debt data across various sources with variations in these data as high as 30 percent of a country‘s gross domestic product. These huge differences are attributable to differing definitions and standards and recording errors, and according to the World Bank report, these challenges expose LIDCs to the dangers of inadequate debt transparency such as the risk of debt distress and delayed debt restructurings and threatens the ability of countries to 0 1000 2000 3000 4000 5000 East Asia & Pacific Latin America & Caribbean Middle East & North Africa South Asia Central Asia Sub-Saharan Africa External debt stocks, developing economies, by region (Billions of current US$) 2000 2020
  • 11. ISSN 2348-3156 (Print) International Journal of Social Science and Humanities Research ISSN 2348-3164 (online) Vol. 10, Issue 1, pp: (233-253), Month: January - March 2022, Available at: www.researchpublish.com Page | 243 Research Publish Journals overcome the pandemic and generate a green, resilient, and inclusive recovery. The Report further showed that the inherent opaqueness of their debt data makes it difficult for these governments to make sound decisions about borrowing, and thus cause about 44% of low-income countries to face a high risk of debt distress while 12% are already experiencing it. As a solution to these problems, the World Bank Report made the following high-priority recommendations to resolve the challenges: (i) Develop a sound public debt management legal framework to establish clear debt authorization provisions, and requiring the disclosure of public debt information, regulating its content and frequency and making it easily accessible to all stakeholders; (ii) Publish core public and publicly guaranteed debt statistics at the general government level annually, including information on individual debt instruments contracted; (iii) Limit and define the scope of confidentiality clauses in borrowing, and refrain from those that require secrecy; (iv) Develop and adopt strict analytical and monitoring processes for approval and implementation of resource-backed loans, and finally (v) Provide a definition of public debt in line with international standards, announce the country‘s debt management objectives, and provide a list of permitted debt instruments, transactions or sources of funding. However, due to the global inclusiveness of these debt distresses, the race for debt transparency would need to involve international financial institutions, debtors, creditors, and other stakeholders, such as credit-rating agencies and civil society. According to the World Bank Group President David Malpass, the poorest countries are already on the path of emerging from the COVID-19 pandemic with the largest debt burdens in the last few decades, but limited debt transparency will delay critical debt reconciliation and restructuring for these countries (Iyatse et al, 2021). These challenges notwithstanding, the World Bank Report further estimated that for low income developing countries to meet the Sustainable Development Goals by 2030, they will need to invest at least 4.5 per cent of national GDP each year on infrastructure alone. This will translate to about $429 billion between 2023-2025, and considering their revenue bases, these funds will have to come from external financing through new borrowing, and to ensure that this financing contributes effectively to development outcomes and does not undermine long-term debt sustainability, the World Bank emphasized the need for debt transparency improvement by these economies. (Adenuga, 2021) 3.5 Empirical Findings on Public Debt and Economic Growth While debt instrument fosters development goals, Soluso (2003) asserted that countries borrow for two broad reasons: macroeconomic, that is, to finance higher levels of consumption and investment or to finance transitory balance of payment deficit and avoid budget constraint and in turn, boost economic growth and reduce poverty. It is this constant need for governments to borrow to finance budget deficit that leads to the external debt, which has also become a medium used by countries to bridge their deficits and carry out economic projects that are able to increase the standard of living of the citizenry and promote sustainable growth and development. Generally, the expectation is that public borrowing ought to accelerate economic growth and improves total factor productivity through an increase in output which in turn enhances Gross Domestic Product (GDP) growth of a nation. However, several empirical studies on the nexus between public debt and economic growth are divided in their conclusions. Nur et al, 2019 carried out a systemic review of the public debt and economic growth nexus by reviewing 33 articles on the subject, an came out with a summary that Overall, 24 of 33 articles which were investigated revealed a linear positive and negative or insignificant relationship between public debt and economic growth. Linear positive relationship indicates that the economy can grow as the debt level increases, which is a preferred condition since the country is able to increase public debt to meet their national objectives such as enhancing their infrastructures, investing in human capital and so on. The linear negative relationship on the other hand indicates that the economic growth is declining when the country increases its debt level, which will cause many projects to be postponed, as additional debts will only lead to the slowdown of the economic growth. As a result, the country might not be able to remain competitive since investors would no longer interested to invest in the country. Regardless of the type of public debt, Nur et al, 2019 found that most of the articles on public debt and economic growth from 2017 to 2019 showed a significant negative relationship between the two series. They further observed that the relationship is applicable to all types of economies, regardless of whether they are lower-middle-income, upper-middle- income or high-income economies. The negative relationship is consistent with the conventional view of debt, in which there will be a crowding-out effect on the private investment when the economy is facing high debt problem. Those that exhibited linear positive relationship showed that public debt can also contribute to higher economic growth, as an increase in public debt will help to stimulate aggregate demand and output, among others, via the employment generation and productive investment. However, this relationship is only applicable in the short-run. If it continues to increase in the long run, the effect can switch to becoming negative. Therefore, it is important for the government to be alert on the debt
  • 12. ISSN 2348-3156 (Print) International Journal of Social Science and Humanities Research ISSN 2348-3164 (online) Vol. 10, Issue 1, pp: (233-253), Month: January - March 2022, Available at: www.researchpublish.com Page | 244 Research Publish Journals threshold that can switch the debt‘s effect from positive to negative. On the issue of debt threshold, Nur et al, 2019 cited the Reinhart-Rogoff hypothesis which argued that public debt can positively affect the economic growth if the debt to GDP level is lesser than 90%, as once the debt-to-GDP is beyond the threshold, the effect changes to negative. However, the debt level that is beyond 90% of the GDP indicates that the countries are among the highly indebted countries. Nur et al, 2019 also cited other studies that found the threshold to be lower than 50% especially amongst European countries and advanced economies such as Belgium, Canada, United Kingdom and United States. However, there is yet any mutual consensus on the right threshold for each country or group of economies as the threshold for each country depends on their current economic situation, the period of studies, the method and the proxies used to test the relationship. Regardless, Rahman et al, 2019 noted that countries such as Lebanon and Greece that have a debt threshold more than 90% must start to reduce their public debt level to ensure greater economic prosperity in the future, as further increase in public debt will not only burden the current generation due to an increase in taxation and reduce in investments. Other empirical studies, mostly on Nigeria, and a few other countries as cited in this paper also confirmed the liner positive and negative relationships between public debt and economic growth. In their works on the effect of public debt on economic growth in Nigeria, covering the period 1981-2018, Eke and Akunjobi (2021) showed that a significant short- run relationship exists between Nigeria's public debt and economic growth. Alenjandro and Ifeana (2017) work on the impact of government debt on gross domestic product in 16 Latin American economies including Bolivia, Argentina, Chile, Brazil, Costa Rica, Colombia, Dominican Republic, Mexico, Honduras, Panama, Nicaragua, Peru, Paraguay, Venezuela and Uruguay for the period 1960-2015, showed that public debt has a positive impact on GDP growth but declines to close to zero beyond public debt-to-GDP ratios between 64% and 71% up to this threshold, additional debt has a stimulating impact on growth. Isaac and Rosa (2016) studies on the effect of public debt and public investments on economic growth in Mexico for the period 1993-2012 showed that public debt has a positive influence on public investment and economic growth in the economy. However, Naeem (2015) work on public debt and economic growth in the Philippines for the period 1975-2010 showed that public external debt has a negative and significant impact on economic growth and investment, which confirm the existence of a debt overhang effect. This negative impact was also seen in the works of Lucky and Godday (2017) on the nexus between the public debts structure and the growth performance of the Nigerian economy for the period 1990-2015 using multiple regression analyses. Similar results were also obtained by Elom-Obed, Odo, Elom and Anoke (2017) on the nexus between public debt and economic growth in Nigeria for the period 1980-2015 using co-integration test, Vector Error Correction Model (VECM) and Granger causality test. The empirical results revealed that external debt and domestic debt have negative and significant effects on economic growth in Nigeria. Abula and Ben (2016) work on the effect of public debt on economic development in Nigeria from 1986 to 2014 also showed that external debt servicing and external debt stock have a negative and insignificant impact on economic development in Nigeria while domestic debt stock has a significant influence on economic development. The results also showed that domestic debt service payment has a negative and significant effect on economic development in Nigeria. Ayadi and Ayadi (2008) work on the impact of the huge external debt, with its servicing requirements on economic growth of Nigerian and South African and revealed negative impact of debt and its servicing requirement on the economic growth of Nigeria and South Africa. Audu (2004) investigation on the impact of external debt on economic growth and public investment in Nigeria from 1970-2002, found that debt servicing pressure in the country has had a significant adverse effect on the growth process and past debt accumulation negatively affect public investment. Malik, and Hayat (2010) also investigated the nexus between external debt and economic growth in Pakistan for the period between 1972 – 2005, and found that external debt is negatively and significantly related to economic growth, while the work of Abdelmawla and Mohammed (2005) on the impact of external debt on economic growth of Sudan for the period between 1978 – 2001, showed that export earnings have a significant positive impact while external debt and inflation had negative impact on Sudan‘s economic growth. Finally, Karogol (2002) also confirmed that debt service is negatively related to economic growth in the long-run for Turkey during 1956 – 1996. 4. NIGERIA PUBLIC DEBT Nigeria‘s external debt can be traced to 1958 when about $ 28 million US dollars was contracted from the World Bank for railway construction, and remained significantly low between 1958 and 1977, until 1978 due to the fall in oil prices that exerted a negative influence on government finances. Consequently, the first major borrowing of $1 billion US dollars referred to as Jumbo loan was contracted from the international capital market (ICM) in 1978. The spate of borrowing as
  • 13. ISSN 2348-3156 (Print) International Journal of Social Science and Humanities Research ISSN 2348-3164 (online) Vol. 10, Issue 1, pp: (233-253), Month: January - March 2022, Available at: www.researchpublish.com Page | 245 Research Publish Journals shown in figure 7, has been on the upward trend due to increasing fiscal deficits driven by the higher level of external debt servicing became a major threat to growth of the nation. The resultant effect of large accumulation of debt exposes the nation to high debt burden. (Sulaiman and Azeez, 2012). Figure 7: Nigeria Historical Debt Profile – 1970 – 2019. Source: Macrotrends, 2021 This spiraling debt profile has raised serious concerns among Nigerians on the debt sustainability of the country amid dwindling revenue to meet the debt obligations to creditors. Historically, data from the Debt Management Office (DMO) showed that federal government debt both local and foreign debt rose from N3.55 trillion in 1999 to N26.91 trillion at the end of March 2021, representing a whopping 658 percent increase in 21 years, covering the administrations of Olusegun Obasanjo, Umar Musa Yar‘Adua, Goodluck Jonathan, and the current Muhammadu Buhari. This is despite Chief Olusegun Obasanjo led government securing debt relief in 2006 as the first African country to settle its public debt under a scheme devised to help the world‘s poorest and indebted states. The country under Chief Olusegun Obasanjo paid off $18 billion to secure forgiveness of the balance of its nearly $30 billion debts to the London and Paris clubs of foreign creditors. The debt forgiveness is seen as a dip in the chart in figure 7 above. (Yusuf, 2021). Figure 8 shows the debt status of each administration from Chief Olusegun Obasanjo from 1999 to 2007, to President Yar‘Adua from 2007 to 2010, and President Jonathan from 2010 to 2015, and finally the administration of President Buhari from 2015 to 2021, which clearly shows the increasing domestic and foreign debt stock that has become a source of concern for all stakeholders. The chart also shows the impact of debt forgiveness during President Obasanjo administration, which was sustained during President Yar‘Adua government. The debt stock began the upward swing from 2011 and became astronomical in the administration of President Buhari. Figure 8: Nigeria Debt Structure from 1999 to 2021. Sources – Yusuf, 2021, and other sources. - 10,000,000,000.00 20,000,000,000.00 30,000,000,000.00 40,000,000,000.00 50,000,000,000.00 60,000,000,000.00 1/1/1970 1/1/1973 1/1/1976 1/1/1979 1/1/1982 1/1/1985 1/1/1988 1/1/1991 1/1/1994 1/1/1997 1/1/2000 1/1/2003 1/1/2006 1/1/2009 1/1/2012 1/1/2015 1/1/2018 Nigerian Historical Debt ($USD), 1970-2019 0 5 10 15 20 25 30 35 40 1999 2000 2001 2002 2003 2004 2005 2006 2007 2008 2009 2010 2011 2012 2013 2014 2015 2016 2017 2018 2019 2020 2021 Nigerian Debt Structure - 1999 - 2021 Domestic Debt (N-trillion) External Debt ($ billion)
  • 14. ISSN 2348-3156 (Print) International Journal of Social Science and Humanities Research ISSN 2348-3164 (online) Vol. 10, Issue 1, pp: (233-253), Month: January - March 2022, Available at: www.researchpublish.com Page | 246 Research Publish Journals With a current debt of N35.465 trillion as of June 30, 2021, or $93.5 billion, the country may be on the part to debt unsustainability according to Director-General of the Debt Management Office unless there is swift turn to grow its revenue base. (Ifeanyi, 2021). A breakdown of the total public debt showed that external debt was N13.711 trillion ($36.1 billion), representing 38.66 per cent, while domestic debt stood at N21.754 trillion ($57.3 billion), representing 61.34 per cent of the total stock. A further breakdown indicates that the Federal Government accounted for N11. 828 trillion ($31.2 billion) of the external debt and N17. 632 trillion ($46.5 billion) of the domestic debt. States and the FCT‘s external debt stood at N1.883 trillion, with a domestic debt stock of N4.122 trillion. A breakdown of source of the external debt showed that the bulk of the debt is owed to multilaterals (World Bank Group and the African Development Bank Group), which accounted for 54.88 per cent, while commercial debt (Eurobonds and Diaspora bonds) accounted for 31.88 per cent. Bilateral debts (China, France, Japan, India and Germany) make up for 12. 70 per cent, while Promissory Notes represent 0. 54 per cent. (Ujah, 2021). Despite these debt volume, the senate continued to approve a set of three different loan requests by President Muhammadu Buhari in July, 2021, totaling N 2.343 trillion, which is approximately $6 billion and another $8.3 billion and €490 million. (Ojekunle, 2021). The Senate again in November 2021 approved additional $16 billion, €1 billion and a grant of $125 million as foreign loans for President Muhammadu Buhari to fund his administration‘s legacy projects. They specifically approved the issuance of €500 million from the Bank of Industries and €750 million Eurobond in the International Capital Market, and only asked the President to forward the terms and conditions of the loans from the funding agencies to the National Assembly. According to the senate committee on local and foreign debts, the projects, which funds are requested for in the 2018-2020 borrowing plan, are ongoing. They affirmed that the projects would stimulate a rebirth of commercial and engineering activities and the consequent tax revenues payable to government as a result of these productive activities will increase. (Iyatse et al 2021). According to Babalola, 2021, the ballooning debt stock is attributable to the decades of misrule and financial imprudence of its military and political leaders. This view had earlier been expanded by President Olusegun Obasanjo in his remarks on the debt stock, who identified such factors as political rascality, bad governance, abuse of office and power, criminal corruption, mismanagement and waste, misplaced priorities, fiscal indiscipline, weak control, monitoring and evaluation mechanisms, and a community that was openly tolerant of corruption and other underhand and extra-legal methods of primitive accumulation, as being responsible for the Nigerian debt crisis. A case in point is the recent loan approved by the senate in November 2021, where some Senators raised eyebrow over the absence of terms and conditions attached to the loan request. The Deputy Senate President, Ovie Omo-Agege, expressed concern over the issue, as some members were side blinded over the terms and conditions attached to the loans. He stated that the senators went through the terms but noted that they were written in Chinese language, something that was also privy to the Budget Office, but regardless, the loans were approved by the senate. (Iyatse etal, 2021). It has also been observed that the government clearly rebuffed the Fiscal Responsibility Act, and the CBN Act 2007, as it exceeded the fiscal borrowing threshold as stipulated in the fiscal act, which according to the Finance, Budget and Planning Minister was due to the COVID-19 pandemic. The fiscal responsibility Act provided for 25% as the government‘s borrowing limit as a percent of GDP, but this was exceeded in 2020 at 34.8 %. Also, in 2020, the country recorded a budget deficit of about 4% of GDP, which also exceeded the 3% threshold in the fiscal responsibility Act. On overdraft, section 38, sub-section 1 and 2, of the CBN Act, provided that government shall not at any time exceed 5 percent of the previous year‘s actual revenue of the Federal Government in over draft, but again, by the end of 2020, CBN overdrafts to the government exceeded the limit by 69 percent of the revenue generated in 2019: the government‘s revenue in the year was N4.1 trillion, and overdraft stood at N2.9 trillion. In order to create more room for borrowing, earlier this year, the federal executive council (FEC) had strategically raised the borrowing limit to 40 percent in its Medium-term debt management strategy for Nigeria for the period 2020- 2023. (Ojekunle, 2021). 5. IMPLICATIONS OF NIGERIA’S HIGH DEBT PROFILE Already, the World Bank, has ranked Nigeria among the top 10 countries with the highest debt risk exposure, sitting in the fifth position with $11.7 billion debt exposure, behind India ($22 billion), Bangladesh ($18.1 billion), Pakistan ($16.4 billion), and Vietnam ($14.1 billion). The huge debt and low revenue base are impacting negatively on Nigeria‘s sustainability as debt service obligations gulped 97 per cent of the country‘s total revenue in 2020. In the meantime, another N3.3 trillion has been set aside for debt servicing in the assented 2021 budget, which is about a quarter (24.3 per cent) of the entire N13.6 trillion total expenditure. Though the debt to GDP is at 33%, and still within sustainable level,
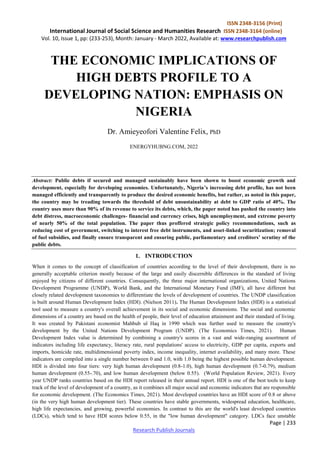
  • 15. ISSN 2348-3156 (Print) International Journal of Social Science and Humanities Research ISSN 2348-3164 (online) Vol. 10, Issue 1, pp: (233-253), Month: January - March 2022, Available at: www.researchpublish.com Page | 247 Research Publish Journals the major problem is the low revenue base. According to IMF debt sustainability framework, the debt becomes unsustainable when debt to GDP crosses the 40% threshold, and at the pace of borrowing, Nigeria debt will soon cross this sustainability threshold. (Yusuf, 2021). Also, Nigeria‘s 2022 record budget of 16.39 trillion naira ($39.8 billion) already has an inbuilt deficit of 6.26 trillion naira, or 3.39% of GDP which is expected to be funded by new borrowing, proceeds from privatizations and drawdowns on loans secured for specific projects. (Reuter, 2021). The implication of the growing debt service is that the government is expending nearly all its revenue in servicing recurrent expenditure and debts, with very little or any development, which ofcourse pushes the Federal Government to resort to more foreign loans which will continuously increase the nation‘s external debt profile. According to Wilson Erumebor, a senior economist at Nigerian Economic Summit Group, Nigeria is confronted with rising expenditure with relatively small growth in revenue thus always experiencing a wide fiscal deficit that will still be financed by borrowing. Wilson Erumebor estimated that Nigeria‘s total debt could be as high as N48.7 trillion when AMCON‘s liabilities and CBN‘s ways and means are factored into the total debt. (Ojekunle, 2021). As a consequence of it high debt stock and debt service ratio, the country is already experiencing financial and currency crises seen in the perpetual deteriorating dollar-naira exchange rate. Nigerian exchange rate was N0.7 or 70 kobo to a One US dollar in 1971 and became N22 to a dollar at the turn of the current democratic transition in 1999. By 2015, when President Buhari came in, it was exchanging at N197.87 to the dollar. The Dollar is presently exchanging for N430 in 2021 at the official platform, while it is exchanging for between N530-N 550 at the parallel market as of November 2021. The central bank has devalued the currency three times since March 2020 after lower oil prices put pressure on dollar reserves and prompted the regulator to ration foreign exchange. There‘s been no official announcement about plans for a fourth devaluation although the bank is selling dollars at less than the official rate, signaling that it would prefer a weaker currency. According to Osae-Brown and Onu,, 2017, the consistency of the interventions at the 444 naira-per-dollar levels likely indicates that this is a preferred level if the CBN decides to devalue the naira,‖ Lagos-based Chapel Hill Denham said in a note to clients Monday. The Central Bank of Nigeria has been selling the US dollar at 444 naira per dollar to investors for almost three weeks, while the official spot rate is about 415 naira to the greenback, according to traders. (Osae-Brown and Onu, 2021). As the government spends most of its revenue on debt servicing, very little is left for development purposes, which is evident in the rather slow economic development as proxied as HDI in figure 9. Figure 9: HDI comparison between Ghana and Nigeria from 1990 – 2019. Source: Country Economy/HDI Figure 9 showed that Ghana moved its economy from low HDI to Medium HDI between 1999 and 2019, while Nigeria remained as low HDI country despite the ballooning debts by government to develop the economy and the wellbeing of its citizens. As a matter of fact, Nigeria dropped three spots to 161 in 2019 from 158 in 2018 among 189 countries in the 2020 Human Development Index (HDI). 0 0.1 0.2 0.3 0.4 0.5 0.6 0.7 1990 1992 1994 1996 1998 2000 2002 2004 2006 2008 2010 2012 2014 2016 2018 HDI Comparison between Ghana and Nigeria Ghana Nigeria Nigeria
  • 16. ISSN 2348-3156 (Print) International Journal of Social Science and Humanities Research ISSN 2348-3164 (online) Vol. 10, Issue 1, pp: (233-253), Month: January - March 2022, Available at: www.researchpublish.com Page | 248 Research Publish Journals Another fallout of the high debt stock is the increasing unemployment rate as shown in figure 10. Figure 10. Nigeria historical unemployment Rate. The unemployment rate of 33.3% indicates that one in three of the 69.7 million-strong labor force in Nigeria either did nothing or worked for less than 20 hours a week, making them unemployed, according to the Nigerian definition of unemployment. Another 15.9 million worked less than 40 hours a week, making them underemployed. (Ajiboye, 2021). Figure 11 shows the inflation trend with current inflation of 15% Figure 11. Nigeria inflation trend. As shown in figure 11, inflation was in single digits in 2014 through 2015, compared to its current value of 17.75% in 2021. This high inflation has driven more Nigerians into poverty as according to the World Bank, seven million Nigerians have been driven into poverty due to the 22% increase in the price of food, and food prices contribute about 60% to the current inflation rate. The rising food prices exacerbated the present poverty as it reduces the real purchasing power of households and shifts expenditures away from essential items such as health, education and housing. Onyeiwu, 2021 asserted that the average Nigerian household spends about 56% of income on food, the highest in the world, whereas countries like US, UK, Canada, and Australia spend 6.4%, 8.2%, 9.1%, and 9.8%. Nigeria‘s high expenditure on food implies that a slight increase in food prices would push more people into multidimensional poverty. Multidimensional poverty measures poverty by income, and by the access people have to health, education and living standard indicators,
  • 17. ISSN 2348-3156 (Print) International Journal of Social Science and Humanities Research ISSN 2348-3164 (online) Vol. 10, Issue 1, pp: (233-253), Month: January - March 2022, Available at: www.researchpublish.com Page | 249 Research Publish Journals which include sanitation, drinking water, electricity, and housing. By this measure, World Bank estimates that 47.3% Nigerians, or 98 million people, live in multidimensional poverty, most of which are located in northern Nigeria. This poverty rate does not include Borno State, where insurgency has prevented data collection. If the World Bank‘s income poverty threshold of $3.20 per day is used, Nigeria‘s poverty rate is 71% or about 147 million poor people. This compared unfavorably to lower rates for some oil-producing developing countries like Brazil (9.1%), Mexico (6.5%), Ecuador (9.7%) and Iran (3.1%). (Onyeiwu, 2021). The depreciation in the value of the Naira has also resulted in steep increases in the prices of imported food items, such as rice, sugar, milk, beverages, and frozen food, (Ajiboye, 2021). 6. STRATEGIES AND POLICY DIRECTIONS FOR MANAGING NIGERIA’S RISING DEBT PROFILE The increasing debt profile, and the unrelentless tendencies of the Nigerian government to borrow has been a source of concerns to economists and other economic stakeholders both locally and at the international platforms. This section thus presents some measures at handling the debt problems. (i) The World Bank in its November 2021 Nigeria Development Update made some policy recommendations for the President Buhari administration to help in mitigating its rising debt problems. According to the World Bank, if the current debt accumulation levels are maintained, the country‘s debt-to-GDP ratio will hit the 40 percent threshold by 2025. It also reported that Nigeria has the worst revenue-to-GDP ratio among 115 countries, including Haiti. Therefore, as a policy shift towards managing its high debt stock, the World Bank recommended that the country completely removes fuel subsidy in 2022, since the subsidy only benefits the rich and not the poor. The Bank asserted that PMS subsidies, are regressive because PMS is used primarily in light- and medium-duty motor vehicles, which are rarely owned by the poor. Raising PMS prices tends to have minimal adverse effects on poor households; therefore, governments worldwide have typically prioritized eliminating PMS subsidies over those that apply to other fuels. It reported that Nigeria is the only country in the world with a universal price subsidy that applies exclusively to PMS. Universal price subsidies for liquid fuels are almost always regressive, as the rich consume far more fuel than the poor. (Tijani, 2021). The World Bank also recommended that the government taxes what it called ―Sin Goods‖ such as cigarette, alcohol, sugary drinks to increase its revenue base. It also strongly recommended that the President Buhari Administration cuts back on its request for overdrafts from the CBN through the Ways and Means financing system and asked the Federal Government to keep overdrafts to levels stipulated by law. Finally, the Bank advised the government to reduce delays in border and port clearance by simplifying and harmonizing documents, streamlining, automating procedures, and introducing risk-based customs interventions.‖ It also strongly recommended that the government opens all boarders for trade (Tijani, 2021). Reacting to the World Bank recommendation on fuel subsidy, the Federal Government through the GMD, NNPC confirmed that fuel subsidy will be removed by end February 2022 and a liter of Petrol might sell between N320-340 by end of February 2022. (ii) In addition to the World Bank‘s recommendation, Griffiths, 2019, proffered additional steps in managing the debts of developing economies through careful selection of the opportunities, costs and risks of different sources of borrowing. Griffiths 2019 observed that many low-income economies lack strong capacity for debt management mainly due to their lack of demand, accountability and political commitment. He also recommended that lenders play a key role in improving the borrowing options available to low-income countries, which will require creditors to offer State Contingent Debt Instruments (SCDIs) that could pause repayments for borrower facing repayment difficulties. Griffiths, 2019 also recommended flexible debt contracts that allows for easier restructuring of debt and endorse better contractual terms and conditions. Such contracts could contain ‗standstills‘ clauses where repayments are halted during difficult periods or supporting mediation and arbitration mechanisms. He also emphasized the need for increased accountability and debt transparency at the country level, so that domestic citizens and parliaments can provide incentives for governments to improve debt contraction, use, and management. This will require the setting up of a public debt register that can be accessed easily by all stakeholders, including multilateral actors and private sector creditors. This level of public disclosure of lending contracts, according to Griffiths, 2019, would allow parliaments, journalists, and civil society organizations to serve as watch dog to the executive arm of government. (iii) Hakura, 2020 also suggested other ways of mobilizing financing, such as by raising domestic revenue, improving the efficiency of spending, reducing corruption, and improving the business environment. While She recognized that
  • 18. ISSN 2348-3156 (Print) International Journal of Social Science and Humanities Research ISSN 2348-3164 (online) Vol. 10, Issue 1, pp: (233-253), Month: January - March 2022, Available at: www.researchpublish.com Page | 250 Research Publish Journals these steps may take some time to materialize, Hakura, 2020 recommended that countries should be prepared to keep debt sustainable and ensure that it does not jeopardize growth and stability, as unsustainable debts can lead to debt distress, and defaults in debt settlement. Defaults can cause borrowing countries to lose market access and suffer higher borrowing costs, in addition to harming growth and investment. As a way forward, she proffered three key policy steps for countries that are considering fresh debts (i) new borrowing should be consistent with fiscal spending and deficit plans, and such new borrowing must guarantee debt sustainability. (ii) Countries must evaluate the returns from investing the borrowed fund to the overall cost of accumulating debt. Debt that finances productive social and infrastructure spending can lead to higher income that may ultimately offset the cost of debt service and help balance the risks to debt sustainability (iii) There must be transparent debt reporting and debt statistics in the context of comprehensive medium-term debt management strategies. Debt statistics should include coverage of public and publicly guaranteed debt that is as broad as possible, including debt of state-owned enterprises. Sharing this data with lenders can encourage responsible lending. (iv) In addition to the views of Griffiths, 2019, and Hakura, 2020, Teriba, 2021 recommended that Nigeria aggressively restructures its debt portfolio by replacing interest-paying commercial bonds with interest-free commercial bonds on a wholesale basis to drastically reduce or eliminate the N4.9 trillion annual average interest payments that is projected in the 2022-2024 MTEF. He stated that this has become the trend in the global debt market as Malaysia, Saudi Arabia, and about six other governments, mostly from oil-producing countries, successfully issued interest-free commercial bonds to replace interest-paying ones; corporate bonds were 38 percent; supranational bonds were 10 percent. Teriba, 2021 also recommended a shift to asset-linked debts instruments, as assets can easily be converted for equity-securitization at home or abroad, similar to what Saudi Arabia, did with ARAMCO, in initially issuing IPO at home before seeking Sukuk globally. He stressed that asset-linked securitization converts dead, idle, and underutilized public corporate, infrastructure, physical, and intangible assets into liquid cash flow without the burden of interest payments through the budget. The advantage of this, is that commercial investors are willing to wait for profits or rent since most of such securities have investment-grade ratings by foremost agencies. (v) Finally, one of the core solutions to reducing debt is for the government to cut down its costs of running the government. Nigeria runs one of the most expensive government structures globally, spending more than 70% of its budget on recurrent expenditure and less than 30% on Capital expenditure. Most of the recurrent expenditure funds the legislatures and the executive arms of government, with 109 senators on an average remuneration of $450,000 per annum, with a total senate staff of 829 aides besides retinue of support staff also paid by the National Assembly. The House of Representatives consists of 360 members with annual remuneration of $398,000 per member, and this also besides their 1,880 aides and retinue of support staff, all in the payroll of the National assembly. When compared with the United States, with a population of about 330 million spread across 50 states, and a GDP in excess of $22 trillion, the US has 435 house of representative members and 100 senators, with each member of both houses receiving the same $174,000 per annum. In terms of GDP per capita, the USA has $66,144, while Nigeria has $2,209, yet Nigeria pays her legislatures far more than the USA. The Presidency also gulps a large chunk of the annual revenue through retinue of aides, ranging from Special Advisers to Senior Special Assistants to Special Assistants to both the President, Vice President, and other senior government officials. This is outside of the current 43 ministries each with their with its retinue of aides and special assistants. Surprisingly, the US and other leading democracies across the world, run leaner governments: the US has 15 Secretaries (Ministers) as members of Cabinet for its 50 States, while the United Kingdom has just 21 ministers, who are also members of Parliament, House of Lords and House of Commons. India, with a population of about 1.4 billion people, has only 19 ministers in her cabinet and presided over by the Prime Minister, while Germany has 15 cabinet ministers. Finally, Ghana‘s constitution allows for a minimum of 10 cabinet ministers and a maximum of 19. (Otti, 2021). The Federal Government confirmed through the Minister of Labour and Employment, Mr Chris Ngige that the federal government under President Muhammadu Buhari borrows funds from international sources to pay salaries of workers because of a shortfall in the country‘s revenue. (Olowookere, 2021). As one of the strategies of managing the increasing debt burden, the Federal Government has recently initiated the process of implementing the Report of the Committee on the Restructuring and Rationalization of Federal Government Parastatals, Commissions and Agencies, chaired by Stephen Oronsaye. The Committee, which was constituted August 18, 2011, and submitted its report on April 16, 2014. The report recommended that of the 541 Statutory and Non-Statutory
  • 19. ISSN 2348-3156 (Print) International Journal of Social Science and Humanities Research ISSN 2348-3164 (online) Vol. 10, Issue 1, pp: (233-253), Month: January - March 2022, Available at: www.researchpublish.com Page | 251 Research Publish Journals Federal Government Parastatals, Agencies and Commissions, 263 statutory agencies should be reduced to 161, 38 agencies should be abolished, 52 agencies should be merged, and 14 should revert back to Departments in Ministries. (Idoko, 2021). Following the recommendations of the Oronsaye Report, Otti, 2021 also recommended that the Presidency be cut down by about 40%, and this has to be across board including the Presidential fleet, There has also been calls for the reduction of the members of the national assembly to a manageable size to reduce the overall cost of governance. 7. CONCLUSIONS AND RECOMMENDATIONS Public debts if secured and managed sustainably have been shown to boost economic growth and development, especially for developing economies. Unfortunately, Nigeria‘s increasing debt profile, has not been managed efficiently and transparently to produce the desired economic benefits, but rather, as noted in this paper, the country may be treading towards the threshold of debt unsustainability at debt to GDP ratio of 40%. The country uses more than 90% of its revenue to service its debts, which, the paper noted has pushed the country into debt distress, macroeconomic challenges- financial and currency crises, high unemployment, and extreme poverty of nearly 50% of the total population. The paper thus proffered strategic policy recommendations, such as reducing cost of government, switching to interest free debt instruments, and asset-linked securitization; removal of fuel subsidies, and finally ensure transparent and ensuring public, parliamentary and creditors‘ scrutiny of the public debts. REFERENCES [1] Abula, M. and Ben, D. M. (2016). The impact of public debt on economic development of Nigeria. Asian Research Journal of Arts & Social Sciences, 1(1): 1-16. [2] Adenuga, A (2021): World Bank demands debt transparency, says Nigeria, others need $429bn https://punchng.com/wbank-demands-debt-transparency-says-nigeria-others-need-429bn/ [3] Ajiboye, A (2021): Inflation targeting in Nigeria, https://mixtafrica.com/inflation-targeting-in-nigeria/ [4] Alejandro, D. J., & Ileana, R. J. (2017). The impact of government debt on economic growth: An overview for Latin America. Department of Economics, University of Perugia (IT), Working Paper, 28, 1-11 [5] Asabe Shehu Yar‘adua Foundation (2020): A Case Study of the problematic nature of development plan in Nigeria. [6] Ayadi, F.S and Ayadi, F.O (2008). The Impact of External Debt on Economic Growth: A Comparative Study of Nigeria and South Africa, Journal of Sustainable Development in Africa, Vol. 10, No.3, 234-264. [7] Babalola, A.A (2021): Nigeria‘s high debt profile: Payroll not the only cause https://www.vanguardngr.com/2021/10/nigerias-high-debt-profile-payroll-not-the-only-cause/ Aare Afe Babalola, [8] Dhara Ranasinghe, D (2021): Global debt is fast approaching record $300 trillion – IIF https://www.reuters.com/business/global-debt-is-fast-approaching-record-300-trillion-iif-2021-09-14/ [9] Eke, C. K., Akunjuobi, N.E (2021): Public Debt and Economic Growth in Nigeria: An Empirical Investigation, International Journal of Development and Management Review (INJODEMAR) Vol. 16, No. 1 [10] Ekundayo, W.J (2015): National Development in Nigeria and the indispensable lessons for Nigeria to learn from the Asian Tigers, Journal Of Good Governance And Sustainable Development In Africa (Jggsda), Vol. 2, No 4. [11] Elom-Obed, O.F., Odo, S. I., Elom, O. O., & Anoke, C. I. (2017). Public debt and economic growth in Nigeria. Asian Research Journal of Arts & Social Sciences, 4 (3): 1-16. [12] Gbadamosi, A (2021): Understanding the developed and developing country taxonomy. (https://www.a4id.org/policy/understanding-the-developeddeveloping-country-taxonomy/ [13] Górniewicz, G (2009): The Problem of External Debt Of Developing Countries (The Case Of North Africa) Les Cahiers du CREAD n°87 /2009 [14] Griffiths, J (2019): Solving the low-income country debt crisis: four solutions https://odi.org/en/insights/solving-the- low-income-country-debt-crisis-four-solutions/
  • 20. ISSN 2348-3156 (Print) International Journal of Social Science and Humanities Research ISSN 2348-3164 (online) Vol. 10, Issue 1, pp: (233-253), Month: January - March 2022, Available at: www.researchpublish.com Page | 252 Research Publish Journals [15] Hakura, D (2020): What is debt sustainability. https://www.imf.org/external/pubs/ft/fandd/2020/09/what-is-debt- sustainability-basics.htm [16] Hamadeh, N., Van Rompaey, C and Metreu, E (2021): New World Bank country classifications by income level: 2021-2022,https://blogs.worldbank.org/opendata/new-world-bank-country-classifications-income-level-2021-2022 [17] Idoko, C (2021): FG Set To Scrap, Merge Agencies, Inaugurates Committee On Implementation Of Oronsaye Report. https://tribuneonlineng.com/fg-set-to-scrap-merge-agencies-inaugurates-committee-on-implementation-of- oronsaye-report/ [18] IMF (2021): Economic Projection: Global Activity Indicators, https://www.imf.org/en/Publications/WEO/Issues/ 2021/ 10/12/world-economic-outlook-october-2021 [19] IMF, (2021): World Economic Outlook, Recovery during a Pandemic [20] Isaac, S., and Rosa, G. (2016). Public debt, public investment and economic growth in Mexico, International Journal of Financial Studies, 4(6): 1-14. [21] Iyatse, G., Abuh, A and Daka, T (2021): Senate okays Buhari‘s $16b, €1b, $125m loan request without terms. https://guardian.ng/news/senate-okays-buharis-16b-e1b-125m-loan-request-without-terms/ [22] Karagol, E. (2002). The Causality Analysis of External Debt Service and GNP: The Case of Turkey, Central Bank Review, 2(1), 39-64. [23] Kose, M, A., Ohnsorege, F and Sugawara, N (2020): Benefits and Costs of Debt the dose makes the poison. Policy Research Working Paper 9166, World Bank Group, Prospects Group February 2020 [24] Lucky, E. U., & Godday, O. O. (2017). The Nigeria debt structure and its effects on economic performance. International Journal of Business and Management Review, 5 (10): 79-88. [25] Malik, S., Hayat, M.K. & Hayat, M.U (2010). External Debt and Economic Growth: Empirical Evidence from Pakistan‖, International Research Journal of Finance and Economics, ISSN 1450-2887, Issue 44, 88-97. [26] Nielsen L (2011): Classification of Countries based on their level of development: How it is done and How it could be done. IMF Working Paper, Strategy, Policy and Review Department. [27] Nur,H.R., Shafinar, S., and Abdul, R. R. (2019). How does public debt affect economic growth? A systemic review, Cogent Business and Management, 6(170133): 1-16 [28] Ojekunle, A (2021): From Obasanjo to Buhari… how FG‘s debt profile surged 658% to N26.9trn in 21 years, https://www.thecable.ng/from-obasanjo-to-buhari-how-fgs-debt-profile-surged-658-to-n26-9trn-in-21-years [29] Olowookere, D (2021): Ngige Confirms FG Borrows from World Bank, Others to Pay Salaries, https://businesspost.ng/economy/ngige-confirms-fg-borrows-from-world-bank-others-to-pay-salaries/ [30] Onyeiwu, S (2021): Nigeria‘s poverty profile is grim. It‘s time to move beyond handouts. https://theconversation.com/nigerias-poverty-profile-is-grim-its-time-to-move-beyond-handouts-163302 [31] Osae-Brown, A and Onu, E (2021): Nigeria Signals Preference for Weaker Naira Exchange Rate, https://www.bloomberg.com/news/articles/2021-11-23/nigeria-signals-preference-for-weaker-naira-exchange-rate [32] Otokiti S (2004): International Business, Pumark Nigeria Limited, First Edition [33] Otti, A (2021): Cost of running government in Nigeria unsustainable [34] https://www.vanguardngr.com/2021/03/cost-of-running-government-in-nigeria-unsustainable-alex-otti/ [35] Rapley J (2007): Understanding Development- Theory and Practice in the Third World, Third Edition, Lynne Rienner Publishers [36] Senibi,V., Oduntan,E., Uzoma,O., Senibi,E and Oluwaseun, A (2016): Public Debt and External Reserve: The Nigerian Experience (1981–2013), , Hindawi Publishing Corporation Economics Research International Volume 2016, Article ID 1957017, 7 pages http://dx.doi.org/10.1155/2016/1957017
  • 21. ISSN 2348-3156 (Print) International Journal of Social Science and Humanities Research ISSN 2348-3164 (online) Vol. 10, Issue 1, pp: (233-253), Month: January - March 2022, Available at: www.researchpublish.com Page | 253 Research Publish Journals [37] Smith, L (2021): How Governments Reduce the National Debt, https://www.investopedia.com/articles/economics/ 11/successful-ways-government-reduces-debt.asp, pdated [38] Soludo, C.C. (2003). Debt Poverty and Inequality in Okonjo Iweala, Soludo, and Muntar (Eds), The Debt Trap in Nigeria, Africa World Press NJ, pp. 23-74. [39] Sulaiman, L.A and Azeez, B.A (2012): Effect of External Debt on Economic Growth of Nigeria, Journal of Economics and Sustainable Development www.iiste.org ISSN 2222-1700 (Paper) ISSN 2222-2855 (Online) Vol.3, No.8, [40] World Economic Situation and Prospect (2014): Country Classification [41] Teriba, A (2021): Finding a way out of Nigeria‘s high debt costs, https://www.vanguardngr.com/2021/09/finding-a- way-out-of-nigerias-high-debt-costs/ [42] Tijani, M (2021): Kill subsidy, cut CBN loans, raise ‗sin‘ taxes… 7 things World Bank wants Buhari to do in 2022 [43] The Economic Times (2021): Definition of 'Human Development Index, (The Economics Times. http://economictimes.indiatimes.com/definition/human-development-index). [44] UNCTAD (2021): Developing country external debt: From growing sustainability concerns to potential crisis in the time of COVID-19, https://sdgpulse.unctad.org/debt-sustainability/ [45] Ujah, E (2021): Nigeria owing N35.5trn, local debt stands at N21 trillion https://www.vanguardngr.com/2021/09/nigeria-owing-n35-5trn-local-debt-stands-at-n21-trillion/ [46] World Population Review (2021): HDI by Country. (https://worldpopulationreview.com/country-rankings/hdi-by- country). [47] World Bank (2021): Global Economic Prospects, 2021, World Bank Group Flagship Report [48] https://databank.worldbank.org/metadataglossary/world-development-indicators/series/GC.DOD.TOTL.GD.ZS [49] World Bank (2021): Report: Debt Transparency in Developing Economies https://www.worldbank.org/en/topic/debt/publication/report-debt-transparency-in-developing-economies, [50] https://www.macrotrends.net/countries/NGA/nigeria/external-debt-stock [51] Yusuf, K (2021): Inside Nigeria‘s Debt Crisis: Howforeign loan under Buhari triples past govts‘combined figure [52] https://www.premiumtimesng.com/news/headlines/489041-inside-nigerias-debt-crisis-how-foreign-loan-under- buhari-triples-past-govts-combined-figure.html [53] https://countryeconomy.com/hdi/ghana, https://countryeconomy.com/hdi/nigeria [54] https://www.macrotrends.net/countries/NGA/nigeria/unemployment-rate [55] https://www.thecable.ng/kill-subsidy-cut-cbn-loans-raise-sin-taxes-7-things-world-bank-wants-buhari-to-do-in- 2022,