SlideShare a Scribd company logo
1 of 8
Download to read offline
An examination of the relationship amongst profiles of perceived
organizational values, safety climate and safety outcomes
Sarah K. Colley a
, Jonathan Lincolne b
, Andrew Neal a,⇑
a
The University of Queensland, Brisbane, Australia
b
Pockets of Brilliance, Brisbane, Australia
a r t i c l e i n f o
Article history:
Received 11 July 2011
Received in revised form 18 May 2012
Accepted 3 June 2012
Available online 21 July 2012
Keywords:
Occupational safety
Safety climate
Occupational accidents/incidents
Well-being
Competing Values Framework
a b s t r a c t
The aim of the current study was to understand how different patterns of perceived organizational values
are related to safety. We surveyed individuals working in high risk industries, assessing perceptions of
organizational values, psychological safety climate and safety incidents. Modal Profile Analysis (MPA)
identified four commonly perceived profiles across the sample. Results from a one-way MANOVA indi-
cated that individuals who perceived that their organization strongly emphasizes either: (a) employee
well-being (a human relations profile); or (b) employee well-being in conjunction with goal attainment
(a joint human relations–rational goal profile); reported higher levels of safety climate and fewer safety
incidents. Individuals who perceived that their organization strongly emphasizes either: (a) formal pro-
cesses and procedures (an internal process profile); or (b) formal processes and procedures in conjunction
with goal attainment (a joint internal process–rational goal profile), reported lower levels of safety cli-
mate and more safety incidents. These findings are discussed in terms of their theoretical contribution
to the safety climate literature, and in relation to the practical importance that values play in influencing
employee perceptions of safety.
Ó 2012 Elsevier Ltd. All rights reserved.
1. Introduction
The term ‘‘safety climate’’ refers to perceptions of organiza-
tional policies, procedures and practices relating to safety (Neal
et al., 2000). A substantial body of research has accumulated in
the past 30 years examining the structure of safety climate, and
its relationship with outcomes, such as behavior and accidents
(Zohar, 2010). Meta-analyses have established that individuals
who perceive that their organization values safety are more likely
to comply with safety procedures and carry out voluntary activities
that enhance the safety of their workplace, and are less likely to be
involved in safety incidents (Christian et al., 2009; Clarke, 2006;
Nahrgang et al., 2011). These findings show that an individual’s
perception of safety climate matters, because it has an influence
on their behavior, and ultimately on the risk of injury to them-
selves, and their co-workers.
Whilst a great deal of research has focussed on the conse-
quences of safety climate, less attention has been paid to the ante-
cedents of safety climate. In the current study, we examine the role
of perceived organizational values as an antecedent of perceived
safety climate. Kabanoff et al. (1995) define values as beliefs
regarding what is important, either for individuals, or for the orga-
nization as a whole. Perceptions of organizational values are
important, because they influence the way that employees inter-
pret policies, procedures and practices (James and James, 1989).
For example, Griffin and Neal (2000) argued that perceptions of
safety climate reflect the extent to which employees believe that
their personal safety and well-being are valued within the organi-
zation. Zohar and Luria (2004) argued that perceptions of safety
climate reflect the relative emphasis that employees believe is
placed on safety vs productivity. However, there are many
attributes that may be valued within an organization. Organiza-
tions require a range of values to be effective, many of which are
potentially contradictory, such as the need to be both flexible
and controllable (Quinn and Rohrbaugh, 1983). The aim of the
current paper is to examine the impact that different patterns of
perceived organizational values have on perceptions of safety
climate and safety incidents.
1.1. Competing Values Framework
The Competing Values Framework was developed by Quinn
and colleagues to describe the different types of values that orga-
nizations require to be effective, and understand the dilemmas
that organizations face in managing the inherent tensions among
these values (Quinn and Rohrbaugh, 1983). As can be seen from
0925-7535/$ - see front matter Ó 2012 Elsevier Ltd. All rights reserved.
http://dx.doi.org/10.1016/j.ssci.2012.06.001
⇑ Corresponding author. Address: School of Psychology, The University of
Queensland, St. Lucia, QLD 4072, Australia. Tel.: +61 7 3300 8630; fax: +61 7
3365 4466.
E-mail address: Andrew@psy.uq.edu.au (A. Neal).
Safety Science 51 (2013) 69–76
Contents lists available at SciVerse ScienceDirect
Safety Science
journal homepage: www.elsevier.com/locate/ssci
Fig. 1, there are two axes representing the competing values of
flexibility-control and internal–external focus. The first axis, flex-
ibility–control, assesses whether the organization is perceived to
have a preference for flexibility or control in the way it is struc-
tured and run. The second axis, internal–external focus, assesses
whether an organization is perceived to have a preference for
focusing its attention inward on the internal dynamics of the
organization or outward toward its external environment. The
two axes generate four quadrants, each of which constitute a dif-
ferent model of effectiveness.
Each model describes the different types of outcomes that
employees believe are valued, and the means by which they think
those outcomes are achieved. Employees who endorse the human
relations (HR) model believe that their organization values em-
ployee cohesion and morale. The human relations model is charac-
terized by a perceived emphasis on trust, participation and
teamwork, in addition to employee training and development
(Parker and Bradley, 2000; Zammuto and Krakower, 1991).
Employees who endorse the open systems (OS) model believe that
their organization values growth and resource acquisition. There is
a perceived emphasis on adaptability and innovation (Denison and
Spreitzer, 1991; Parker and Bradley, 2000). Employees who en-
dorse the rational goal (RG) model believe that the organization
values productivity and efficiency. There is a perceived emphasis
upon planning and goal setting (Denison and Spreitzer, 1991;
Parker and Bradley, 2000; Zammuto and Krakower, 1991). The
internal process (IP) model values stability, continuity, order and
control. The means by which these outcomes are achieved include
the use of formal policies, procedures, rules and regulations to guide
roles and behavior and create conformity (Denison and Spreitzer,
1991; Gifford et al., 2002; Parker and Bradley, 2000).
The Competing Values Framework has been influential within
the safety literature, because it provides a way of understanding
the competing demands that organizations and individuals need
to manage in high risk industries. A number of researchers have
used the Competing Values Framework to develop measures of
safety climate or safety culture (Diaz-Cabrera et al., 2007; Reiman
and Oedewald, 2004; Reiman et al., 2005; Silva et al., 2004). At-
tempts to use the Competing Values Framework in this manner
have had mixed success, as the hypothesized four factor structure
has not always emerged. Furthermore, it has proven difficult to as-
sess the effects of trade-offs or tensions amongst competing values
using the Likert scale response formats traditionally used in cli-
mate or culture surveys (e.g., see Diaz-Cabrera et al., 2007; Silva
et al., 2004).
In the current study, we take a different approach. Rather than
use the Competing Values Framework to develop new measures of
safety climate, we use an established measure of competing values
that allows one to assess the relative emphasis that an individual
believes is placed of different values within the organization. We
examine the effects of different patterns of perceived organiza-
tional values, by using Modal Profile Analysis (Pritchard et al.,
2000) to identify commonly perceived value profiles in a group
of individuals working in high risk industries. We then assess
whether there are differences in perceptions of safety climate
and incidents among individuals reporting different profiles.
Flexibility
Internal
Human Relations
Ends:
Cohesion and morale
Means:
Training & development
Open communication
Participative decision making
Other Characteristics:
Personal
Warm & caring
Equity
Open Systems
Ends:
Innovation & development
Means:
Adaptability & readiness
Visionary communication
Adaptable decision-making
Other Characteristics:
Dynamic & entrepreneurial
Risk taking
Growth & resource acquisition
Internal Process
Ends:
Stability & control
Means:
Information management
Precise communication
Data-based decision making
Other Characteristics:
Formalised and structured
Rule enforcement
Rules & policies
Rational Goal
Ends:
Efficiency & productivity
Means:
Goal setting & planning
Instructional communication
Centralised decision making
Other Characteristics:
Production orientated
Pursuit of goals & objectives
Competition & achievements
Control
ExternalFig. 1. The Competing Values Framework (adapted from Jones et al. (2005) and Parker and Bradley (2000)).
70 S.K. Colley et al. / Safety Science 51 (2013) 69–76
1.2. Profiles of perceived organizational values
Proponents of the Competing Values Framework argue that it is
important to assess the overall pattern of values that an individual
perceives, rather that the effects of individual values, because most
workplaces tend to be characterized by a combination of different
values (Parker and Bradley, 2000; Quinn and Spreitzer, 1991).
Because there are tensions and tradeoffs amongst the different
values, the effect of any one value depends on the relative empha-
sis that is placed on the other values. It is for this reason that the
values described by the Competing Values Framework are assessed
using an ipsative scoring system, in which the respondent is forced
to choose amongst competing alternatives. When an ipsative mea-
sure is used, a response that increases one of the scores reduces
one or more of the other scores. The resulting ‘value profile’ de-
scribes the relative emphasis that an individual believes is placed
on the different values. In the current section, we develop a series
of competing hypotheses regarding the relationship between pro-
files of perceived values and safety outcomes.
One argument that has been developed within the Competing
Values Framework is that organizations with a balanced profile
tend to perform better than organizations with an unbalanced pro-
file (Quinn and Spreitzer, 1991). A balanced profile suggests that
people are valued, trained and supported (human relations focus),
there are adequate and useful rules and procedures (internal
process focus), production goals and targets are appropriate and
achievable (rational goal focus) and the system is adaptable,
innovative and has up-to-date technologies and equipment (open
systems focus). This argument may also apply to safety. All four
elements, when in balance, can make a work system safe for
individual employees. For example, an emphasis on production
(rational goal focus) at the expense of people (human relations
focus), is thought to produce a poor safety climate and make
accidents more likely (Reason, 1990; Wallace and Chen, 2006).
An excessive emphasis on change and innovation (open systems
focus) at the expense of stability and control (internal process
focus) may expose employees to risks and hazards. These
arguments suggest the following:
Hypothesis 1. Individuals who perceive that their organization
has a balanced value profile, will perceive that their organization
has a more positive safety climate, and report fewer incidents, than
individuals who perceive that their organization has an imbal-
anced value profile.
An alternative approach suggests that certain types of values
are likely to be associated with better outcomes than others. The
dimension of flexibility vs control, in particular, may be critical
in relation to safety. We start first with the quadrants emphasizing
flexibility. As noted earlier, the belief that the organization values
employee well-being (human relations focus) is thought to play
an important role in shaping perceptions of safety climate. For
example, Neal et al. (2000) found that perceptions of general
psychological climate predicted perceptions of safety climate (see
Wallace et al. (2006) for similar results at the group level).
Zacharatos et al. (2005) found that employees who perceive that
their organization uses high commitment work practices, such as
teamwork and training, reported higher levels of safety climate
and fewer incidents (see also Parker et al., 2001). Mearns and
colleagues found that a focus on employee well-being through
health promotion and surveillance was associated with positive
safety outcomes (Mearns et al., 2003, 2010). However, a belief that
the organization values adaptability and innovation (open systems
focus) may also have a positive impact on perceptions of safety.
Reiman et al. (2005) analyzed the demands placed on employees
in maintenance units in nuclear power plants, and argued that
the ability to anticipate the state of the plant, and plan and act
accordingly are critical for ensuring safe operations. Similar argu-
ments have been made by Griffin et al. (2007), who argued that
employees working in uncertain environments require both adap-
tivity and proactivity. These arguments suggest that people will re-
act more effectively to unexpected risks and hazards when they
believe there is an emphasis on adaptability, and will act to make
the system safer when there is an emphasis on innovation.
Turning next to the quadrants emphasizing control, a lack of
perceived control on the part of employees is known to have a
range of adverse consequences. These include reduced morale, a
decreased desire for learning and mastery, and dysfunctional atti-
tudes towards work (Deci and Ryan, 1987; Humphrey et al., 2007).
In relation to safety climate, employees who perceive that the
organization places a heavy emphasis on formal rules and proce-
dures (internal process focus) are likely to believe that managers
are more concerned with compliance than with the personal safety
and welfare of employees (Lawton, 1998; Morgan, 1986). Employ-
ees who perceive that the organization places a heavy emphasis on
production and service (rational goal focus) may believe that pro-
ductivity is more important than people and safety (Wright, 1986).
Both perceptions may undermine safety climate. In relation to inci-
dents, employees who believe that they have to rigidly adhere to
rules and procedures are likely to be less adaptable when they
encounter unexpected risks and hazards (Hesketh and Neal,
1999; Perrow, 1979). The perception that managers place a heavy
emphasis on achieving goals and targets may place added pressure
on employees to rush or take short-cuts to meet production pres-
sures (Conway and Svenson, 1998; Wagenaar and Groeneweg,
1987). Both perceptions may lead to an increased risk of errors
and incidents.
In summary, then, our competing hypothesis is as follows:
Hypothesis 2. Individuals who perceive their organization has a
profile that strongly emphasises characteristics associated with
either a human relations or open systems model will perceive a
better safety climate and report fewer incidents than individuals
who perceive that their organization has a profile that strongly
emphasises characteristics associated with either an internal
process or rational goal model.
2. Method
2.1. Participants
A total of 368 individuals completed the study survey. Of these
81.6% were male. The mean age of the group was 37.9 years
(SD = 10.3, range = 18–62). Participants worked across a range of
high risk industries that were based across two Australian states
(Queensland and New South Wales). In total 37.5% worked in min-
ing, 22% worked in power/electrical, 21.5% worked in engineering/
construction, 7% worked in other/miscellaneous industries, 6%
worked in rail, 3% worked in aluminum smelting, and 3% were
missing industry information. Initial data checking identified 309
surveys (or 84%) with complete and usable data. The remaining
59 surveys with missing or incomplete data were excluded from
analyses.
2.2. Procedure
Data was collected from individuals participating in a 2-day
long commercial safety training program. Multiple training pro-
grams were run, across different companies, over the course of
an 8-month period. Approximately 720 participants attended
S.K. Colley et al. / Safety Science 51 (2013) 69–76 71
training as part of their normal work in groups of up to 15 co-
workers. At the completion of the first day of training, the trainers,
who were registered psychologists, provided the groups with back-
ground information about the survey and detailed instructions on
how to complete it. Individuals were then invited to take the sur-
vey home to complete and return it the next day. All individuals
were informed that participation was voluntary and that no penal-
ties would apply should they choose not to complete the survey.
The data was collected in a de-identified form. The majority of
trainees in each training group who took a survey home returned
it completed the following day (completion rate 83%).
2.3. Measures
2.3.1. Perceived organizational values
Perceived organizational values were assessed using the 20-
item Competing Values Framework measure by Zammuto and
Krakower (1991). In this measure there are five categories of ques-
tions which relate to: (a) character of the workplace, (b) workplace
managers, (c) workplace cohesion, (d) workplace emphasis, and (e)
workplace rewards. Under each category there are four statements
that relate to each of the models described by the Competing Val-
ues Framework (i.e., human relations, open systems, internal pro-
cess, and rational goal). Respondents must divide a total of 100
points between the four items in each of the categories. The crite-
rion for allocating points is how similar each statement is to their
workplace. An example of an item assessing character of the work-
place is ‘‘The organization is a very personal place. It is a lot like an
extended family. People seem to share a lot of themselves’’. An
example of an item assessing workplace cohesion, is ‘‘The glue that
holds the organization together is loyalty and tradition. Commit-
ment to the organization runs high’’. The mean scores for each
model were calculated for each participant. The reliability for the
four scales were: internal process a = .78; rational goal a = .70;
open systems a = .80; and human relations a = .80.
2.3.2. Perceived safety climate
Zohar and Luria (2005) argue that perceptions of safety climate
are derived from a range of sources within the organization. In the
current study, we assessed perceived safety climate across three
sources: organizational, supervisory and co-worker. Perceived
organizational safety climate was measured using Neal et al.’s
(2000) 19-item measure. This measure assessed perceptions of
management values, safety communication, physical work envi-
ronment, personnel safety training and safety systems. An example
item is ‘‘Safety is given a high priority by management’’. All items
were answered on a 7-point Likert scale ranging from 1 (‘‘strongly
disagree’’) to 7 (‘‘strongly agree’’). The reliability for this scale was
a = .91. Perceived supervisory safety climate was measured using
Zohar’s (2000) 10-item measure. This measure assessed supervi-
sory action and supervisory expectation. Example items are ‘‘My
supervisor approaches workers during work to discuss safety is-
sues’’, and ‘‘As long as work remains on schedule, my supervisor
doesn’t care how this has been achieved’’. All items were answered
on a 7-point Likert scale ranging from 1 (‘‘strongly disagree’’) to 7
(‘‘strongly agree’’). The reliability for this scale was a = .81. Per-
ceived co-worker safety climate was measured using an adapted
version of Zohar’s (2000) 10-item measure for supervisory safety
climate. This measure assessed co-worker action and co-worker
expectation. Example items are ‘‘My co-workers approach workers
during work to discuss safety issues’’, and ‘‘As long as work re-
mains on schedule, my co-workers don’t care how this has been
achieved’’. All items were answered on a 7-point Likert scale rang-
ing from 1 (‘‘strongly disagree’’) to 7 (‘‘strongly agree’’). The reli-
ability for this scale was a = .87.
2.3.3. Incidents
Following other researchers, (Barling et al., 2002; Mearns et al.,
1998; Morrow and Crum, 2004; Siu et al., 2004) incidents were
measured by asking participants to report the number of incidents
they had been involved in during the last 2 years that involved first
aid treatment, minor equipment damage (less than $1000 damage)
and major equipment damage (more than $1000 damage).
3. Results
3.1. Modal Profile Analysis procedure
MPA is mathematically equivalent to cluster analysis and Q-fac-
tor (participant by participant) principal components analysis
(PCA) of profile similarities (Cattell, 1967; Kim et al., 2004). Con-
ceptually, MPA identifies replicable patterns of scores within a
dataset (Pritchard et al., 2000). In particular, it identifies the most
frequently occurring profile shapes (the highs and lows or
strengths and weaknesses in a profile) in a dataset which are re-
ferred to as ‘modal profiles’ (Kim et al., 2004; Pritchard et al.,
2000). Following Pritchard et al. (2000), we first calculated the
scale scores for each model for each participant. The vector of four
scores for each individual is referred to as the ‘profile of scores’.
Each participant’s profile of scores was then correlated with every
other participant’s profile of scores. This produced a participant-
by-participant inter-correlation matrix. This correlation matrix
was submitted to a principal components analysis using varimax
rotation to ensure maximum distinction between the resulting
modal profiles.
The weighted-average profile for each significant factor was
then calculated. This profile, called the modal profile, best de-
scribes the shape of profiles of individuals with large loadings on
that factor. Two weighted average profiles were calculated for each
of the retained factor – one for those who loaded positively onto
the factor and one for those who loaded negatively onto the factor.
The weighted-average profiles are computed by multiplying each
individuals profile scores by their loading on the component. Then,
the average across all participants who loaded positively onto the
factor created one modal profile; and the average of all participants
who loaded negatively onto the factor create the mirror-image
modal profile. This process was repeated for each of the significant
components.
Participant profiles were then classified into clusters according
to their degree of similarity with each of the modal profiles identi-
fied in the above step. This was done by assessing the product-mo-
ment correlation between an individual’s profile of scores and each
modal profile. The standard similarity (or MAXR P .65) rule was
used to classify individuals into clusters. This meant that individu-
als were assigned to a cluster or modal profile if the product-mo-
ment correlation between their profile of scores and the modal
profile was equal to or greater than 0.65. If the person’s profile of
scores had a correlation greater than 0.65 with more than one
modal profile the individual was assigned to the cluster with which
it correlated highest.
3.2. Modal profiles
MPA produced four modal profiles. Before classifying individu-
als into one of these four profiles, we first conducted a series of
one-way ANOVA’s to determine if significant differences existed
between these four profiles. These analyses indicated that the
modal profiles differed significantly on the human relations
(F(3) = 408.82, p < .001), open systems (F(3) = 29.89, p < .001), ra-
tional goal (F(3) = 198.16, p < .001) and internal process
(F(3) = 938.68, p < .001) models. Given that significant differences
72 S.K. Colley et al. / Safety Science 51 (2013) 69–76
existed between the profiles, we applied the MAXR P .65 classifi-
cation rule to the sample to classify individuals into one of the four
profile groups. This resulted in 85% of participants being classified
into one of the four modal profiles. The remaining 15% of unclassi-
fied cases were excluded from further analyses.
Fig. 2 illustrates the four modal profiles. The first profile was
dominated by a strong focus on the internal process model
(z = 1.42) and weaker emphasis on the other three models (human
relations z = À.56; open systems z = À.82; rational goal z = À.05).
We refer to this as the ‘‘internal process profile’’. The internal pro-
cess profile was the most frequently occurring profile, representing
36.5% of the sample (n = 113). The second profile represents 21% of
the sample (n = 65). This profile was characterized by a strong fo-
cus on the internal process (z = 1.05) and rational goal (z = .67)
models and a weaker emphasis on the human relations (z = À.86)
and open systems models (z = À.86). We refer to this as the ‘‘joint
internal process–rational goal profile’’. The third profile represents
12.5% of the sample (n = 39). This profile had a very weak internal
process focus (z = À1.32). It was dominated by a strong focus on
the human relations (z = 1.09) and rational goal (z = .30) models
and an average focus on the open systems model (z = À.06). We
refer to this as the ‘‘joint human relations–rational goal profile’’.
The final profile represents 15% of the sample (n = 46). This profile
was dominated by a strong focus on the human relations model
(z = 1.48) and weaker emphasis on the other three models (open
systems z = À.29; rational goal z = À.63; internal process z =
À.56). We refer to this as the ‘‘human relations profile’’.
3.3. Differences in perceived safety climate across profiles
After classifying individuals into the profile groups, we next
conducted a one-way MANOVA to investigate whether there were
differences among the groups in organizational safety climate,
supervisory safety climate and co-worker safety climate. After
controlling for age, tenure and length of time working for ones’
supervisor, the combined dependent variables were significantly
different across the profile groups (F(9,486) = 4.18, p < .001; Wilk’s
Lambda = .834; partial g2
= 0.059). Individual univariate analysis of
each dependent variable showed that the profiles differed signifi-
cantly in terms of perceived organizational safety climate
(F(1,202) = 6.16, p < .001; partial g2
= .084), perceived supervisory
safety climate (F(1,202) = 10.52, p < .0001; partial g2
= .132), and
perceived co-worker safety climate (F(1,202) = 2.67, p < .04; partial
g2
= .04).
To follow-up these results, a series of post-hoc analyses were
conducted to compare profile means across the three dependent
variables (refer to Table 1 for descriptive statistics). Levels of per-
ceived organizational safety climate were significantly higher in
the HR–RG and HR groups than in the IP–RG group (both p < .05).
Levels of perceived supervisory safety climate were significantly
higher in the HR–RG and HR groups than in the IP and IP–RG
groups (all p < .05). Levels of perceived co-worker safety climate
were significantly higher in the HR–RG group than in the IP and
IP–RG groups (both p < .05). All other pairwise comparisons were
nonsignificant (all p > .05).
3.4. Differences in safety incidents across profiles
To examine whether the profiles differed significantly in the fre-
quency of reported safety incidents we conducted separate 4
(modal profile) Â 2 (incident/no incident) chi-square analyses for
each of the three safety incident categories: first aid incidents,
minor equipment damage and major equipment damage. Table 2
shows the frequency of reported incidents (coded as 1 = incidents
and 0 = no incidents) for each profile (the percentage of incidents
as a function of group size are presented in parentheses).
Results from the chi-square analysis indicated there was a
significant relationship between cultural profiles and first aid
Fig. 2. Modal profiles.
S.K. Colley et al. / Safety Science 51 (2013) 69–76 73
incidents (v2
(3) = 11.21, p < .05), minor equipment damage (v2
(3) = 11.90, p < .05) and major equipment damage (v2
(3) = 7.60,
p < .05). The percentage of individuals who reported experiencing
first aid incidents, minor equipment damage and major equipment
damage was comparably higher in the IP–RG and IP groups than in
the HR and HR–RG groups (see Table 2).
4. Discussion
The current study provides insight into the composition of per-
ceived value profiles in a sample of individuals working across high
risk industries, and the relationship between perceived value pro-
files on the one hand, and perceptions of safety climate and safety
incidents on the other. Overall, the HR–RG profile performed best
or equal best across all six safety measures, while the HR profile
performed best or equal best on four of the six measures. The IP
profile performed worst or equal worst across four of the six mea-
sures, while the IP–RG profile performed worst across all six mea-
sures. None of the profiles was fully balanced across all four
cultural types. Therefore, the hypothesis that a balanced cultural
profile would be associated with better safety could not be directly
tested, although it was the case that the most balanced of the four
profiles (the HR–RG profile) did perform the best on all six mea-
sures. The HR–RG profile had a strong emphasis on both the human
relations and rational goal models, together with a moderate
emphasis on the open systems model.
The common factor between the poorer performing profiles was
an emphasis on internal processes, while the common factor be-
tween the best performing profiles was an emphasis on human
relations. The internal process and human relations models differ
in terms of their emphasis on control vs flexibility. There are a
number of reasons why a perceived emphasis on control may
undermine safety. A lack of perceived control on the part of
employees is known to adversely affect morale and limit the desire
for learning and development. The overall effect may be to encour-
age the development of a passive orientation to safety, in which
responsibility for safety is seen as part of someone else’s role,
and adaptivity and proactivity are not encouraged (Griffin et al.,
2007; Parker et al., 2003; Turner et al., 2005). Unfortunately, one
of the common ways in which organizations try to improve safety
is by tightening procedures, and mandating compliance (Reason,
1997). Whilst some level of compliance with rules and procedures
is necessary, our results suggest that a perceived emphasis on rules
and procedures, to the exclusion of other values, may actually be
counterproductive.
One of the more interesting aspects of the results is the finding
that an emphasis on the rational goal model may have different ef-
fects on safety outcomes, depending upon the relative emphasis
that is placed on the other models. A rational goal focus was asso-
ciated with good safety outcomes when it was combined with a
human relations focus, but was associated with poor safety out-
comes when combined with an internal process focus. This finding
suggests that a heavy emphasis on goal attainment may not in and
of itself be detrimental to safety, if it is balanced with the support-
ive and flexible characteristics associated with a human relations
focus. However, if a perceived emphasis on goal attainment is com-
bined with an emphasis on formalized procedures and rules, this
may create significant no-win situations for employees. In these
situations, if employees follow all of the prescribed rules, the job
often becomes impossible to complete on time. However, if they
knowingly skip or omit rules in order to keep the job running on
time, they risk injuring themselves or others and also risk being
punished by the organization for being negligent and by co-work-
ers for being unsafe or too slow (Lawton, 1998).
Lastly, the employees in the current sample perceived that their
organisations placed a relatively weak emphasis on the values
reflected within the open systems model, such as innovation
and adaptability. This may reflect the fact we were dealing with
Table 1
Safety climate descriptive statistics.
Profile Proportion of respondentsa
(%) Organizational safety climate Supervisory safety climate Co-worker safety climate
M SD M SD M SD
IP 36.5 5.18 .71 5.11 1.11 5.05 .98
IP–RG 21 4.87 .96 4.76 1.07 4.88 1.01
HR–RG 12.5 5.45 .75 5.81 .86 5.54 .84
HR 15 5.48 .59 5.83 .75 5.32 .92
a
In total 85% of cases (n = 263) could be classified into one of the four modal profiles.
Table 2
Frequency of recorded incidents for each modal profile group.
Variable Profile Recorded incidents No recorded incidents Row total
First aid IP 20 (17.7%)*
93 (82.3%) 113
IP–RG 13 (20%) 52 (80%) 65
HR–RG 1 (2.6%) 38 (97.4%) 39
HR 2 (4.3%) 44 (95.7%) 46
Column total 36 227 263 (grand total)
Minor equipment damage IP 14(12.6%) 97 (87.4%) 111
IP–RG 13 (20.6%) 50 (79.4%) 63
HR–RG 1 (2.8%) 35 (97.2%) 36
HR 1 (2.2%) 44 (97.8%) 45
Column total 29 226 255 (grand total)
Minor equipment damage IP 15 (13.6%) 95 (86.4%) 110
IP–RG 10 (15.9%) 53 (84.1%) 63
HR–RG 0 (0%) 36 (100%) 36
HR 3 (6.7%) 42 (93.3%) 45
Column total 28 226 254 (grand total)
*
The percentage of incidents as a function of group size are presented in parentheses.
74 S.K. Colley et al. / Safety Science 51 (2013) 69–76
organisations from high risk industries. It may be difficult for these
organisations to foster innovation and adaptability because the tra-
ditional mindset of the engineers and managers who design, main-
tain and administer safety critical systems focuses on control and
proceduralisation to foster predictability and reliability. This tradi-
tional mindset, while understandable and useful, could create chal-
lenges because any system – safety critical or not – needs to be
able to adapt and respond to unanticipated events through the
application of innovative methodologies and approaches. In further
studies it would be interesting to examine in more detail the rela-
tionships between safety, wellbeing and organisational values that
foster flexibility such as those reflected in the open systems model.
4.1. Limitations
There are several potential limitations with the current study.
First, to our knowledge no previous research has mapped value
profiles in a sample of individuals working in high risk industries
and then linked them to safety. Therefore, the identification of
value profiles in the current study was largely exploratory and
additional research is required to assess whether the pattern of
profiles identified is replicable and whether their relationship with
safety outcomes is reliable. Whilst the sample was drawn from a
range of different high risk industries, the sample was relatively
small and it was heavily weighted towards mining. Furthermore
28% of the 368 responses were not included in any of the profiles
due to incomplete or missing data (16%) or not fitting any of the
profiles (12%). As a result, the sample may not be representative
of individuals working in high risk industries in developed econo-
mies more broadly, and we do not know how widely the results
will generalize.
Second, the variables were conceptualized and measured at the
individual level. Values and climate are multi-level constructs
(Klein and Kozlowski, 2000). Perceptions of values and climate
may be shared amongst individuals within groups or within orga-
nizations. In principle, one could examine the effects of variability
in value profiles at the level of the individual, group, and organiza-
tion. The effects of value profiles on safety outcomes may differ
across levels of analysis.
Third, all measures were collected at the same time point. It
would be beneficial to use a lagged data collection design, whereby
culture measures are collected at one time point, then climate
measures and incident data are collected at a later time point. This
design would enable the causal direction of the proposed relation-
ships between culture and safety to be more rigorously examined.
Finally, the study relied upon a single source of data. This can
create an issue of common method variance which has the poten-
tial to inflate the relationship between variables. Podsakoff et al.
(2003), however, suggest that common method variance is reduced
when the measurement of the predictor and criterion variables are
separated methodologically. In the current study, we minimized
the effects of common method variance by using different response
formats for the predictor and criterion. Furthermore, the scores on
the predictor variable (i.e., culture) were not directly used to pre-
dict the criterion variables (i.e., safety climate and incidents). In-
stead, we grouped individuals into cultural profile groups and
then statistically compared these groups. The procedure makes it
less likely that the mind-set of the participant biased the observed
relationship between cultural profile group and safety climate per-
ceptions and incidents.
4.2. Implications and conclusions
Organizations working in high risk industries are subject to
competing demands. These include balancing a concern for
employee well-being with the need for goal attainment, and
balancing the need for stability and control with the need for adap-
tation and change. Our results suggest that perceptions of safety
climate are sensitive to the relative emphasis that is placed on
these competing values. Traditionally, researchers have empha-
sized the role of tradeoffs between employee well-being and goal
attainment as a source of safety climate perceptions (Zohar and
Luria, 2004). Within our sample, at least, it appears that employee
well-being and goal attainment are not necessarily competing
values, and can co-exist. Instead, the major tradeoff that we have
observed is between employee well-being and managerial control.
There were no profiles in which the internal process model co-ex-
isted with the human relations model. This creates a challenge for
organizations with a strong emphasis on internal processes, if they
want to improve safety climate. As noted by Zammuto et al. (2000),
interventions that are inconsistent with the dominant values with-
in an organization tend to be subverted. It is an open question as to
whether organizations that value managerial control can produce a
meaningful improvement in safety climate, without fundamentally
changing their values. Values provide the context within which
perceptions of safety climate develop, and thus, may shape or con-
strain the types of interventions that can be used to improve work-
place safety.
References
Barling, J., Loughlin, C., Kelloway, E.K., 2002. Development and test of a model
linking safety-specific transformational leadership and occupational safety.
Journal of Applied Psychology 87 (3), 488–496.
Cattell, R.B., 1967. The three basic factor analysis research designs: their
interrelations and derivatives. In: Jackson, D.N., Messick, S. (Eds.), Problems in
Human Assessment. McGraw Hill, New York.
Christian, M.S., Bradley, J.C., Wallace, J.C., Burke, M.J., 2009. Workplace safety: a
meta-analysis of the roles of person and situation factors. Journal of Applied
Psychology 94, 1103–1127.
Clarke, S., 2006. The relationship between safety climate and safety performance: a
meta-analytic review. Journal of Occupational Health Psychology 11 (4), 315–
327.
Conway, H., Svenson, J., 1998. Occupational injury and illness rates, 1992–1996.
Monthly Labor Review 121 (11), 36–58.
Deci, E.L., Ryan, R.R., 1987. The support of autonomy and the control of behavior.
Journal of Personality and Social Psychology 53 (6), 1024–1037.
Denison, D.R., Spreitzer, G., 1991. Organizational culture and organizational
development: a competing-values approach. In: Woodman, R.W., Passmore,
W.A. (Eds.), Research in Organizational Change and Development, fifth ed. JAI
Press, Greenwich, pp. 1–21.
Diaz-Cabrera, D., Hernandez-Fernaud, E., Isla-Diaz, R., 2007. An evaluation of a new
instrument to measure organisational safety culture values and practices.
Accident Analysis and Prevention 39, 1202–1211.
Gifford, B.D., Zammuto, R.F., Goodman, E.A., Hill, K.S., 2002. The relationship
between hospital unit culture and nurses’ quality of work life/Practitioner
application. Journal of Healthcare Management 47 (1), 13–25.
Griffin, M.A., Neal, A., 2000. Perceptions of safety at work: a framework for linking
safety climate to safety performance, knowledge and motivation. Journal of
Occupational Health Psychology 5 (3), 347–358.
Griffin, M.A., Neal, A., Parker, S.K., 2007. A new model of work role performance:
positive behavior in uncertain and interdependent contexts. Academy of
Management Journal 50 (2), 327–347.
Hesketh, B., Neal, A., 1999. Technology and performance. In: Ilgen, D., Pukalos, E.
(Eds.), The Changing Nature of Work Performance: Implications for Staffing,
Personnel Actions, and Development. Jossey Bass, San Francisco.
Humphrey, S.E., Nahrgang, J.D., Morgeson, F.P., 2007. Integrating motivational,
social, and contextual work design features: a meta-analytic summary and
theoretical extension of the work design literature. Journal of Applied
Psychology 92 (5), 1332–1356.
James, L.A., James, L.R., 1989. Integrating work environment perceptions:
explorations into the measurement of meaning. Journal of Applied Psychology
74, 739–751.
Jones, R.A., Jimmieson, N.L., Griffiths, A., 2005. The impact of organizational culture
and reshaping capabilities on change implementation success: the mediating
role of readiness for change. Journal of Management Studies 42 (2), 361–386.
Kabanoff, B., Waldersee, R., Cohen, M., 1995. Espoused values and organizational
change themes. Academy of Management Journal 38, 1075–1104.
Kim, S.K., Frisby, C.L., Davison, M.L., 2004. Estimating cognitive profiles using profile
analysis via multidimensional scaling (PAMS). Multivariate Behavioral Research
39 (4), 505–624.
Klein, K.J., Kozlowski, S.W.J., 2000. Multilevel Theory, Research, and Methods in
Organizations: Foundations, Extensions, and New Directions. Jossey-Bass/
Pfeiffer, San Francisco, CA.
S.K. Colley et al. / Safety Science 51 (2013) 69–76 75
Lawton, R., 1998. Not working to rule: understanding procedural violations at work.
Safety Science 28 (2), 77–95.
Mearns, K., Flin, R., Gordon, R., Fleming, M., 1998. Measuring safety climate on
offshore installations. Work & Stress 12 (3), 238–254.
Mearns, K., Whitaker, S.M., Flin, R., 2003. Safety climate, safety management
practice and safety performance in offshore environments. Safety Science 41
(8), 641–680.
Mearns, K., Hope, L., Ford, M.T., Tetrick, L.E., 2010. Investment in workforce health:
exploring the implications for workforce safety climate and commitment.
Accident Analysis & Prevention 42 (5), 1445–1454.
Morgan, G., 1986. Images of organization. Sage Publications, London.
Morrow, P.C., Crum, M.R., 2004. Antecedents of fatigue, close calls, and crashes
among commercial motor-vehicle drivers. Journal of Safety Research 35 (1), 59–
69.
Nahrgang, J.D., Morgeson, F.P., Hofmann, D.A., 2011. Safety at work: a meta-analytic
investigation of the link between job demands, job resources, burnout,
engagement, and safety outcomes. Journal of Applied Psychology 96 (1), 71–94.
Neal, A., Griffin, M.A., Hart, P.M., 2000. The impact of organizational climate on
safety climate and individual behavior. Safety Science 34 (1–3), 99–109.
Parker, R., Bradley, L., 2000. Organizational culture in the public sector: Evidence
from six organizations. The International Journal of Public Sector Management
13 (2), 125–141.
Parker, S.K., Axtell, C.M., Turner, N., 2001. Designing a safer workplace: importance
of job autonomy, communication quality, and supportive supervisors. Journal of
Occupational Health Psychology 6 (3), 211–228.
Parker, S.K., Turner, N., Griffin, M.A., 2003. Designing healthy work. In: Hofmann,
D.A., Tetrick, L.E. (Eds.), Health and Safety in Organizations: A Multi-level
Perspective. Jossey-Bass, California, pp. 91–130.
Perrow, C., 1979. Complex Organizations. Scott, Foresman, USA.
Podsakoff, P.M., MacKenzie, S.B., Lee, J.Y., Podsakoff, N.P., 2003. Common method
biases in behavioral research: a critical review of the literature and
recommended remedies. Journal of Applied Psychology 88 (5), 879–903.
Pritchard, D.A., Livingston, R.B., Reynolds, C.R., Moses, J.A., 2000. Modal profiles for
the WISC-III. School Psychology 15 (4), 400–418.
Quinn, R.E., Rohrbaugh, J., 1983. A spatial model of effectiveness criteria: towards a
competing values approach to organizational analysis. Management Science 29,
363–377.
Quinn, R.E., Spreitzer, G.M., 1991. The psychometrics of the competing values
culture instrument and an analysis of the impact of organizational culture on
quality of life. Research in Organizational Change and Development 5, 115–142.
Reason, J., 1990. Human Error. Cambridge University Press.
Reason, J., 1997. Managing the Risks of Organisational Accidents. Ashgate,
Hampshire, England.
Reiman, T., Oedewald, P., 2004. Measuring maintenance culture and maintenance
core task with CULTURE-questionnaire – a case study in the power industry.
Safety Science 42, 859–889.
Reiman, T., Oedewald, P., Rollenhagen, C., 2005. Characteristics of organizational
culture at the maintenance units of two Nordic nuclear power plants. Reliability
Engineering and System Safety 89, 331–345.
Silva, S., Lima, M.L., Baptista, C., 2004. OSCI: an organisational and safety climate
inventory. Safety Science 42, 205–220.
Siu, O., Phillips, D.R., Leung, T., 2004. Safety climate and safety performance among
construction workers in Hong Kong: the role of psychological strains as
mediators. Accident Analysis & Prevention 36 (3), 359–366.
Turner, N., Chmiel, N., Walls, M., 2005. Railing for safety: job demands, job control,
and safety citizenship role definition. Journal of Occupational Health
Psychology 10 (4), 504–512.
Wagenaar, W.A., Groeneweg, J., 1987. Accidents at sea: multiple causes and
impossible consequences. International Journal of Man-Machine Studies 27,
587–598.
Wallace, C., Chen, G., 2006. A multi-level integration of personality, climate, self-
regulation and performance. Personnel Psychology 59, 529–557.
Wallace, J.C., Popp, E., Mondore, S., (2006). Safety climate as a mediator between
foundation climates and occupational accidents: a group-level investigation.
Journal of Applied Psychology 91 (3), 681–688. http://dx.doi.org/10.1037/0021-
9010.91.3.681.
Wright, C., 1986. Routine deaths: fatal accidents in the oil industry. Sociological
Review 34 (1), 265–289.
Zacharatos, A., Barling, J., Iverson, R.D., 2005. High-performance work systems and
occupational safety. Journal of Applied Psychology 90 (1), 77–93.
Zammuto, R.F., Krakower, J.Y., 1991. Quantitative and qualitative studies of
organizational culture. In: Woodman, R.W., Passmore, W.A. (Eds.), Research in
Organizational Change and Development, vol. 5. JAI Press, Greenwich, CT, pp.
83–114.
Zammuto, R.F., Gifford, B., Goodman, E.A., 2000. Managerial ideologies:
organizational culture, and the outcomes of innovation: a competing
values perspective. In: Ashkanasy, N., Wilderon, C., Peterson, M. (Eds.),
Organizational Culture and Climate. Sage, Thousand Oaks, CA,
pp. 261–278.
Zohar, D., 2000. A group-level model of safety climate: testing the effect of group
climate on microaccidents in manufacturing jobs. Journal of Applied Psychology
85 (4), 587–596.
Zohar, D., 2010. Thirty years of safety climate research: reflections and future
directions. Accident Analysis and Prevention 42, 1517–1522.
Zohar, D., Luria, G., 2004. Climate as a social-cognitive construction of supervisory
safety practices: scripts as proxy of behavior patterns. Journal of Applied
Psychology 89, 322–333.
Zohar, D., Luria, G., 2005. A multilevel model of safety climate: cross-level
relationships between organization and group-level climates. Journal of
Applied Psychology 90 (4), 616–628.
76 S.K. Colley et al. / Safety Science 51 (2013) 69–76

More Related Content

What's hot

Operationalizing Safety II - Resilience Learning Network - January 10, 2013
Operationalizing Safety II - Resilience Learning Network - January 10, 2013Operationalizing Safety II - Resilience Learning Network - January 10, 2013
Operationalizing Safety II - Resilience Learning Network - January 10, 2013Springboard Labs
 
XXI World Congress Safety and Health at Work: Safety Capital and Safety Parti...
XXI World Congress Safety and Health at Work: Safety Capital and Safety Parti...XXI World Congress Safety and Health at Work: Safety Capital and Safety Parti...
XXI World Congress Safety and Health at Work: Safety Capital and Safety Parti...Dr Lilis Surienty
 
WCSH2017 Poster SMEs and OSHMS
WCSH2017 Poster SMEs and OSHMSWCSH2017 Poster SMEs and OSHMS
WCSH2017 Poster SMEs and OSHMSDr Lilis Surienty
 
Effects of tidy/messy work environment on human accuracy
Effects of tidy/messy work environment on human accuracyEffects of tidy/messy work environment on human accuracy
Effects of tidy/messy work environment on human accuracyBlaqXIII
 
Operationalizing Safety II Using Participatory Action Research
Operationalizing Safety II Using Participatory Action ResearchOperationalizing Safety II Using Participatory Action Research
Operationalizing Safety II Using Participatory Action ResearchSpringboard Labs
 
Gagne´ Forest 2008 The study of compensation systems through the lens of self...
Gagne´ Forest 2008 The study of compensation systems through the lens of self...Gagne´ Forest 2008 The study of compensation systems through the lens of self...
Gagne´ Forest 2008 The study of compensation systems through the lens of self...Labour Market Reform Commission
 
Change management by neurological aspects of organizational behaviour
Change management by neurological aspects of organizational behaviourChange management by neurological aspects of organizational behaviour
Change management by neurological aspects of organizational behaviourIAEME Publication
 
A taxonomy of organizational justice theories
A taxonomy of organizational justice theoriesA taxonomy of organizational justice theories
A taxonomy of organizational justice theoriesneferjuli
 
Organizational Behavior
Organizational BehaviorOrganizational Behavior
Organizational Behaviorguest5e0c7e
 
Well Being, Fairness, and Supervisor’s Ability and Support
Well Being, Fairness, and Supervisor’s Ability and Support Well Being, Fairness, and Supervisor’s Ability and Support
Well Being, Fairness, and Supervisor’s Ability and Support IJSRP Journal
 
The Effect of Perceived Organizational Support and Safety Climate on Voluntar...
The Effect of Perceived Organizational Support and Safety Climate on Voluntar...The Effect of Perceived Organizational Support and Safety Climate on Voluntar...
The Effect of Perceived Organizational Support and Safety Climate on Voluntar...Waqas Tariq
 
Human resource dimensions for environment management system
Human resource dimensions for environment management systemHuman resource dimensions for environment management system
Human resource dimensions for environment management systemAlexander Decker
 
Ethical leadership and reputation combined indirect effects
Ethical leadership and reputation combined indirect effectsEthical leadership and reputation combined indirect effects
Ethical leadership and reputation combined indirect effectsaman39650
 
Safety management and organizational performance of selected manufacturing fi...
Safety management and organizational performance of selected manufacturing fi...Safety management and organizational performance of selected manufacturing fi...
Safety management and organizational performance of selected manufacturing fi...AJHSSR Journal
 
Entrepreneurial self efficacy refining the measure-jeffery mcgee
Entrepreneurial self efficacy refining the measure-jeffery mcgeeEntrepreneurial self efficacy refining the measure-jeffery mcgee
Entrepreneurial self efficacy refining the measure-jeffery mcgeeMalthufullah Mu'asyir
 
effect of ergonomical factors on the employees
effect of ergonomical factors on the employeeseffect of ergonomical factors on the employees
effect of ergonomical factors on the employeesINFOGAIN PUBLICATION
 

What's hot (17)

Operationalizing Safety II - Resilience Learning Network - January 10, 2013
Operationalizing Safety II - Resilience Learning Network - January 10, 2013Operationalizing Safety II - Resilience Learning Network - January 10, 2013
Operationalizing Safety II - Resilience Learning Network - January 10, 2013
 
XXI World Congress Safety and Health at Work: Safety Capital and Safety Parti...
XXI World Congress Safety and Health at Work: Safety Capital and Safety Parti...XXI World Congress Safety and Health at Work: Safety Capital and Safety Parti...
XXI World Congress Safety and Health at Work: Safety Capital and Safety Parti...
 
WCSH2017 Poster SMEs and OSHMS
WCSH2017 Poster SMEs and OSHMSWCSH2017 Poster SMEs and OSHMS
WCSH2017 Poster SMEs and OSHMS
 
Effects of tidy/messy work environment on human accuracy
Effects of tidy/messy work environment on human accuracyEffects of tidy/messy work environment on human accuracy
Effects of tidy/messy work environment on human accuracy
 
Operationalizing Safety II Using Participatory Action Research
Operationalizing Safety II Using Participatory Action ResearchOperationalizing Safety II Using Participatory Action Research
Operationalizing Safety II Using Participatory Action Research
 
5 organization commitment
5 organization commitment5 organization commitment
5 organization commitment
 
Gagne´ Forest 2008 The study of compensation systems through the lens of self...
Gagne´ Forest 2008 The study of compensation systems through the lens of self...Gagne´ Forest 2008 The study of compensation systems through the lens of self...
Gagne´ Forest 2008 The study of compensation systems through the lens of self...
 
Change management by neurological aspects of organizational behaviour
Change management by neurological aspects of organizational behaviourChange management by neurological aspects of organizational behaviour
Change management by neurological aspects of organizational behaviour
 
A taxonomy of organizational justice theories
A taxonomy of organizational justice theoriesA taxonomy of organizational justice theories
A taxonomy of organizational justice theories
 
Organizational Behavior
Organizational BehaviorOrganizational Behavior
Organizational Behavior
 
Well Being, Fairness, and Supervisor’s Ability and Support
Well Being, Fairness, and Supervisor’s Ability and Support Well Being, Fairness, and Supervisor’s Ability and Support
Well Being, Fairness, and Supervisor’s Ability and Support
 
The Effect of Perceived Organizational Support and Safety Climate on Voluntar...
The Effect of Perceived Organizational Support and Safety Climate on Voluntar...The Effect of Perceived Organizational Support and Safety Climate on Voluntar...
The Effect of Perceived Organizational Support and Safety Climate on Voluntar...
 
Human resource dimensions for environment management system
Human resource dimensions for environment management systemHuman resource dimensions for environment management system
Human resource dimensions for environment management system
 
Ethical leadership and reputation combined indirect effects
Ethical leadership and reputation combined indirect effectsEthical leadership and reputation combined indirect effects
Ethical leadership and reputation combined indirect effects
 
Safety management and organizational performance of selected manufacturing fi...
Safety management and organizational performance of selected manufacturing fi...Safety management and organizational performance of selected manufacturing fi...
Safety management and organizational performance of selected manufacturing fi...
 
Entrepreneurial self efficacy refining the measure-jeffery mcgee
Entrepreneurial self efficacy refining the measure-jeffery mcgeeEntrepreneurial self efficacy refining the measure-jeffery mcgee
Entrepreneurial self efficacy refining the measure-jeffery mcgee
 
effect of ergonomical factors on the employees
effect of ergonomical factors on the employeeseffect of ergonomical factors on the employees
effect of ergonomical factors on the employees
 

Similar to Safety Science Paper 2

Questions for the article ----Safety Climate How can you measure .docx
Questions for the article ----Safety Climate How can you measure .docxQuestions for the article ----Safety Climate How can you measure .docx
Questions for the article ----Safety Climate How can you measure .docxmakdul
 
Organisational climate and corporate performance
Organisational climate and corporate performanceOrganisational climate and corporate performance
Organisational climate and corporate performanceAlexander Decker
 
Organisational climate and corporate performance
Organisational climate and corporate performanceOrganisational climate and corporate performance
Organisational climate and corporate performanceAlexander Decker
 
Democratic Leadership Styles and Industrial Relations Atmosphere of Some Sele...
Democratic Leadership Styles and Industrial Relations Atmosphere of Some Sele...Democratic Leadership Styles and Industrial Relations Atmosphere of Some Sele...
Democratic Leadership Styles and Industrial Relations Atmosphere of Some Sele...ijtsrd
 
The relationship between quality of work life and performance of the managers...
The relationship between quality of work life and performance of the managers...The relationship between quality of work life and performance of the managers...
The relationship between quality of work life and performance of the managers...Alexander Decker
 
www.occupationalhazards.com May 2005 Occupational Hazards 43.docx
www.occupationalhazards.com May 2005  Occupational Hazards 43.docxwww.occupationalhazards.com May 2005  Occupational Hazards 43.docx
www.occupationalhazards.com May 2005 Occupational Hazards 43.docxericbrooks84875
 
Face Construct And Criterion-Related Validity Essay
Face Construct And Criterion-Related Validity EssayFace Construct And Criterion-Related Validity Essay
Face Construct And Criterion-Related Validity EssayDeb Birch
 
SF 470Assignment #3For this assignment you are to read the.docx
SF 470Assignment #3For this assignment you are to read the.docxSF 470Assignment #3For this assignment you are to read the.docx
SF 470Assignment #3For this assignment you are to read the.docxlesleyryder69361
 
Quantitative Research Study "employees’ job satisfaction, commitment, job saf...
Quantitative Research Study "employees’ job satisfaction, commitment, job saf...Quantitative Research Study "employees’ job satisfaction, commitment, job saf...
Quantitative Research Study "employees’ job satisfaction, commitment, job saf...Muhammad Yasir Arslan, MIEAust CPEng PMP MBA
 
Work-related Stress assessment : an organizational approach
Work-related Stress assessment : an organizational approachWork-related Stress assessment : an organizational approach
Work-related Stress assessment : an organizational approachStefano Fiaschi
 
E263953
E263953E263953
E263953aijbm
 
Consider two companies United States Steel (X) and Facebook (FB)..docx
Consider two companies United States Steel (X) and Facebook (FB)..docxConsider two companies United States Steel (X) and Facebook (FB)..docx
Consider two companies United States Steel (X) and Facebook (FB)..docxaidaclewer
 
theoretical-models-SAFETY.pdf
theoretical-models-SAFETY.pdftheoretical-models-SAFETY.pdf
theoretical-models-SAFETY.pdfprasad977251
 
Change management by neurological aspects of organizational behaviour
Change management by neurological aspects of organizational behaviourChange management by neurological aspects of organizational behaviour
Change management by neurological aspects of organizational behaviourIAEME Publication
 
Notes for question please no plag use references to cite wk 2 .docx
Notes for question please no plag use references to cite wk 2 .docxNotes for question please no plag use references to cite wk 2 .docx
Notes for question please no plag use references to cite wk 2 .docxcherishwinsland
 
A Comparative Analysis of Organizational Structure and Effectiveness between ...
A Comparative Analysis of Organizational Structure and Effectiveness between ...A Comparative Analysis of Organizational Structure and Effectiveness between ...
A Comparative Analysis of Organizational Structure and Effectiveness between ...inventionjournals
 
Safety ManagementSafety ManagementSCorporateCulture.docx
Safety ManagementSafety ManagementSCorporateCulture.docxSafety ManagementSafety ManagementSCorporateCulture.docx
Safety ManagementSafety ManagementSCorporateCulture.docxanhlodge
 

Similar to Safety Science Paper 2 (20)

Questions for the article ----Safety Climate How can you measure .docx
Questions for the article ----Safety Climate How can you measure .docxQuestions for the article ----Safety Climate How can you measure .docx
Questions for the article ----Safety Climate How can you measure .docx
 
Organisational climate and corporate performance
Organisational climate and corporate performanceOrganisational climate and corporate performance
Organisational climate and corporate performance
 
Organisational climate and corporate performance
Organisational climate and corporate performanceOrganisational climate and corporate performance
Organisational climate and corporate performance
 
Democratic Leadership Styles and Industrial Relations Atmosphere of Some Sele...
Democratic Leadership Styles and Industrial Relations Atmosphere of Some Sele...Democratic Leadership Styles and Industrial Relations Atmosphere of Some Sele...
Democratic Leadership Styles and Industrial Relations Atmosphere of Some Sele...
 
The relationship between quality of work life and performance of the managers...
The relationship between quality of work life and performance of the managers...The relationship between quality of work life and performance of the managers...
The relationship between quality of work life and performance of the managers...
 
The relationship between quality of work life and performance of the managers...
The relationship between quality of work life and performance of the managers...The relationship between quality of work life and performance of the managers...
The relationship between quality of work life and performance of the managers...
 
I037054058
I037054058I037054058
I037054058
 
www.occupationalhazards.com May 2005 Occupational Hazards 43.docx
www.occupationalhazards.com May 2005  Occupational Hazards 43.docxwww.occupationalhazards.com May 2005  Occupational Hazards 43.docx
www.occupationalhazards.com May 2005 Occupational Hazards 43.docx
 
Face Construct And Criterion-Related Validity Essay
Face Construct And Criterion-Related Validity EssayFace Construct And Criterion-Related Validity Essay
Face Construct And Criterion-Related Validity Essay
 
SF 470Assignment #3For this assignment you are to read the.docx
SF 470Assignment #3For this assignment you are to read the.docxSF 470Assignment #3For this assignment you are to read the.docx
SF 470Assignment #3For this assignment you are to read the.docx
 
Quantitative Research Study "employees’ job satisfaction, commitment, job saf...
Quantitative Research Study "employees’ job satisfaction, commitment, job saf...Quantitative Research Study "employees’ job satisfaction, commitment, job saf...
Quantitative Research Study "employees’ job satisfaction, commitment, job saf...
 
Work-related Stress assessment : an organizational approach
Work-related Stress assessment : an organizational approachWork-related Stress assessment : an organizational approach
Work-related Stress assessment : an organizational approach
 
E263953
E263953E263953
E263953
 
Consider two companies United States Steel (X) and Facebook (FB)..docx
Consider two companies United States Steel (X) and Facebook (FB)..docxConsider two companies United States Steel (X) and Facebook (FB)..docx
Consider two companies United States Steel (X) and Facebook (FB)..docx
 
theoretical-models-SAFETY.pdf
theoretical-models-SAFETY.pdftheoretical-models-SAFETY.pdf
theoretical-models-SAFETY.pdf
 
Change management by neurological aspects of organizational behaviour
Change management by neurological aspects of organizational behaviourChange management by neurological aspects of organizational behaviour
Change management by neurological aspects of organizational behaviour
 
Notes for question please no plag use references to cite wk 2 .docx
Notes for question please no plag use references to cite wk 2 .docxNotes for question please no plag use references to cite wk 2 .docx
Notes for question please no plag use references to cite wk 2 .docx
 
A Comparative Analysis of Organizational Structure and Effectiveness between ...
A Comparative Analysis of Organizational Structure and Effectiveness between ...A Comparative Analysis of Organizational Structure and Effectiveness between ...
A Comparative Analysis of Organizational Structure and Effectiveness between ...
 
SMART_Newsletter_Vol4_Iss2
SMART_Newsletter_Vol4_Iss2SMART_Newsletter_Vol4_Iss2
SMART_Newsletter_Vol4_Iss2
 
Safety ManagementSafety ManagementSCorporateCulture.docx
Safety ManagementSafety ManagementSCorporateCulture.docxSafety ManagementSafety ManagementSCorporateCulture.docx
Safety ManagementSafety ManagementSCorporateCulture.docx
 

Safety Science Paper 2

  • 1. An examination of the relationship amongst profiles of perceived organizational values, safety climate and safety outcomes Sarah K. Colley a , Jonathan Lincolne b , Andrew Neal a,⇑ a The University of Queensland, Brisbane, Australia b Pockets of Brilliance, Brisbane, Australia a r t i c l e i n f o Article history: Received 11 July 2011 Received in revised form 18 May 2012 Accepted 3 June 2012 Available online 21 July 2012 Keywords: Occupational safety Safety climate Occupational accidents/incidents Well-being Competing Values Framework a b s t r a c t The aim of the current study was to understand how different patterns of perceived organizational values are related to safety. We surveyed individuals working in high risk industries, assessing perceptions of organizational values, psychological safety climate and safety incidents. Modal Profile Analysis (MPA) identified four commonly perceived profiles across the sample. Results from a one-way MANOVA indi- cated that individuals who perceived that their organization strongly emphasizes either: (a) employee well-being (a human relations profile); or (b) employee well-being in conjunction with goal attainment (a joint human relations–rational goal profile); reported higher levels of safety climate and fewer safety incidents. Individuals who perceived that their organization strongly emphasizes either: (a) formal pro- cesses and procedures (an internal process profile); or (b) formal processes and procedures in conjunction with goal attainment (a joint internal process–rational goal profile), reported lower levels of safety cli- mate and more safety incidents. These findings are discussed in terms of their theoretical contribution to the safety climate literature, and in relation to the practical importance that values play in influencing employee perceptions of safety. Ó 2012 Elsevier Ltd. All rights reserved. 1. Introduction The term ‘‘safety climate’’ refers to perceptions of organiza- tional policies, procedures and practices relating to safety (Neal et al., 2000). A substantial body of research has accumulated in the past 30 years examining the structure of safety climate, and its relationship with outcomes, such as behavior and accidents (Zohar, 2010). Meta-analyses have established that individuals who perceive that their organization values safety are more likely to comply with safety procedures and carry out voluntary activities that enhance the safety of their workplace, and are less likely to be involved in safety incidents (Christian et al., 2009; Clarke, 2006; Nahrgang et al., 2011). These findings show that an individual’s perception of safety climate matters, because it has an influence on their behavior, and ultimately on the risk of injury to them- selves, and their co-workers. Whilst a great deal of research has focussed on the conse- quences of safety climate, less attention has been paid to the ante- cedents of safety climate. In the current study, we examine the role of perceived organizational values as an antecedent of perceived safety climate. Kabanoff et al. (1995) define values as beliefs regarding what is important, either for individuals, or for the orga- nization as a whole. Perceptions of organizational values are important, because they influence the way that employees inter- pret policies, procedures and practices (James and James, 1989). For example, Griffin and Neal (2000) argued that perceptions of safety climate reflect the extent to which employees believe that their personal safety and well-being are valued within the organi- zation. Zohar and Luria (2004) argued that perceptions of safety climate reflect the relative emphasis that employees believe is placed on safety vs productivity. However, there are many attributes that may be valued within an organization. Organiza- tions require a range of values to be effective, many of which are potentially contradictory, such as the need to be both flexible and controllable (Quinn and Rohrbaugh, 1983). The aim of the current paper is to examine the impact that different patterns of perceived organizational values have on perceptions of safety climate and safety incidents. 1.1. Competing Values Framework The Competing Values Framework was developed by Quinn and colleagues to describe the different types of values that orga- nizations require to be effective, and understand the dilemmas that organizations face in managing the inherent tensions among these values (Quinn and Rohrbaugh, 1983). As can be seen from 0925-7535/$ - see front matter Ó 2012 Elsevier Ltd. All rights reserved. http://dx.doi.org/10.1016/j.ssci.2012.06.001 ⇑ Corresponding author. Address: School of Psychology, The University of Queensland, St. Lucia, QLD 4072, Australia. Tel.: +61 7 3300 8630; fax: +61 7 3365 4466. E-mail address: Andrew@psy.uq.edu.au (A. Neal). Safety Science 51 (2013) 69–76 Contents lists available at SciVerse ScienceDirect Safety Science journal homepage: www.elsevier.com/locate/ssci
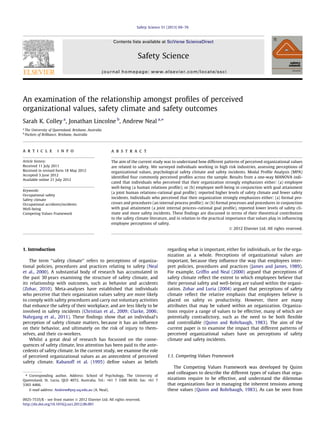
  • 2. Fig. 1, there are two axes representing the competing values of flexibility-control and internal–external focus. The first axis, flex- ibility–control, assesses whether the organization is perceived to have a preference for flexibility or control in the way it is struc- tured and run. The second axis, internal–external focus, assesses whether an organization is perceived to have a preference for focusing its attention inward on the internal dynamics of the organization or outward toward its external environment. The two axes generate four quadrants, each of which constitute a dif- ferent model of effectiveness. Each model describes the different types of outcomes that employees believe are valued, and the means by which they think those outcomes are achieved. Employees who endorse the human relations (HR) model believe that their organization values em- ployee cohesion and morale. The human relations model is charac- terized by a perceived emphasis on trust, participation and teamwork, in addition to employee training and development (Parker and Bradley, 2000; Zammuto and Krakower, 1991). Employees who endorse the open systems (OS) model believe that their organization values growth and resource acquisition. There is a perceived emphasis on adaptability and innovation (Denison and Spreitzer, 1991; Parker and Bradley, 2000). Employees who en- dorse the rational goal (RG) model believe that the organization values productivity and efficiency. There is a perceived emphasis upon planning and goal setting (Denison and Spreitzer, 1991; Parker and Bradley, 2000; Zammuto and Krakower, 1991). The internal process (IP) model values stability, continuity, order and control. The means by which these outcomes are achieved include the use of formal policies, procedures, rules and regulations to guide roles and behavior and create conformity (Denison and Spreitzer, 1991; Gifford et al., 2002; Parker and Bradley, 2000). The Competing Values Framework has been influential within the safety literature, because it provides a way of understanding the competing demands that organizations and individuals need to manage in high risk industries. A number of researchers have used the Competing Values Framework to develop measures of safety climate or safety culture (Diaz-Cabrera et al., 2007; Reiman and Oedewald, 2004; Reiman et al., 2005; Silva et al., 2004). At- tempts to use the Competing Values Framework in this manner have had mixed success, as the hypothesized four factor structure has not always emerged. Furthermore, it has proven difficult to as- sess the effects of trade-offs or tensions amongst competing values using the Likert scale response formats traditionally used in cli- mate or culture surveys (e.g., see Diaz-Cabrera et al., 2007; Silva et al., 2004). In the current study, we take a different approach. Rather than use the Competing Values Framework to develop new measures of safety climate, we use an established measure of competing values that allows one to assess the relative emphasis that an individual believes is placed of different values within the organization. We examine the effects of different patterns of perceived organiza- tional values, by using Modal Profile Analysis (Pritchard et al., 2000) to identify commonly perceived value profiles in a group of individuals working in high risk industries. We then assess whether there are differences in perceptions of safety climate and incidents among individuals reporting different profiles. Flexibility Internal Human Relations Ends: Cohesion and morale Means: Training & development Open communication Participative decision making Other Characteristics: Personal Warm & caring Equity Open Systems Ends: Innovation & development Means: Adaptability & readiness Visionary communication Adaptable decision-making Other Characteristics: Dynamic & entrepreneurial Risk taking Growth & resource acquisition Internal Process Ends: Stability & control Means: Information management Precise communication Data-based decision making Other Characteristics: Formalised and structured Rule enforcement Rules & policies Rational Goal Ends: Efficiency & productivity Means: Goal setting & planning Instructional communication Centralised decision making Other Characteristics: Production orientated Pursuit of goals & objectives Competition & achievements Control ExternalFig. 1. The Competing Values Framework (adapted from Jones et al. (2005) and Parker and Bradley (2000)). 70 S.K. Colley et al. / Safety Science 51 (2013) 69–76
  • 3. 1.2. Profiles of perceived organizational values Proponents of the Competing Values Framework argue that it is important to assess the overall pattern of values that an individual perceives, rather that the effects of individual values, because most workplaces tend to be characterized by a combination of different values (Parker and Bradley, 2000; Quinn and Spreitzer, 1991). Because there are tensions and tradeoffs amongst the different values, the effect of any one value depends on the relative empha- sis that is placed on the other values. It is for this reason that the values described by the Competing Values Framework are assessed using an ipsative scoring system, in which the respondent is forced to choose amongst competing alternatives. When an ipsative mea- sure is used, a response that increases one of the scores reduces one or more of the other scores. The resulting ‘value profile’ de- scribes the relative emphasis that an individual believes is placed on the different values. In the current section, we develop a series of competing hypotheses regarding the relationship between pro- files of perceived values and safety outcomes. One argument that has been developed within the Competing Values Framework is that organizations with a balanced profile tend to perform better than organizations with an unbalanced pro- file (Quinn and Spreitzer, 1991). A balanced profile suggests that people are valued, trained and supported (human relations focus), there are adequate and useful rules and procedures (internal process focus), production goals and targets are appropriate and achievable (rational goal focus) and the system is adaptable, innovative and has up-to-date technologies and equipment (open systems focus). This argument may also apply to safety. All four elements, when in balance, can make a work system safe for individual employees. For example, an emphasis on production (rational goal focus) at the expense of people (human relations focus), is thought to produce a poor safety climate and make accidents more likely (Reason, 1990; Wallace and Chen, 2006). An excessive emphasis on change and innovation (open systems focus) at the expense of stability and control (internal process focus) may expose employees to risks and hazards. These arguments suggest the following: Hypothesis 1. Individuals who perceive that their organization has a balanced value profile, will perceive that their organization has a more positive safety climate, and report fewer incidents, than individuals who perceive that their organization has an imbal- anced value profile. An alternative approach suggests that certain types of values are likely to be associated with better outcomes than others. The dimension of flexibility vs control, in particular, may be critical in relation to safety. We start first with the quadrants emphasizing flexibility. As noted earlier, the belief that the organization values employee well-being (human relations focus) is thought to play an important role in shaping perceptions of safety climate. For example, Neal et al. (2000) found that perceptions of general psychological climate predicted perceptions of safety climate (see Wallace et al. (2006) for similar results at the group level). Zacharatos et al. (2005) found that employees who perceive that their organization uses high commitment work practices, such as teamwork and training, reported higher levels of safety climate and fewer incidents (see also Parker et al., 2001). Mearns and colleagues found that a focus on employee well-being through health promotion and surveillance was associated with positive safety outcomes (Mearns et al., 2003, 2010). However, a belief that the organization values adaptability and innovation (open systems focus) may also have a positive impact on perceptions of safety. Reiman et al. (2005) analyzed the demands placed on employees in maintenance units in nuclear power plants, and argued that the ability to anticipate the state of the plant, and plan and act accordingly are critical for ensuring safe operations. Similar argu- ments have been made by Griffin et al. (2007), who argued that employees working in uncertain environments require both adap- tivity and proactivity. These arguments suggest that people will re- act more effectively to unexpected risks and hazards when they believe there is an emphasis on adaptability, and will act to make the system safer when there is an emphasis on innovation. Turning next to the quadrants emphasizing control, a lack of perceived control on the part of employees is known to have a range of adverse consequences. These include reduced morale, a decreased desire for learning and mastery, and dysfunctional atti- tudes towards work (Deci and Ryan, 1987; Humphrey et al., 2007). In relation to safety climate, employees who perceive that the organization places a heavy emphasis on formal rules and proce- dures (internal process focus) are likely to believe that managers are more concerned with compliance than with the personal safety and welfare of employees (Lawton, 1998; Morgan, 1986). Employ- ees who perceive that the organization places a heavy emphasis on production and service (rational goal focus) may believe that pro- ductivity is more important than people and safety (Wright, 1986). Both perceptions may undermine safety climate. In relation to inci- dents, employees who believe that they have to rigidly adhere to rules and procedures are likely to be less adaptable when they encounter unexpected risks and hazards (Hesketh and Neal, 1999; Perrow, 1979). The perception that managers place a heavy emphasis on achieving goals and targets may place added pressure on employees to rush or take short-cuts to meet production pres- sures (Conway and Svenson, 1998; Wagenaar and Groeneweg, 1987). Both perceptions may lead to an increased risk of errors and incidents. In summary, then, our competing hypothesis is as follows: Hypothesis 2. Individuals who perceive their organization has a profile that strongly emphasises characteristics associated with either a human relations or open systems model will perceive a better safety climate and report fewer incidents than individuals who perceive that their organization has a profile that strongly emphasises characteristics associated with either an internal process or rational goal model. 2. Method 2.1. Participants A total of 368 individuals completed the study survey. Of these 81.6% were male. The mean age of the group was 37.9 years (SD = 10.3, range = 18–62). Participants worked across a range of high risk industries that were based across two Australian states (Queensland and New South Wales). In total 37.5% worked in min- ing, 22% worked in power/electrical, 21.5% worked in engineering/ construction, 7% worked in other/miscellaneous industries, 6% worked in rail, 3% worked in aluminum smelting, and 3% were missing industry information. Initial data checking identified 309 surveys (or 84%) with complete and usable data. The remaining 59 surveys with missing or incomplete data were excluded from analyses. 2.2. Procedure Data was collected from individuals participating in a 2-day long commercial safety training program. Multiple training pro- grams were run, across different companies, over the course of an 8-month period. Approximately 720 participants attended S.K. Colley et al. / Safety Science 51 (2013) 69–76 71
  • 4. training as part of their normal work in groups of up to 15 co- workers. At the completion of the first day of training, the trainers, who were registered psychologists, provided the groups with back- ground information about the survey and detailed instructions on how to complete it. Individuals were then invited to take the sur- vey home to complete and return it the next day. All individuals were informed that participation was voluntary and that no penal- ties would apply should they choose not to complete the survey. The data was collected in a de-identified form. The majority of trainees in each training group who took a survey home returned it completed the following day (completion rate 83%). 2.3. Measures 2.3.1. Perceived organizational values Perceived organizational values were assessed using the 20- item Competing Values Framework measure by Zammuto and Krakower (1991). In this measure there are five categories of ques- tions which relate to: (a) character of the workplace, (b) workplace managers, (c) workplace cohesion, (d) workplace emphasis, and (e) workplace rewards. Under each category there are four statements that relate to each of the models described by the Competing Val- ues Framework (i.e., human relations, open systems, internal pro- cess, and rational goal). Respondents must divide a total of 100 points between the four items in each of the categories. The crite- rion for allocating points is how similar each statement is to their workplace. An example of an item assessing character of the work- place is ‘‘The organization is a very personal place. It is a lot like an extended family. People seem to share a lot of themselves’’. An example of an item assessing workplace cohesion, is ‘‘The glue that holds the organization together is loyalty and tradition. Commit- ment to the organization runs high’’. The mean scores for each model were calculated for each participant. The reliability for the four scales were: internal process a = .78; rational goal a = .70; open systems a = .80; and human relations a = .80. 2.3.2. Perceived safety climate Zohar and Luria (2005) argue that perceptions of safety climate are derived from a range of sources within the organization. In the current study, we assessed perceived safety climate across three sources: organizational, supervisory and co-worker. Perceived organizational safety climate was measured using Neal et al.’s (2000) 19-item measure. This measure assessed perceptions of management values, safety communication, physical work envi- ronment, personnel safety training and safety systems. An example item is ‘‘Safety is given a high priority by management’’. All items were answered on a 7-point Likert scale ranging from 1 (‘‘strongly disagree’’) to 7 (‘‘strongly agree’’). The reliability for this scale was a = .91. Perceived supervisory safety climate was measured using Zohar’s (2000) 10-item measure. This measure assessed supervi- sory action and supervisory expectation. Example items are ‘‘My supervisor approaches workers during work to discuss safety is- sues’’, and ‘‘As long as work remains on schedule, my supervisor doesn’t care how this has been achieved’’. All items were answered on a 7-point Likert scale ranging from 1 (‘‘strongly disagree’’) to 7 (‘‘strongly agree’’). The reliability for this scale was a = .81. Per- ceived co-worker safety climate was measured using an adapted version of Zohar’s (2000) 10-item measure for supervisory safety climate. This measure assessed co-worker action and co-worker expectation. Example items are ‘‘My co-workers approach workers during work to discuss safety issues’’, and ‘‘As long as work re- mains on schedule, my co-workers don’t care how this has been achieved’’. All items were answered on a 7-point Likert scale rang- ing from 1 (‘‘strongly disagree’’) to 7 (‘‘strongly agree’’). The reli- ability for this scale was a = .87. 2.3.3. Incidents Following other researchers, (Barling et al., 2002; Mearns et al., 1998; Morrow and Crum, 2004; Siu et al., 2004) incidents were measured by asking participants to report the number of incidents they had been involved in during the last 2 years that involved first aid treatment, minor equipment damage (less than $1000 damage) and major equipment damage (more than $1000 damage). 3. Results 3.1. Modal Profile Analysis procedure MPA is mathematically equivalent to cluster analysis and Q-fac- tor (participant by participant) principal components analysis (PCA) of profile similarities (Cattell, 1967; Kim et al., 2004). Con- ceptually, MPA identifies replicable patterns of scores within a dataset (Pritchard et al., 2000). In particular, it identifies the most frequently occurring profile shapes (the highs and lows or strengths and weaknesses in a profile) in a dataset which are re- ferred to as ‘modal profiles’ (Kim et al., 2004; Pritchard et al., 2000). Following Pritchard et al. (2000), we first calculated the scale scores for each model for each participant. The vector of four scores for each individual is referred to as the ‘profile of scores’. Each participant’s profile of scores was then correlated with every other participant’s profile of scores. This produced a participant- by-participant inter-correlation matrix. This correlation matrix was submitted to a principal components analysis using varimax rotation to ensure maximum distinction between the resulting modal profiles. The weighted-average profile for each significant factor was then calculated. This profile, called the modal profile, best de- scribes the shape of profiles of individuals with large loadings on that factor. Two weighted average profiles were calculated for each of the retained factor – one for those who loaded positively onto the factor and one for those who loaded negatively onto the factor. The weighted-average profiles are computed by multiplying each individuals profile scores by their loading on the component. Then, the average across all participants who loaded positively onto the factor created one modal profile; and the average of all participants who loaded negatively onto the factor create the mirror-image modal profile. This process was repeated for each of the significant components. Participant profiles were then classified into clusters according to their degree of similarity with each of the modal profiles identi- fied in the above step. This was done by assessing the product-mo- ment correlation between an individual’s profile of scores and each modal profile. The standard similarity (or MAXR P .65) rule was used to classify individuals into clusters. This meant that individu- als were assigned to a cluster or modal profile if the product-mo- ment correlation between their profile of scores and the modal profile was equal to or greater than 0.65. If the person’s profile of scores had a correlation greater than 0.65 with more than one modal profile the individual was assigned to the cluster with which it correlated highest. 3.2. Modal profiles MPA produced four modal profiles. Before classifying individu- als into one of these four profiles, we first conducted a series of one-way ANOVA’s to determine if significant differences existed between these four profiles. These analyses indicated that the modal profiles differed significantly on the human relations (F(3) = 408.82, p < .001), open systems (F(3) = 29.89, p < .001), ra- tional goal (F(3) = 198.16, p < .001) and internal process (F(3) = 938.68, p < .001) models. Given that significant differences 72 S.K. Colley et al. / Safety Science 51 (2013) 69–76
  • 5. existed between the profiles, we applied the MAXR P .65 classifi- cation rule to the sample to classify individuals into one of the four profile groups. This resulted in 85% of participants being classified into one of the four modal profiles. The remaining 15% of unclassi- fied cases were excluded from further analyses. Fig. 2 illustrates the four modal profiles. The first profile was dominated by a strong focus on the internal process model (z = 1.42) and weaker emphasis on the other three models (human relations z = À.56; open systems z = À.82; rational goal z = À.05). We refer to this as the ‘‘internal process profile’’. The internal pro- cess profile was the most frequently occurring profile, representing 36.5% of the sample (n = 113). The second profile represents 21% of the sample (n = 65). This profile was characterized by a strong fo- cus on the internal process (z = 1.05) and rational goal (z = .67) models and a weaker emphasis on the human relations (z = À.86) and open systems models (z = À.86). We refer to this as the ‘‘joint internal process–rational goal profile’’. The third profile represents 12.5% of the sample (n = 39). This profile had a very weak internal process focus (z = À1.32). It was dominated by a strong focus on the human relations (z = 1.09) and rational goal (z = .30) models and an average focus on the open systems model (z = À.06). We refer to this as the ‘‘joint human relations–rational goal profile’’. The final profile represents 15% of the sample (n = 46). This profile was dominated by a strong focus on the human relations model (z = 1.48) and weaker emphasis on the other three models (open systems z = À.29; rational goal z = À.63; internal process z = À.56). We refer to this as the ‘‘human relations profile’’. 3.3. Differences in perceived safety climate across profiles After classifying individuals into the profile groups, we next conducted a one-way MANOVA to investigate whether there were differences among the groups in organizational safety climate, supervisory safety climate and co-worker safety climate. After controlling for age, tenure and length of time working for ones’ supervisor, the combined dependent variables were significantly different across the profile groups (F(9,486) = 4.18, p < .001; Wilk’s Lambda = .834; partial g2 = 0.059). Individual univariate analysis of each dependent variable showed that the profiles differed signifi- cantly in terms of perceived organizational safety climate (F(1,202) = 6.16, p < .001; partial g2 = .084), perceived supervisory safety climate (F(1,202) = 10.52, p < .0001; partial g2 = .132), and perceived co-worker safety climate (F(1,202) = 2.67, p < .04; partial g2 = .04). To follow-up these results, a series of post-hoc analyses were conducted to compare profile means across the three dependent variables (refer to Table 1 for descriptive statistics). Levels of per- ceived organizational safety climate were significantly higher in the HR–RG and HR groups than in the IP–RG group (both p < .05). Levels of perceived supervisory safety climate were significantly higher in the HR–RG and HR groups than in the IP and IP–RG groups (all p < .05). Levels of perceived co-worker safety climate were significantly higher in the HR–RG group than in the IP and IP–RG groups (both p < .05). All other pairwise comparisons were nonsignificant (all p > .05). 3.4. Differences in safety incidents across profiles To examine whether the profiles differed significantly in the fre- quency of reported safety incidents we conducted separate 4 (modal profile) Â 2 (incident/no incident) chi-square analyses for each of the three safety incident categories: first aid incidents, minor equipment damage and major equipment damage. Table 2 shows the frequency of reported incidents (coded as 1 = incidents and 0 = no incidents) for each profile (the percentage of incidents as a function of group size are presented in parentheses). Results from the chi-square analysis indicated there was a significant relationship between cultural profiles and first aid Fig. 2. Modal profiles. S.K. Colley et al. / Safety Science 51 (2013) 69–76 73
  • 6. incidents (v2 (3) = 11.21, p < .05), minor equipment damage (v2 (3) = 11.90, p < .05) and major equipment damage (v2 (3) = 7.60, p < .05). The percentage of individuals who reported experiencing first aid incidents, minor equipment damage and major equipment damage was comparably higher in the IP–RG and IP groups than in the HR and HR–RG groups (see Table 2). 4. Discussion The current study provides insight into the composition of per- ceived value profiles in a sample of individuals working across high risk industries, and the relationship between perceived value pro- files on the one hand, and perceptions of safety climate and safety incidents on the other. Overall, the HR–RG profile performed best or equal best across all six safety measures, while the HR profile performed best or equal best on four of the six measures. The IP profile performed worst or equal worst across four of the six mea- sures, while the IP–RG profile performed worst across all six mea- sures. None of the profiles was fully balanced across all four cultural types. Therefore, the hypothesis that a balanced cultural profile would be associated with better safety could not be directly tested, although it was the case that the most balanced of the four profiles (the HR–RG profile) did perform the best on all six mea- sures. The HR–RG profile had a strong emphasis on both the human relations and rational goal models, together with a moderate emphasis on the open systems model. The common factor between the poorer performing profiles was an emphasis on internal processes, while the common factor be- tween the best performing profiles was an emphasis on human relations. The internal process and human relations models differ in terms of their emphasis on control vs flexibility. There are a number of reasons why a perceived emphasis on control may undermine safety. A lack of perceived control on the part of employees is known to adversely affect morale and limit the desire for learning and development. The overall effect may be to encour- age the development of a passive orientation to safety, in which responsibility for safety is seen as part of someone else’s role, and adaptivity and proactivity are not encouraged (Griffin et al., 2007; Parker et al., 2003; Turner et al., 2005). Unfortunately, one of the common ways in which organizations try to improve safety is by tightening procedures, and mandating compliance (Reason, 1997). Whilst some level of compliance with rules and procedures is necessary, our results suggest that a perceived emphasis on rules and procedures, to the exclusion of other values, may actually be counterproductive. One of the more interesting aspects of the results is the finding that an emphasis on the rational goal model may have different ef- fects on safety outcomes, depending upon the relative emphasis that is placed on the other models. A rational goal focus was asso- ciated with good safety outcomes when it was combined with a human relations focus, but was associated with poor safety out- comes when combined with an internal process focus. This finding suggests that a heavy emphasis on goal attainment may not in and of itself be detrimental to safety, if it is balanced with the support- ive and flexible characteristics associated with a human relations focus. However, if a perceived emphasis on goal attainment is com- bined with an emphasis on formalized procedures and rules, this may create significant no-win situations for employees. In these situations, if employees follow all of the prescribed rules, the job often becomes impossible to complete on time. However, if they knowingly skip or omit rules in order to keep the job running on time, they risk injuring themselves or others and also risk being punished by the organization for being negligent and by co-work- ers for being unsafe or too slow (Lawton, 1998). Lastly, the employees in the current sample perceived that their organisations placed a relatively weak emphasis on the values reflected within the open systems model, such as innovation and adaptability. This may reflect the fact we were dealing with Table 1 Safety climate descriptive statistics. Profile Proportion of respondentsa (%) Organizational safety climate Supervisory safety climate Co-worker safety climate M SD M SD M SD IP 36.5 5.18 .71 5.11 1.11 5.05 .98 IP–RG 21 4.87 .96 4.76 1.07 4.88 1.01 HR–RG 12.5 5.45 .75 5.81 .86 5.54 .84 HR 15 5.48 .59 5.83 .75 5.32 .92 a In total 85% of cases (n = 263) could be classified into one of the four modal profiles. Table 2 Frequency of recorded incidents for each modal profile group. Variable Profile Recorded incidents No recorded incidents Row total First aid IP 20 (17.7%)* 93 (82.3%) 113 IP–RG 13 (20%) 52 (80%) 65 HR–RG 1 (2.6%) 38 (97.4%) 39 HR 2 (4.3%) 44 (95.7%) 46 Column total 36 227 263 (grand total) Minor equipment damage IP 14(12.6%) 97 (87.4%) 111 IP–RG 13 (20.6%) 50 (79.4%) 63 HR–RG 1 (2.8%) 35 (97.2%) 36 HR 1 (2.2%) 44 (97.8%) 45 Column total 29 226 255 (grand total) Minor equipment damage IP 15 (13.6%) 95 (86.4%) 110 IP–RG 10 (15.9%) 53 (84.1%) 63 HR–RG 0 (0%) 36 (100%) 36 HR 3 (6.7%) 42 (93.3%) 45 Column total 28 226 254 (grand total) * The percentage of incidents as a function of group size are presented in parentheses. 74 S.K. Colley et al. / Safety Science 51 (2013) 69–76
  • 7. organisations from high risk industries. It may be difficult for these organisations to foster innovation and adaptability because the tra- ditional mindset of the engineers and managers who design, main- tain and administer safety critical systems focuses on control and proceduralisation to foster predictability and reliability. This tradi- tional mindset, while understandable and useful, could create chal- lenges because any system – safety critical or not – needs to be able to adapt and respond to unanticipated events through the application of innovative methodologies and approaches. In further studies it would be interesting to examine in more detail the rela- tionships between safety, wellbeing and organisational values that foster flexibility such as those reflected in the open systems model. 4.1. Limitations There are several potential limitations with the current study. First, to our knowledge no previous research has mapped value profiles in a sample of individuals working in high risk industries and then linked them to safety. Therefore, the identification of value profiles in the current study was largely exploratory and additional research is required to assess whether the pattern of profiles identified is replicable and whether their relationship with safety outcomes is reliable. Whilst the sample was drawn from a range of different high risk industries, the sample was relatively small and it was heavily weighted towards mining. Furthermore 28% of the 368 responses were not included in any of the profiles due to incomplete or missing data (16%) or not fitting any of the profiles (12%). As a result, the sample may not be representative of individuals working in high risk industries in developed econo- mies more broadly, and we do not know how widely the results will generalize. Second, the variables were conceptualized and measured at the individual level. Values and climate are multi-level constructs (Klein and Kozlowski, 2000). Perceptions of values and climate may be shared amongst individuals within groups or within orga- nizations. In principle, one could examine the effects of variability in value profiles at the level of the individual, group, and organiza- tion. The effects of value profiles on safety outcomes may differ across levels of analysis. Third, all measures were collected at the same time point. It would be beneficial to use a lagged data collection design, whereby culture measures are collected at one time point, then climate measures and incident data are collected at a later time point. This design would enable the causal direction of the proposed relation- ships between culture and safety to be more rigorously examined. Finally, the study relied upon a single source of data. This can create an issue of common method variance which has the poten- tial to inflate the relationship between variables. Podsakoff et al. (2003), however, suggest that common method variance is reduced when the measurement of the predictor and criterion variables are separated methodologically. In the current study, we minimized the effects of common method variance by using different response formats for the predictor and criterion. Furthermore, the scores on the predictor variable (i.e., culture) were not directly used to pre- dict the criterion variables (i.e., safety climate and incidents). In- stead, we grouped individuals into cultural profile groups and then statistically compared these groups. The procedure makes it less likely that the mind-set of the participant biased the observed relationship between cultural profile group and safety climate per- ceptions and incidents. 4.2. Implications and conclusions Organizations working in high risk industries are subject to competing demands. These include balancing a concern for employee well-being with the need for goal attainment, and balancing the need for stability and control with the need for adap- tation and change. Our results suggest that perceptions of safety climate are sensitive to the relative emphasis that is placed on these competing values. Traditionally, researchers have empha- sized the role of tradeoffs between employee well-being and goal attainment as a source of safety climate perceptions (Zohar and Luria, 2004). Within our sample, at least, it appears that employee well-being and goal attainment are not necessarily competing values, and can co-exist. Instead, the major tradeoff that we have observed is between employee well-being and managerial control. There were no profiles in which the internal process model co-ex- isted with the human relations model. This creates a challenge for organizations with a strong emphasis on internal processes, if they want to improve safety climate. As noted by Zammuto et al. (2000), interventions that are inconsistent with the dominant values with- in an organization tend to be subverted. It is an open question as to whether organizations that value managerial control can produce a meaningful improvement in safety climate, without fundamentally changing their values. Values provide the context within which perceptions of safety climate develop, and thus, may shape or con- strain the types of interventions that can be used to improve work- place safety. References Barling, J., Loughlin, C., Kelloway, E.K., 2002. Development and test of a model linking safety-specific transformational leadership and occupational safety. Journal of Applied Psychology 87 (3), 488–496. Cattell, R.B., 1967. The three basic factor analysis research designs: their interrelations and derivatives. In: Jackson, D.N., Messick, S. (Eds.), Problems in Human Assessment. McGraw Hill, New York. Christian, M.S., Bradley, J.C., Wallace, J.C., Burke, M.J., 2009. Workplace safety: a meta-analysis of the roles of person and situation factors. Journal of Applied Psychology 94, 1103–1127. Clarke, S., 2006. The relationship between safety climate and safety performance: a meta-analytic review. Journal of Occupational Health Psychology 11 (4), 315– 327. Conway, H., Svenson, J., 1998. Occupational injury and illness rates, 1992–1996. Monthly Labor Review 121 (11), 36–58. Deci, E.L., Ryan, R.R., 1987. The support of autonomy and the control of behavior. Journal of Personality and Social Psychology 53 (6), 1024–1037. Denison, D.R., Spreitzer, G., 1991. Organizational culture and organizational development: a competing-values approach. In: Woodman, R.W., Passmore, W.A. (Eds.), Research in Organizational Change and Development, fifth ed. JAI Press, Greenwich, pp. 1–21. Diaz-Cabrera, D., Hernandez-Fernaud, E., Isla-Diaz, R., 2007. An evaluation of a new instrument to measure organisational safety culture values and practices. Accident Analysis and Prevention 39, 1202–1211. Gifford, B.D., Zammuto, R.F., Goodman, E.A., Hill, K.S., 2002. The relationship between hospital unit culture and nurses’ quality of work life/Practitioner application. Journal of Healthcare Management 47 (1), 13–25. Griffin, M.A., Neal, A., 2000. Perceptions of safety at work: a framework for linking safety climate to safety performance, knowledge and motivation. Journal of Occupational Health Psychology 5 (3), 347–358. Griffin, M.A., Neal, A., Parker, S.K., 2007. A new model of work role performance: positive behavior in uncertain and interdependent contexts. Academy of Management Journal 50 (2), 327–347. Hesketh, B., Neal, A., 1999. Technology and performance. In: Ilgen, D., Pukalos, E. (Eds.), The Changing Nature of Work Performance: Implications for Staffing, Personnel Actions, and Development. Jossey Bass, San Francisco. Humphrey, S.E., Nahrgang, J.D., Morgeson, F.P., 2007. Integrating motivational, social, and contextual work design features: a meta-analytic summary and theoretical extension of the work design literature. Journal of Applied Psychology 92 (5), 1332–1356. James, L.A., James, L.R., 1989. Integrating work environment perceptions: explorations into the measurement of meaning. Journal of Applied Psychology 74, 739–751. Jones, R.A., Jimmieson, N.L., Griffiths, A., 2005. The impact of organizational culture and reshaping capabilities on change implementation success: the mediating role of readiness for change. Journal of Management Studies 42 (2), 361–386. Kabanoff, B., Waldersee, R., Cohen, M., 1995. Espoused values and organizational change themes. Academy of Management Journal 38, 1075–1104. Kim, S.K., Frisby, C.L., Davison, M.L., 2004. Estimating cognitive profiles using profile analysis via multidimensional scaling (PAMS). Multivariate Behavioral Research 39 (4), 505–624. Klein, K.J., Kozlowski, S.W.J., 2000. Multilevel Theory, Research, and Methods in Organizations: Foundations, Extensions, and New Directions. Jossey-Bass/ Pfeiffer, San Francisco, CA. S.K. Colley et al. / Safety Science 51 (2013) 69–76 75
  • 8. Lawton, R., 1998. Not working to rule: understanding procedural violations at work. Safety Science 28 (2), 77–95. Mearns, K., Flin, R., Gordon, R., Fleming, M., 1998. Measuring safety climate on offshore installations. Work & Stress 12 (3), 238–254. Mearns, K., Whitaker, S.M., Flin, R., 2003. Safety climate, safety management practice and safety performance in offshore environments. Safety Science 41 (8), 641–680. Mearns, K., Hope, L., Ford, M.T., Tetrick, L.E., 2010. Investment in workforce health: exploring the implications for workforce safety climate and commitment. Accident Analysis & Prevention 42 (5), 1445–1454. Morgan, G., 1986. Images of organization. Sage Publications, London. Morrow, P.C., Crum, M.R., 2004. Antecedents of fatigue, close calls, and crashes among commercial motor-vehicle drivers. Journal of Safety Research 35 (1), 59– 69. Nahrgang, J.D., Morgeson, F.P., Hofmann, D.A., 2011. Safety at work: a meta-analytic investigation of the link between job demands, job resources, burnout, engagement, and safety outcomes. Journal of Applied Psychology 96 (1), 71–94. Neal, A., Griffin, M.A., Hart, P.M., 2000. The impact of organizational climate on safety climate and individual behavior. Safety Science 34 (1–3), 99–109. Parker, R., Bradley, L., 2000. Organizational culture in the public sector: Evidence from six organizations. The International Journal of Public Sector Management 13 (2), 125–141. Parker, S.K., Axtell, C.M., Turner, N., 2001. Designing a safer workplace: importance of job autonomy, communication quality, and supportive supervisors. Journal of Occupational Health Psychology 6 (3), 211–228. Parker, S.K., Turner, N., Griffin, M.A., 2003. Designing healthy work. In: Hofmann, D.A., Tetrick, L.E. (Eds.), Health and Safety in Organizations: A Multi-level Perspective. Jossey-Bass, California, pp. 91–130. Perrow, C., 1979. Complex Organizations. Scott, Foresman, USA. Podsakoff, P.M., MacKenzie, S.B., Lee, J.Y., Podsakoff, N.P., 2003. Common method biases in behavioral research: a critical review of the literature and recommended remedies. Journal of Applied Psychology 88 (5), 879–903. Pritchard, D.A., Livingston, R.B., Reynolds, C.R., Moses, J.A., 2000. Modal profiles for the WISC-III. School Psychology 15 (4), 400–418. Quinn, R.E., Rohrbaugh, J., 1983. A spatial model of effectiveness criteria: towards a competing values approach to organizational analysis. Management Science 29, 363–377. Quinn, R.E., Spreitzer, G.M., 1991. The psychometrics of the competing values culture instrument and an analysis of the impact of organizational culture on quality of life. Research in Organizational Change and Development 5, 115–142. Reason, J., 1990. Human Error. Cambridge University Press. Reason, J., 1997. Managing the Risks of Organisational Accidents. Ashgate, Hampshire, England. Reiman, T., Oedewald, P., 2004. Measuring maintenance culture and maintenance core task with CULTURE-questionnaire – a case study in the power industry. Safety Science 42, 859–889. Reiman, T., Oedewald, P., Rollenhagen, C., 2005. Characteristics of organizational culture at the maintenance units of two Nordic nuclear power plants. Reliability Engineering and System Safety 89, 331–345. Silva, S., Lima, M.L., Baptista, C., 2004. OSCI: an organisational and safety climate inventory. Safety Science 42, 205–220. Siu, O., Phillips, D.R., Leung, T., 2004. Safety climate and safety performance among construction workers in Hong Kong: the role of psychological strains as mediators. Accident Analysis & Prevention 36 (3), 359–366. Turner, N., Chmiel, N., Walls, M., 2005. Railing for safety: job demands, job control, and safety citizenship role definition. Journal of Occupational Health Psychology 10 (4), 504–512. Wagenaar, W.A., Groeneweg, J., 1987. Accidents at sea: multiple causes and impossible consequences. International Journal of Man-Machine Studies 27, 587–598. Wallace, C., Chen, G., 2006. A multi-level integration of personality, climate, self- regulation and performance. Personnel Psychology 59, 529–557. Wallace, J.C., Popp, E., Mondore, S., (2006). Safety climate as a mediator between foundation climates and occupational accidents: a group-level investigation. Journal of Applied Psychology 91 (3), 681–688. http://dx.doi.org/10.1037/0021- 9010.91.3.681. Wright, C., 1986. Routine deaths: fatal accidents in the oil industry. Sociological Review 34 (1), 265–289. Zacharatos, A., Barling, J., Iverson, R.D., 2005. High-performance work systems and occupational safety. Journal of Applied Psychology 90 (1), 77–93. Zammuto, R.F., Krakower, J.Y., 1991. Quantitative and qualitative studies of organizational culture. In: Woodman, R.W., Passmore, W.A. (Eds.), Research in Organizational Change and Development, vol. 5. JAI Press, Greenwich, CT, pp. 83–114. Zammuto, R.F., Gifford, B., Goodman, E.A., 2000. Managerial ideologies: organizational culture, and the outcomes of innovation: a competing values perspective. In: Ashkanasy, N., Wilderon, C., Peterson, M. (Eds.), Organizational Culture and Climate. Sage, Thousand Oaks, CA, pp. 261–278. Zohar, D., 2000. A group-level model of safety climate: testing the effect of group climate on microaccidents in manufacturing jobs. Journal of Applied Psychology 85 (4), 587–596. Zohar, D., 2010. Thirty years of safety climate research: reflections and future directions. Accident Analysis and Prevention 42, 1517–1522. Zohar, D., Luria, G., 2004. Climate as a social-cognitive construction of supervisory safety practices: scripts as proxy of behavior patterns. Journal of Applied Psychology 89, 322–333. Zohar, D., Luria, G., 2005. A multilevel model of safety climate: cross-level relationships between organization and group-level climates. Journal of Applied Psychology 90 (4), 616–628. 76 S.K. Colley et al. / Safety Science 51 (2013) 69–76