1. EMIRATES VALUATION UB: 11024086
1
UNIVERSITY OF BRADFORD SCHOOL OF MANAGEMENT
BRADFORD MBA IN DUBAI
UB NUMBER : 11024086
MODULE TUTORS : Patrick Barber
SUBJECT : Emirates Airline Valuation
ASSIGNMENT TITLE : Management Project
DATE SUBMITTED : September 5th, 2014
WORD COUNT : 13,722
(Excluding Appendices, Bibliographies, Tables, Figures, Glossary)
Statement of Authenticity: 'I have read the University Regulations relating to plagiarism
and certify that this assignment is all my own work and does not contain any
unacknowledged work from any other sources'.
2. EMIRATES VALUATION UB: 11024086
2
EMIRATES AIRLINE VALUATION
As of March 31, 2014
Prepared by: Samuel Llenas
September 5th, 2014
3. EMIRATES VALUATION UB: 11024086
3
TABLE OF CONTENTS
1. INTRODUCTION ..............................................................................................................................7
1.1 Purpose .......................................................................................................................................7
1.2 Approach ....................................................................................................................................7
1.3 Limiting Conditions....................................................................................................................7
2. LITERATURE REVIEW ..................................................................................................................8
2.1 The Valuation Concept ...............................................................................................................8
2.2 Valuation Approaches.................................................................................................................9
2.3 Risk and Cost of Equity............................................................................................................ 13
2.4 Valuation in emerging markets................................................................................................. 16
2.5 Application to Emirates Airlines .............................................................................................. 18
3. COMPANY INFORMATION......................................................................................................... 20
3.1 History ...................................................................................................................................... 20
3.2 Operations................................................................................................................................. 20
3.3 Worldwide Presence & Brand Value........................................................................................ 22
3.4 Aircrafts & Growth Plan........................................................................................................... 23
3.5 Passenger Capacity & Seat Factor ............................................................................................ 24
3.6 Human Resources ..................................................................................................................... 25
4. MARKET AND INDUSTRY CONDITIONS ................................................................................ 27
4.1 Economy overview ................................................................................................................... 27
4.2 Gross Domestic Product (GDP)................................................................................................ 27
4.3 Airline Industry overview......................................................................................................... 29
5. FINANCIAL REVIEW.................................................................................................................... 32
5.1 Overview .................................................................................................................................. 32
5.2 Balance sheet analysis .............................................................................................................. 32
5.3 Income statement analysis ........................................................................................................ 41
5.4 Adjustments .............................................................................................................................. 55
5.5 Selected financial ratios............................................................................................................ 56
5.6 Industry comparison ................................................................................................................. 56
6. VALUATION ANALYSIS............................................................................................................... 61
6.1 Asset approach.......................................................................................................................... 61
6.2 Market approach ....................................................................................................................... 62
6.3 Income approach....................................................................................................................... 64
6.4 Value reconciliation.................................................................................................................. 79
7. CONCLUSION................................................................................................................................. 81
8. REFLECTIVE ACCOUNT (MBA)................................................................................................ 83
9. APPENDIX ....................................................................................................................................... 84
9.1 APPENDIX A – Project Proposal............................................................................................. 84
9.2 APPENDIX B – Porter’s Five Forces analysis......................................................................... 88
9.3 APPENDIX C – Financials....................................................................................................... 89
10. BIBLIOGRAPHY........................................................................................................................... 100
4. EMIRATES VALUATION UB: 11024086
4
LIST OF TABLES
Table 5.1: Financial ratios ................................................................................................................................ 56
Table 6.1: Industry multiples ............................................................................................................................ 62
Table 6.2: Market approach valuation .............................................................................................................. 63
Table 6.3: Market approach sensitivity............................................................................................................. 64
Table 6.4: Cost of Equity.................................................................................................................................. 74
Table 6.5: Cost of Capital................................................................................................................................. 75
Table 6.6: Income approach sensitivity ............................................................................................................ 77
5. EMIRATES VALUATION UB: 11024086
5
LIST OF FIGURES
Figure 2.1: Damodaran's DCF Limitations....................................................................................................... 10
Figure 2.2: Risk variables in Business.............................................................................................................. 14
Figure 3.1: Aircraft departures.......................................................................................................................... 21
Figure 3.2: Destination cities ............................................................................................................................ 22
Figure 3.3: Passenger and freight aircrafts........................................................................................................ 23
Figure 3.4: Passenger capacity.......................................................................................................................... 24
Figure 3.5: Human resources ............................................................................................................................ 25
Figure 4. 1: UAE inflation and GDP ................................................................................................................ 27
Figure 4.2: International passengers carried ..................................................................................................... 29
Figure 5.1: Total assets ..................................................................................................................................... 32
Figure 5.2: Operating assets distribution .......................................................................................................... 34
Figure 5.3: Trade and other receivables............................................................................................................ 34
Figure 5.4: Engineering inventory .................................................................................................................... 35
Figure 5. 5 In-flight consumables inventory..................................................................................................... 36
Figure 5.6: Consumer goods inventory............................................................................................................. 36
Figure 5.7: Advance lease rentals ..................................................................................................................... 37
Figure 5.8: Liabilities distribution .................................................................................................................... 38
Figure 5.9: Trade payables & accruals.............................................................................................................. 38
Figure 5.10: Passenger and cargo sales in advance........................................................................................... 39
Figure 5.11: Borrowings and leasing liabilies distribution ............................................................................... 40
Figure 5.12: Revenue........................................................................................................................................ 41
Figure 5.13: Revenue distribution..................................................................................................................... 41
Figure 5.14: Revenue distribution per area....................................................................................................... 42
Figure 5.15: Passenger revenue ........................................................................................................................ 43
Figure 5.16: Average revenue per passenger .................................................................................................... 43
Figure 5.17: Passenger carried.......................................................................................................................... 44
Figure 5. 18: Cargo revenue.............................................................................................................................. 45
Figure 5.19: Cargo carried in tones................................................................................................................... 46
Figure 5.20: Sale of merchandise and other goods ........................................................................................... 47
Figure 5.21: Operational expenses.................................................................................................................... 48
Figure 5.22: Operational expenses distribution ................................................................................................ 48
Figure 5.23: Aircraft operating expenses.......................................................................................................... 49
Figure 5.24: Aircraft operating expenses distribution....................................................................................... 49
6. EMIRATES VALUATION UB: 11024086
6
Figure 5.25: Jet fuel and crude oil prices.......................................................................................................... 50
Figure 5.26: Jet fuel expenses........................................................................................................................... 51
Figure 5.27: General and administrative expenses ........................................................................................... 51
Figure 5.28: Sales and marketing expenses ...................................................................................................... 52
Figure 5.29: EBITDA ....................................................................................................................................... 53
Figure 5.30: Nopat............................................................................................................................................ 54
Figure 5.31: Industry revenue growth............................................................................................................... 57
Figure 5.32: Industry EBITDA margins ........................................................................................................... 57
Figure 5.33: Industry current ratios................................................................................................................... 58
Figure 5.34: Industry days of accounts receivables .......................................................................................... 59
Figure 5.35: Industry days of trade and other payables .................................................................................... 59
Figure 6.1: Net operating assets and net asset value......................................................................................... 61
Figure 6.2: Value drivers .................................................................................................................................. 65
Figure 6.3: Revenue projection......................................................................................................................... 66
Figure 6.4: EBITDA projection ........................................................................................................................ 67
Figure 6.5: Trade receivables projection........................................................................................................... 68
Figure 6.6: Inventory projection ....................................................................................................................... 69
Figure 6.7: Advance lease rentals projection.................................................................................................... 70
Figure 6.8: Trade and other payables projection............................................................................................... 71
Figure 6.9: Working capital changes projection ............................................................................................... 72
Figure 6.10: Capex projection........................................................................................................................... 73
Figure 6.11: Net cash-flow projection .............................................................................................................. 74
Figure 6.12: DCF projection............................................................................................................................. 76
Figure 6.13: Enterprise value............................................................................................................................ 77
Figure 6.14: Equity value.................................................................................................................................. 78
Figure 6.15: Value reconciliation ..................................................................................................................... 79
7. EMIRATES VALUATION UB: 11024086
7
1. INTRODUCTION
1.1 Purpose
The purpose of this report is to establish the fair market value of a 100% interest in the
common stock of Emirates Airline (EA) as of March 31, 2014.
1.2 Approach
The approach chosen was to determine an estimate of value that would provide a fair and
reasonable return on investment to an investor or owner, in view of the facts available at the
time.
The estimate was based upon, among other things, the estimate of the risks facing the
company and the return on investment that would be required on alternative investments
with similar levels of risk. I have applied various valuation methods in estimating the value
of EA as of March 31, 2014.
I have reviewed and analyzed each method and its results to determine which method
generates the most reasonable estimated value of EA. After careful consideration of each
method, underlying assumptions and variables utilized, we concluded that the Discounted
Cash-Flow Method was the most appropriate. Please refer to the sections “Literature
Review” and “Valuation Analysis” of this report for more detail.
Both internal and external factors which influence the value of EA were reviewed, analyzed
and interpreted. Internal factors include the Company’s financial position, results of
operations and the size and marketability of the interest being valued. External factors
include, among other things, the status of the industry and the position of the Company
relative to the industry.
1.3 Limiting Conditions
Although this report will contain some discussion over the Company’s general strategy, the
objective of the report is to estimate the fair market value of the assets; therefore the
concentration will be more on the quantitative side than the qualitative side of the project.
8. EMIRATES VALUATION UB: 11024086
8
2. LITERATURE REVIEW
2.1 The Valuation Concept
The term valuation would seem to be self-descriptive; it simply refers to the act or process
of making a judgment about the price or value of something (Merriam-Webster, 2014). The
key word in the definition of valuation is judgment, as it refers to something of a qualitative
nature and not entirely quantitative like many would assume.
Damodaran (2002) believes that valuation is neither the science that some of its proponents
make it out to be, nor the objective search for the true value that idealists would like it to
become. He also states that even though the models we use in valuation are mostly
quantitative, the inputs we use for them leave plenty of room for subjective judgments.
Pike, Neale & Linsley (2012) add to this by stating that even though the concept of value is
at the heart of financial management, by no means is it an exact science, given the inability
to make precisely accurate business valuations. In other words; valuation has both an
element of science, as well as art, in order to properly assign value to a real estate property,
a company stock or any other asset being valued.
Based on this; it’s fair to assess that valuation is nothing more than the process by which
forecasts of performance are converted into estimates of price (Palepu & Healy, 2000). The
processes that are used to arrive at these estimates have challenged academics, professional
practitioners and company owners in the past and most likely will continue to do so in the
foreseeable future.
Regardless of the process that we use; Copeland’s (2000) view that the value of a
company’s equity is derived from the value of its operations plus non-operating assets, less
the value of its debt and any non-operating liabilities remains valid. However, the judgment
aspect in valuations starts when we define the process or approach that we will use to value
the operations of any given firm.
9. EMIRATES VALUATION UB: 11024086
9
2.2 Valuation Approaches
Valuation approaches can be classified into three categories, which are usually associated
with the income, market and cost approaches, respectively; discounted cash flow valuation
(DCF), relative valuation (RV) and contingent claim valuation (Perek & Perek, 2012).
There is a fourth category usually added to these three categories, account based valuation
(Bertoncel, 2006).
Damodaran (2002) states that each of these approaches embodies different models and
these models often produce significantly different values. He also states that the most
widely used model among these is the discounted cash-flow (DCF) valuation model. In
practice, this mostly due to the fact that most valuations are done under going concern
premises, therefore the ability of their assets to generate cash-flow should be the main
variable analyzed.
Discounted Cash-Flow Model (DCF)
The DCF approach involves the production of detailed, multiple year forecasts of cash
flows, which are later discounted at the firm’s estimated cost of capital to arrive at an
estimated present value (Palepu & Healy, 2000). By calculating the present value of a
future sum, discounting can be used for comparing future cash flows that will not be
received on the same date (Quiry, Dallochio, Le Fur, Salvi, 2009). In short; the DCF model
offers the practitioner added flexibility in the inputs it will use for the assessment of value
that is simply not found in other models.
Since the 1960’s, the DCF model has been the gold standard for a wide range of economic
applications including corporate valuations, capital budgeting decisions, appraising
investment property, and computing loss of business income for litigation (Lawrence,
2009). While this true, there have been some who have proposed the use of accounting
earnings over cash for this analysis.
Penman and Sougiannis (1998) claim that accounting earnings overcome the cash driven
DCF shortcoming of subtracting capital investments from operating cash-flows to estimate
free cash-flows. They believe that this may cause negative free cash flows for many years
10. EMIRATES VALUATION UB: 11024086
10
within projections for a number of companies. Accounting-based valuation models do not
fall prone this shortcoming because they place these investments on the statement of
financial position and match the cost of these investments against inflows generated from
them through depreciation allocations.
Lundholm and O’Keefe (2001) however state that these two models are derived from the
same underlying assumption and the differences in their outcomes imply the difficulty of
applying the same input assumption to different models and conclude that neither of the
models is superior to one another. Although these authors make compelling arguments,
cash could potentially be a much more accurate variable to measure value; based on one
simple principle which Damodaran explains.
Damodaran (2005) states that the assumption on which DCF models are based upon is that
the reason behind a purchase of an asset is the anticipation of collecting cash inflows from
that asset in the future. Thus, in DCF valuations, the value of an asset is determined by
discounting the future expected cash flows to that asset at an appropriate discount rate that
reflects the riskiness involved in the cash flows. The American Accounting Standards
Committee (2001) also agrees that cash flows dominate accounting earnings and, therefore,
the DCF valuation model is preferred over accounting based ones.
The DCF approach however is not without limitations. Damodaran (2002) who based on
the arguments already exposed, is a big proponent of the approach, outlines some of those
limitations:
Figure 2.1: Damodaran's DCF Limitations
11. EMIRATES VALUATION UB: 11024086
11
These limitations along with others are the reason why other valuation approaches exist,
like the case of relative or market oriented approach.
Relative Valuation
The market approach or relative valuation methodology is very popular among
practitioners, especially within M&A activities. Within this approach; the value of an asset
is derived from the pricing of “comparable” assets, standardized using a common variable
such as earnings, cash flows, book value or revenues (Damodaran, 2002). The practical
nature of this approach probably makes it the most approach when buying or selling assets
on a day to day basis.
The main difference between this approach and the DCF is that in most cases, it assumes
that the market is valuing most companies correctly, while the DCF intends to analyze the
specific intrinsic value of the given firm. The selection process of comparable firms for this
approach could also lend itself to be manipulated by analysts and could be quite debatable.
Ideally, price multiples used in a comparable firm analysis are those for firms with similar
operating and financial characteristics, preferably within the same industry (Palepu &
Healy, 2000). However, even similar companies will have different growth strategies and
risk profiles which may affect the selected sample of ratios. Consequently, a biased analyst
can choose a group of comparable firms to confirm his or her biases about a firm’s value
(Damodaran, 2002).
Based on this; the RV approach is probably better suited for value re-conciliation in
combination with the DCF within an income approach valuation process. This is
corroborated by Pike, Neale & Linsley (2012) who state that observers like to compare the
EBITDA with share price for different companies as a cross-check on valuation and that
market-based EBITDA multiples can be used as valuation tools.
Book Value
The premise of value in the majority of valuation exercises are based upon a going concern
basis, therefore income and market approaches tend to be the most appropriate in most
12. EMIRATES VALUATION UB: 11024086
12
cases. However, at times companies need to be evaluated based upon a liquidation premise
or based upon certain contingencies that may affect their value.
When we value a company based on a liquidation premise, then usually book value is the
first reference point. Book value can be defined as the net worth of the firm according to
the balance sheet (Brealey, Myers & Marcus, 2001). This approach attempts to overcome
the DCF shortcoming of not being able to properly evaluate companies that don’t expect to
have positive cash flows in the future, many analysts however state that it should not be
used as a valuation methodology.
Pike, Neale & Linsley (2012) state that using published accounts is fraught with dangers,
under-valuation of fixed assets is very common. Brealey, Myers & Marcus (2001) add to
this by stating that market price need not and generally does not, equal either book value or
liquidation value. This is usually due to the fact that the market may value assets in a very
different way than how accounting might do; the potential existence of intangible assets
could be a good example of this. In the specific example of the Airline industry, the brand
value is an intangible asset that is often valued individually; please see section 3.3 for some
information related to EA’s brand value.
In some developing countries with high income tax regulations, the risks of using book
values can be even riskier. This is due to the fact that adjusting fixed assets regularly may
lead to capital gains which are taxable; therefore they are avoided and manipulated in a
number of cases.
Damodaran (2002) also believes that asset based valuation approaches should not be
considered alternatives to DCF, relative valuation or option pricing models since both
replacement and liquidation values have to be obtained using one or more of these
approaches.
Based on this; Book value should only be used as a reference point, but should be avoided
as a methodology to estimate value in most cases, especially with companies with growth
potential and healthy cash flow streams.
13. EMIRATES VALUATION UB: 11024086
13
Summary
Although the DCF approach is widely recognized as the most accepted within valuations, a
variety of techniques are employed in practice, and there is no single method that clearly
dominates others (Palepu & Healy, 2000). Each technique involves different advantages
and disadvantages; therefore there are gains in considering several approaches
simultaneously.
Pike, Neale & Linsley (2012) also point out that the two main points in valuation can be
summed up into using a variety of methods and don’t expect to get it exactly right. This
refers to the fact that valuation is as much an art as it is a science and I believe this mindset
would apply to any valuation exercise, regardless of market, industry or current financial
position.
2.3 Risk and Cost of Equity
The dictionary definition of risk refers to the possibility that something bad or unpleasant
will happen (Merriam-Webster, 2014). Another definition of risk implies future uncertainty
about deviation from expected earnings or expected outcome (The Economic Times, 2014).
Therefore although many concentrate on the bad side of risk, the uncertainty at times could
also be positive, meanings there is room for upside. In valuation, the logic is also simple; a
risky dollar is worth less than a safe one, not all investments are equally risky.
French & Gabrielli (2005) state that all valuations by their nature are uncertain and risk is
the measurement of the value not being as estimated. Damodaran (2002) refers to risk as
the likelihood that we will receive a return on an investment that is different from the return
we expected to make. In other words; the elements or variables that may potentially change
the outcome of a valuation in a negative sense.
Quiry, Dallochio, Le Fur, Salvi (2009) outline some of the variables that firms can
potentially encounter when doing business that may increase their risk:
14. EMIRATES VALUATION UB: 11024086
14
Figure 2.2: Risk variables in Business
Other variables like interest rates and natural disasters are also important to analyze when
evaluating risk within markets. All of these variables or risk conditions will affect the
required rate of return of any investor.
Brealey, Myers & Stewart (2001) argue that risk depends on exposure to macroeconomic
events and can be measured as the sensitivity (Beta) of a stock’s returns to fluctuations in
returns on the market portfolio. In essence, this works out to be the base of the capital asset
pricing model (CAPM).
CAPM
The CAPM is a theory originally devised by Sharpe (1964) to explain how the capital
market sets shares prices. It now provides the infrastructure of much modern financial
theory and research and offers important insights into measuring risk and setting risk
premiums (Pike, Neale, Linsley, 2012). Therefore, it is by far the most used model to
calculate cost of capital within the valuation practice.
The CAPM is based on the assumption that investors act rationally and have at their
disposal all relevant information on financial securities (Quiry, Dallochio, Le Fur, Salvi,
15. EMIRATES VALUATION UB: 11024086
15
2009). In other words, it relies on the stock in question belonging to a market with a strong
or at least semi-strong level of efficiency.
The Model requires three elements in order to work: riskless asset, risk premium and stock
beta (Damodaran, 2012). The riskless asset is usually tied to 10 year government bonds
other similar sovereign type indicators. This is due to the fact that governments in theory
can’t default and therefore they are viewed as risk-free.
The risk premium is the premium demanded by investors for investing in the market
portfolio, which includes all risky assets in the market, instead of investing in a riskless
asset. The beta measures the risk added on by an investment to the market portfolio, this
effect could be either positive or negative.
Although this model is the most used and highly accepted model within the practice, it’s
not without its arguments against. Fama and French (1992) made a thorough test of the
CAPM, finding no U.S. evidence for the correct relationship between security returns and
Beta over the period 1963-90. Neither of the U.K. studies conducted by Beenstock and
Chan (1986) and by Poon and Taylor (1991) found significant positive relationships
between security returns and Beta. So even if we assume the firm being evaluated operates
within strong efficient market, evidence exists that the model is not perfect at comparing
risk of a market portfolio with the specific risk of the stock in question.
In response to the restrictive nature of model and its dependency on certain variables of the
market portfolio, authors like Roll (1976) have proposed models like the Arbitrage Pricing
Theory and many others have developed build up models similar to the CAPM.
Ultimately, the survival of the capital asset pricing model as the default model for risk in
real world applications is a testament to both its intuitive appeal and the failure of more
complex models to deliver significant improvement in terms of estimating expected returns
(Damodaran, 2002). Copeland (2000) adds to this by stating that; it takes a better theory to
kill an existing theory, and we have not seen the better theory yet. Therefore, practitioners
continue to use it being wary of all of the problems with estimating it.
16. EMIRATES VALUATION UB: 11024086
16
2.4 Valuation in emerging markets
Although it seems that this the preferred model for developed markets, valuation is also
practiced in emerging countries. Some of these countries don’t even have a working stock
market and even those that do, the majority of companies being valued, most likely will be
privately owned.
Within the book “The Dark Side of Valuation”, Damodaran (2009) states that; in valuing
emerging-market companies, the overriding concern that analysts have is that the risk of the
countries that these companies operate in often overwhelms the risk in the companies
themselves. In other words, the country risk at times maybe greater than any firm or
industry specific risk that may exist for a stock within an emerging market.
The risk free principle may not apply for these types of countries either, given that
governments are perceived capable of defaulting. Therefore, when we incorporate this
value, we should consider using it from a more developed country. The spread between the
risk free chosen and the rate from which the safest companies in the market pay their long
term debt; could be considered a country risk premium base.
While there are several other measures of country risk, one of the simplest and most easily
accessible is the rating assigned to a country’s debt by a ratings agency (S&P, Moody’s and
IBCA all rate countries) (Damodaran, 2002). Regardless of the measure you take, the
conventional CAPM model will have to be adjusted for a market like Dubai.
In a recent study in another GCC country, Kuwait, Fifield & Power (2012) found that
investors rated information about profitability ratios, growth ratios, estimated future
dividends and P/E ratio as the most important factors considered when valuing ordinary
shares. By contrast, the DCF approach was considered least important. Investors based their
decisions mainly on corporate reports and focused on the Balance Sheet and Profit and Loss
Account.
The limitations of the CAPM in a market like Kuwait or Dubai, could be a major reason
why investors may rely their decisions on more book based value approaches than income
17. EMIRATES VALUATION UB: 11024086
17
driven DCF ones. Incorporating additional risks within a DCF approach and assuming that
the market is fairly valued, could also be a risky proposition in these countries.
I believe that Fama’s (1970) efficient market theory gets tested well against behavioral
finance in markets like Kuwait and Dubai. His theory stated that investors act rationally and
that prices in the market accurately reflect both present and future value of a stock. The
limitations that not so efficient markets bring could be mitigated by behavioral finance
models.
According to Glaser (2004); Behavioral finance models are usually developed to explain
investor behavior or market anomalies when rational models provide no sufficient
explanations. Ricciardi and Simon (2000) add to this by stating that behavioral finance
enables those who invest in stock and mutual funds to avoid common “mental mistakes and
errors” and develop effective investment strategies.
Although it’s impossible to replace the EMH theory, behavioral finance models should
have a place in markets like these, where value and price do not necessarily mean the same
based on traditional metrics. A good example of this could be found in recent days within
Dubai, regarding a real estate company named Arabtec Holding (ARTC).
ARTC is a real estate developer within the UAE, has been in the market since the 1970’s
and is currently the biggest company within the Dubai Financial Market in terms of floating
shares. From September 2013 to May 2014, the company’s share price grew from 2.13 to
9.73, almost 350% in a span of around 8 months (Arabtec, 2014). The company then
proceeded to lose around 300% of its value (2.88) before the 1st
of July 2014, before the
second quarter results were made public.
Although the company reflected positive financials in the first quarter, there were no
tangible reasons for the increase, other than pure speculation. The company’s CEO resigned
at some point between May/June and all sort of uncertainty filled the market regarding this
stock, which aided to the huge selloff.
If this case is analyzed in the context of the EMH and behavioral finance theories, it can be
interpreted that the market was not able to estimate the share value properly given the lack
18. EMIRATES VALUATION UB: 11024086
18
of transparency involved and therefore investors had understand it’s behavior using other
means. ARTC is the most recent example of this phenomenon, but it can be quite common
within the Middle East region, given that they are still a developing market.
2.5 Application to Emirates Airlines
I don’t think many would argue that the DCF approach and CAPM have their limitations
when they are used to estimate the fair market value of a security. However, based on the
literature discussed, it seems that they still remain the most appropriate methods for
companies being evaluated under a going concern premise.
EA is a private non-quoted company which operates in an emerging market. Some of the
risks brought forth by emerging markets have been discussed, but private companies
incorporate additional components. As Pike states (2012): valuation of un-quoted
companies is very subjective. They require examination of similar quoted companies and
applying discounts for lack of marketability.
Authorities in Dubai are said to be considering an initial public offering (IPO) for Emirates
Airline as part of ambitious capital-raising plans, according to a report in the UK’s The
Telegraph newspaper (Shane, 2014). Speaking to the newspaper, Investment Corporation of
Dubai CEO Mohammed Al Shaibani said that state-controlled companies in the emirate
could potentially float on the London Stock Exchange (LSE).
It’s interesting that they would pick the LSE for the company’s IPO over the Dubai
Financial Market (DFM). The DFM currently has some of the Emirate’s flagship
companies like EMAAR and Emirates NBD within their index, so their approach with the
potential IPO of EA, is somewhat surprising. I believe their decision could be based on one
or several of the following reasons:
1. Increased transparency: EA is currently audited by a big 4 firm (PwC), therefore
we have to assume that their financial information is reasonably accurate. However,
since the company is government owned, the market might interpret that they don’t
have full disclosure on all relevant financial information.
19. EMIRATES VALUATION UB: 11024086
19
Even among competitors a sentiment exists that EA has some unfair competition
because of the facilities the government provides. Lee Moak, the President of the
Washington DC-based Air Line Pilots Association (ALPA), went on record stating:
“Unfortunately for us, we have for-profit, transparent airline companies” (Rapoza,
2014). Additional subsidize have always been a concern as well.
Emirates have always denied such claims (Riva, 2013) and if the company quoted in
a stock market like LSE, they would probably be forced to face a greater level of
scrutiny among potential investors and these claims would be better tested.
2. Increased number of investors: If the company did decide to make a portion of the
company’s stock public, the main reason would be to raise funds for their future
plans. Since the LSE is an older and more established stock market, in theory it
would have a better chance to reach more potential investors.
3. Reduced volatility: As discussed previously, stocks in this type of market could be
prone to fluctuations based on speculation and other non-conventional financial
reasons. Just recently, in June 2014; the DFM index hit a six year low (Gulf news,
2014), after a relatively good first quarter to the year. Although no stock market in
the world is immune to fluctuations, EA may believe the risk of this would be
reduced within a more established market.
4. Better valuation metrics: Given that the LSE has a greater number of companies
floating within their index and more years of operation, a greater chance exists of
the market working in a more efficient matter. This could mean that the operations
of EA may be valued with more traditional approaches, therefore giving a better
estimate of their true market value.
The valuation exercise of EA will require a strong link between both income and market
approaches in order to estimate fair market value. Although a cost approach value will be
considered, it will not be the primary focus of this analysis.
20. EMIRATES VALUATION UB: 11024086
20
3. COMPANY INFORMATION
3.1 History
On the 25th October 1985, Emirates flew its first routes out of
Dubai with just two aircrafts; a leased Boeing 737 and an Airbus
300 B4 (EA website, 2014). That year; the government of Dubai
invested the equivalent of $10 million to create a small local airline, with help from
Pakistan and a couple of leased jets (Riva, 2013), which to this day still hold 100% of the
stock belonging to the company.
Emirates Airline then began flying to destinations in the Middle East from its home base in
a sleepy Gulf city; it went largely unnoticed by the big European and American carriers that
dominated commercial aviation worldwide. Today, Dubai is very different; a hub of world
commerce that rivals London and New York and EA is the central piece. EA is the biggest
airline in the Middle East and the world’s fourth-largest by international traffic (IATA,
2013).
Today EA possesses a fleet of more than 220 aircrafts, flies to over 140 destinations in
more than 80 countries around the world, and its network is expanding constantly. Over
1,500 Emirates flights depart Dubai each week on their way to destinations on six
continents (EA website, 2014).
The company has also posted profits in 25 straight years of operations. This in a way defies
the highly cyclical nature of the airline business and its theoretical dependence on general
economic condition and thus mitigating some of the inherent risks involved in the industry.
3.2 Operations
The Company has its main offices and hub in Dubai, a city whose favorable geographic
location allows an airline to potentially serve 80% of the world’s population within an
eight-hour flying distance (EA website, 2014). The growth of the airline is therefore
inextricably linked to that of Dubai.
21. EMIRATES VALUATION UB: 11024086
21
Airline experts point out Dubai's geographical location: It's pretty much in the middle of the
world, an ideal transfer point between many of the fastest-growing markets (Riva, 2013).
The city also holds a distinct advantage over other business and tourist hubs in the world;
its airport capacity. Dubai International in the U.A.E. is a top 10 airport in terms of
passenger traffic, making it roughly the size of Hong Kong International, based in a city
three times larger than Dubai (Rapoza, 2014).
It can add more runways and more terminals almost without limit, and it is currently
building an even bigger airport, Dubai World Central (DWC), for when the current Dubai
International reaches peak capacity (Riva, 2013). The first terminal of this airport opened
on October 2013.
DWC currently has the capacity for 5-7 million passengers per annum (Dubai Airports,
2014). Upon completion however; DWC is expected to become the world’s largest airport
with an ultimate capacity of more than 160 million passengers and 12 million tonnes of
cargo per annum.
Aircraft departures:
123,055
133,772
142,129
159,892 176,039
12.4%
8.7%
6.2%
12.5% 10.1%
0.0%
2.0%
4.0%
6.0%
8.0%
10.0%
12.0%
14.0%
0
20,000
40,000
60,000
80,000
100,000
120,000
140,000
160,000
180,000
200,000
2010 2011 2012 2013 2014
Aircraftdepartures
Aircraft departures Growth %
Figure 3.1: Aircraft departures
22. EMIRATES VALUATION UB: 11024086
22
The airport facilities, along with investments in aircrafts and other factors, have contributed
to EA increasing its flight volumes every year. By 2020, Emirates anticipates that they will
carry some 70 million passengers to more than 180 destinations, utilizing an ultra-modern
fleet of more than 300 aircraft (EA Annual Report, 2014). This was the only passenger
projection found in the annual reports in the period analyzed. In the previous years, EA
only disclosed investments in aircrafts within their business plan.
Whether because of location or quality attracting travellers, Emirates says its passenger
traffic is rising at 20 percent annually (Riva, 2013). Competitors can't keep up: Lufthansa
said, in a recent presentation in New York, that it assumes 3 percent a year for the next few
years, and that's a typical number for established players in the industry.
3.3 Worldwide Presence & Brand Value
102
111
122 132
142
3.0%
8.8%
9.9%
8.2%
7.6%
0.0%
2.0%
4.0%
6.0%
8.0%
10.0%
12.0%
0
20
40
60
80
100
120
140
160
2010 2011 2012 2013 2014
Destinationcities
Destination cities Growth %
Figure 3.2: Destination cities
In 2013-14, EA flew 44.5 million passengers and 2.3 million tonnes of cargo to 142
destinations in 80 countries (EA Annual Report, 2014). As stated previously; this number is
expected to increase substantially over the next few years, based on the company’s business
plan.
23. EMIRATES VALUATION UB: 11024086
23
The company employs diverse market strategies to increase its worldwide presence, which
includes advertising and brand marketing through sport sponsorships. Emirates is the
official sponsor of some the world’s most successful football teams like Real Madrid C.F.
and AC Milan, along with being a worldwide partner for the International Football
Association (FIFA). The company also invests in other sports like Rugby, Golf, Tennis,
Cricket and a number of others.
According to Brand Finance (2014); Emirates possesses the world’s most valuable airline
brand for the third straight year. The airline finished 234th out of the 500 evaluated global
brands (up from last year’s 287th spot) with a brand valued at USD 5.48 billion, a 34
percent increase on Emirates’ 2013 valuation (Kollau, 2014).
3.4 Aircrafts & Growth Plan
138 144
163
187
205
4 4 6 10 17
0.00
50.00
100.00
150.00
200.00
250.00
2010 2011 2012 2013 2014
Aircrafts
Passenger Aircrafts Freight Aircrafts
Figure 3.3: Passenger and freight aircrafts
The airline industry has an enormous need for capital. Historically, capital spending has
consumed about 15 percent of annual airline revenues, more than double the average for
manufacturing companies (Beltsova, 2006). Investments on aircrafts and infrastructure have
24. EMIRATES VALUATION UB: 11024086
24
been at the core of EA strategy throughout the years and the strategy is not expected to
change in the short term.
As mentioned previously, EA currently operates a fleet of over 220 aircrafts for both
transporting passengers and cargo around the world. Their fleet has had an average growth
of 14.5% over the last 3 years (EA Annual Report, 2014) and the company expects this
trend to continue over the next few years.
At the 2013 Dubai Air Show, Emirates made its largest aircraft order yet - for 150 Boeing
777X and 50 Airbus A380 aircraft, together worth US$ 99 billion. Many of these aircrafts,
to be delivered from 2018 onwards, will replace the older ones within the fleet (EA Annual
report, 2014). This is in-line with their 2020 plan of reaching 300 aircrafts and carrying
over 70 million passengers.
3.5 Passenger Capacity & Seat Factor
35,152 39,278
42,476
49,424
56,045
78.1%
80.0% 80.0%
79.7%
79.4%
77.0%
77.5%
78.0%
78.5%
79.0%
79.5%
80.0%
80.5%
0
10,000
20,000
30,000
40,000
50,000
60,000
2010 2011 2012 2013 2014
Passengers-000
Passenger capacity Passenger seat factor (%)
Figure 3.4: Passenger capacity
As Coy (2002) points out: a substantial incentive exists for airlines to fill every seat, even at
reduced fares, because unfilled seats represent lost revenue. Although EA has grown its
25. EMIRATES VALUATION UB: 11024086
25
passenger capacity on average 12.6% annually over the last three years (EA Annual Report,
2014), it has also maintained its seat factor consistently at a range of 79.4% - 80%.
This is a very positive variable within the revenue projection assumptions of the valuation,
given that as the capacity increases, their track record brings a level of assurance that they
will be able to maintain their seats occupied moving forward.
EA does not disclose the passenger mix between first, business and economic classes
within their reports, although we assume that they have different margins.
3.6 Human Resources
28,686 30,248
33,634
38,067 41,471
2.3%
5.4%
11.2%
13.2%
8.9%
0.0%
2.0%
4.0%
6.0%
8.0%
10.0%
12.0%
14.0%
0
5,000
10,000
15,000
20,000
25,000
30,000
35,000
40,000
45,000
2010 2011 2012 2013 2014
EAEmployees(Q)
Human resources Growth %
Figure 3.5: Human resources
The workforce within EA has also grown consistently throughout the years in order to keep
up with the company’s aggressive business plan. EA believes that their workforce is a
major factor of their success, given that they invest heavily in proper recruiting and training
which has led to a consistent team year in and year out. The numbers actually support this,
given that 20% of their workforce has been with company for at least 10 years (EA Annual
Report, 2014).
26. EMIRATES VALUATION UB: 11024086
26
The company has also been able to translate this human resource strategy into positive
financial indicators. According to 2010 data from the forecasting firm Oxford Economics,
labor cost per employee at Emirates is about 40 percent of Lufthansa's and Air France-
KLM's, and half of American Airlines and United Airlines (Riva, 2013).
Some industry observers wrongly put the success of Emirates down to subsidy from the
government of Dubai (The Economist, 2013). It does enjoy a home base where there are no
corporate or income taxes and it has the implicit backing of the ruling family (which owns
the carrier) when borrowing. But its real savings come from low staff costs (in Dubai there
are no unions and plenty of cheap labour from India and Pakistan), and round-the-clock
operations which lead to high aircraft use. Airport fees are also low (The Economist, 2013).
27. EMIRATES VALUATION UB: 11024086
27
4. MARKET AND INDUSTRY CONDITIONS
4.1 Economy overview
Figure 4. 1: UAE inflation and GDP
Sources: Trading Economics
4.2 Gross Domestic Product (GDP)
In 2012, the UAE with US$360 billion of Gross Domestic Product (GDP) ranked in second
position within the Middle East and North African (MENA) region after Saudi Arabia, and
has emerged as a major financial and economic hub due to its openness to international
business, trade, and investment (Uddin & Hassan, 2013).
The UAE has an open economy with a high per capita income and a sizable annual trade
surplus. Successful efforts at economic diversification have reduced the portion of GDP
based on oil and gas output to 25% (CIA World Factbook, 2012). The country’s GDP is
made of the following (2012):
1. Oil and Industry Sectors (56%)
2. Services (43.2%)
3. Agriculture (0.8%)
28. EMIRATES VALUATION UB: 11024086
28
Within 2009-2010; the global financial crisis, tight international credit, and deflated asset
prices constricted the economy within the Country. The crisis hit Dubai hardest, as it was
heavily exposed to depressed real estate prices.
Dubai lacked sufficient cash to meet its debt obligations, prompting global concern about
its solvency (CIA World Factbook, 2012). The UAE Central Bank and Abu Dhabi-based
banks bought large shares in a number of companies to provide a partial bailout. In
December 2009; Dubai received an additional $10 billion loan from the emirate of Abu
Dhabi.
In 2013, Dubai accounted for approximately 30 per cent of the U.A.E.'s GDP. The
emirate’s economy expanded 4.6 per cent within 2013, up from 4.1 per cent in 2012
according to Dubai Statistics Centre (UAE Interact, 2014). The growth in GDP was mainly
attributed to the hospitality sector growing 13%, manufacturing 8.1% and Real Estate at
4.1%.
The International Monetary Fund (IMF) expects the UAE’s GDP to grow 4.4% in 2014 and
continue a similar trend in 2015 at 4.2%, according to their World Economic Outlook
report in April of 2014.
Inflation
Inflation indicators within the UAE have been more consistent over the last 5 years than
GDP. However, the 1.4% in 2013 was the highest in the last 3 years and many expect that
indicator to considerably increase from 2014 and onwards. Reuters (2014) states that; with
solid growth and soaring rents, UAE inflation may shoot above four per cent this year,
levels unseen since a record 12.3 per cent in 2008, just before Dubai’s property crash.
In the specific case of Dubai; its inflation rate increased by 1.31% in 2013 compared to
2012, mainly driven by an increase in the prices of Alcoholic Beverages and Tobacco
group by 14.79% and Education group by 4.58% (Dubai Statistics Center, 2014). Housing,
Water, Electricity, Gas, and other Fuel related groups increased by 1.22%, while the
communications group decreased by 1.04%. The Dubai Statistics Center (DSC) is a
29. EMIRATES VALUATION UB: 11024086
29
government entity and their methodology on how they arrive at these values are not
specified, therefore the accuracy of the numbers could be questionable.
The IMF expects the UAE’s inflation to grow 2.2% in 2014 and continue a similar trend in
2015 at 2.4%, according to their World Economic Outlook report in April of 2014.
4.3 Airline Industry overview
Overview
According to Rose and Joy (2005); the airline industry is characterized by an oligopoly
market structure, a form of imperfect competition in which a limited number of firms
dominate the industry. One could say that this structure is present within the aviation
industry in the Gulf Cooperation Council (GCC) countries, given that we find one or two
airlines in each one.
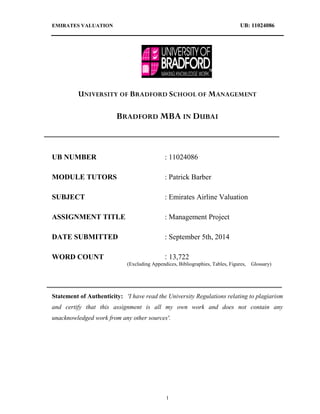
EA however competes as a global carrier, not just a regional one. Therefore their
competition is not limited to regional airlines. This is noticeable by the IATA’s (2013)
international passengers carried report:
81,395
52,787 50,739
43,335
33,803 33,118
27,407 26,581 25,002 23,086
0.00
10,000.00
20,000.00
30,000.00
40,000.00
50,000.00
60,000.00
70,000.00
80,000.00
90,000.00
2013
Passengers000
Ryanair easyjet Lufthansa Emirates British Airways
Air France T. Airlines KLM United Airlines Delta Airlines
Figure 4.2: International passengers carried
30. EMIRATES VALUATION UB: 11024086
30
As per their report; Emirates is the world’s 4th
major carrier in regards to passengers carried
internationally. The report also reflects a market trend which Rose and Joy highlighted in
2005. The authors stated that the growth of low fare, highly competitive airlines is an
additional factor motivating competitive change in the airline industry. Both Ryanair and
Easyjet are low fare airlines, which gain competitive advantage through pricing strategies.
Even within Dubai, this trend continues as EA faces direct competition from the local
carrier Fly Dubai (FD). FD Carried 6.82 million passengers in 2013, representing a growth
of 38% compared to 2012 (Fly Dubai, 2014). The growing trend of low fare airlines shown
here is a clear indicator that EA will have a hard time gaining competitive advantage
through cost strategies and will probably have to continue relying on other ones like
superior quality in service and global reach.
According to Czipura & Jolly (2007); the airlines serve three main regions: the Americas,
EMEA (Europe, Middle East and Africa) and Asia-Pacific. The authors also state that the
industry can be differentiated into big leading companies, medium-sized companies and
niche players. Big leading companies focus mainly on trans-continental and domestic
routes. Medium-sized companies have their strength in the domestic market and operate
partially in the trans-continental as well as regional markets. Niche players participate
primarily in regional markets with a secondary focus on the domestic market. As a
consequence, the airline industry is still very fragmented (Czipura & Jolly, 2007).
Within the GCC, we find other competing airlines like Qatar Airways and Etihad Airways,
however based on IATA’s statistics; they still present less of a challenge to EA when
compared to other major worldwide carriers. This could be attributed to the fact that both of
these airlines have their base in Qatar and Abu Dhabi, which currently have considerable
less traffic than Dubai. This correlates to what we mentioned earlier on how the growth of
EA is directly tied to the growth of the emirate of Dubai as a whole.
Overall the airline industry is a very competitive with both direct and indirect competition
based on market segments. Based on the investments made by EA in large passengers
aircrafts like the Airbus A380 and Boeing 777, we can assume that they will continue to
focus on transatlantic flights and continue growing their market presence in that segment.
31. EMIRATES VALUATION UB: 11024086
31
For a summary of the market that EA’s operates in using Porter’s five forces model, please
to refer to appendix B of the report.
Emirates Terminal 3, Dubai Airport
32. EMIRATES VALUATION UB: 11024086
32
5. FINANCIAL REVIEW
5.1 Overview
The historical financial review will be based upon 5 years of data (2010-2014). All the
financial information has been audited by PriceWaterhouse Coopers (PwC) and has been
extracted from the company’s annual report publications. The company closes in March of
each year, so the last financial cut evaluated was March 2014.
The financial analysis of EA includes a study of the Company’s year-end balance sheets
and income statements for the period mentioned above, along with the adjustments made to
a series of items corresponding to these statements. Most of the analyses included in this
section are for the purpose of supporting value conclusions; therefore some relevant
financial information for other purposes may not be included.
5.2 Balance sheet analysis
The un-adjusted Balance Sheet for EA pertaining to the period of 2010-2014, can be found
in appendix C of the report, please refer to it for any additional detail on any of the points
made in this section.
Assets
55,547
65,090
77,086
94,803
101,604
17.1%
17.2%
18.4%
23.0%
7.2%
0.0%
5.0%
10.0%
15.0%
20.0%
25.0%
0
20,000
40,000
60,000
80,000
100,000
120,000
2010 2011 2012 2013 2014
AEDMM
Total assets Growth %
Figure 5.1: Total assets
33. EMIRATES VALUATION UB: 11024086
33
For the year ended 2014, the Company presents assets of AED 101.6B, operational assets
(cash, trade account receivables, inventory, prepaid expenses and net fixed assets) make up
98.2% of the total, while non-operational ones make up 1.80% of the total assets for the
year 2014. The limited number of intangible assets registered within books is an indicator
of just how potentially different it could be to analyze book value presented in a balance
sheet, to actual fair value estimates of all of the company’s assets.
Based on what we discussed in section 3.3 concerning the company’s brand value, which
may be considered an intangible asset for valuation purposes, supports the theory that book
value approaches to estimate equity value can be very misleading. If EA would to be sold
tomorrow, a good chance exists that the company’s goodwill account would need be
significantly adjusted through a purchase price allocation process; in order to account for
the brand value and other intangible assets included within the value of the company.
These adjustments would therefore translate into the non-operational assets of the company
having a much higher weight on the balance sheet of the company. As it stands now, the
company’s goodwill account is not material, therefore the balance sheet is made of mostly
operational assets.
34. EMIRATES VALUATION UB: 11024086
34
Operating assets distribution (March 2014):
AED: 99.7B
Figure 5.2: Operating assets distribution
Property, plant and equipment (PPE): Aircrafts and capital projects (aircraft advances)
make up around 78% of the company’s PPE, while the other percentage is made up of land
and other fixed assets. The account grew 25% in 2014 when compared to 2013 and has
averaged growth of almost 22% in the last 3 years. This trend is expected to continue based
on the plans previously outlined.
Trade and other receivables:
7,008
6,481
8,126
8,744
9,086
27
24
26 26
24
22
23
24
25
26
27
28
0
1,000
2,000
3,000
4,000
5,000
6,000
7,000
8,000
9,000
10,000
2010 2011 2012 2013 2014
AEDMM
Trade & other receivables Days
Figure 5.3: Trade and other receivables
35. EMIRATES VALUATION UB: 11024086
35
The company has been consistent with their collections over the last 3 years; as they have
averaged 25 days and did not have a single year over 30 days. The nature of the business
helps, as passengers often pay their tickets and consumer good with either credit cards or
cash, which considerably helps this indicator.
Inventory: The Company’s inventory is divided into four main groups: Engineering (38%),
In-flight consumables (34.5%), Consumer goods (19.5%) and others (8%), which are
mainly made up of administration supplies.
Engineering inventory:
483 548 577 604 649
208
194
163
118 110
0
50
100
150
200
250
0
100
200
300
400
500
600
700
2010 2011 2012 2013 2014
AEDMM
Engineering Days
Figure 5.4: Engineering inventory
The days of inventory for engineering works were analyzed based on yearly maintenance
expenses. As the company continues to add aircrafts; it appears as though it’s getting more
efficient in their inventory management within this segment, given that their days have
reduced every year.
36. EMIRATES VALUATION UB: 11024086
36
In-flight consumables inventory:
399 454 551 554 587
67
72
71
64
61
54
56
58
60
62
64
66
68
70
72
74
0
100
200
300
400
500
600
700
2010 2011 2012 2013 2014
AEDMM
In-flight consumables Days
Figure 5. 5 In-flight consumables inventory
The days of inventory for in-flight consumables were analyzed based on yearly in-flight
consumables expenses. As the company continues to increase its passenger base, it appears
as though it’s also getting more efficient in their inventory management within this
segment, given that their days have reduced every year over the last four.
Consumer goods inventory:
105 186 217 262 331
45
81 86
92
102
0
20
40
60
80
100
120
0
50
100
150
200
250
300
350
2010 2011 2012 2013 2014
AEDMM
Consumer goods Days
Figure 5.6: Consumer goods inventory
37. EMIRATES VALUATION UB: 11024086
37
The days of inventory for consumer goods were analyzed based on yearly cost of goods
sold. The growth in the required investment in this segment based on days could be
attributed to growth in sales which is discussed in Section 5.3 of this report. The average of
the last three years equals to 93 days and although it has an upward trend, projections
assume that it should regress towards the mean of around 3 months.
For the other inventory in the balance sheet, an average of 15 days of administration
expenses was found over the last 3 years. Overall the company has had consistent inventory
management over the last 5 years and this greatly contributed to the assumptions chosen
within the valuation.
Advance lease rentals:
233 384 370 807 812
0.5%
0.7%
0.6%
1.1%
1.0%
0.0%
0.2%
0.4%
0.6%
0.8%
1.0%
1.2%
0
100
200
300
400
500
600
700
800
900
2010 2011 2012 2013 2014
AEDMM
Advance lease rentals % of Revenue
Figure 5.7: Advance lease rentals
As discussed in section 5.4; the company has both operational and financial leases. The
operational leases get an accounting treatment as operational expenses and therefore this
account works as pre-paid expenses. Due this, we analyze the figures based on what
they represent from revenue and we analyze a consistent pattern over the last two years.
38. EMIRATES VALUATION UB: 11024086
38
Liabilities (March 2014)
AED: 76.1B Figure 5.8: Liabilities distribution
As shown on the chart above; the company’s liabilities are made up mostly of two major
accounts: Trade/other payables and borrowings/leasing liabilities.
Trade and other payables:
This account is primarily made up of short term payable amounts owed to the company’s
suppliers (52.4%) and the advance payments made by passengers and cargo clients
(41.7%). The remaining sub-accounts are made up of related party transactions, dividend
payables and small provisions.
Trade payables & accruals:
8,402 10,112 10,521 13,514 14,184
83 82
68
76 72
0
10
20
30
40
50
60
70
80
90
0
2,000
4,000
6,000
8,000
10,000
12,000
14,000
16,000
2010 2011 2012 2013 2014
AEDMM
Trade payables & accruals Days
Figure 5.9: Trade payables & accruals
55.7%
35.6%
3.5%3.5% 1.7%
Borrowings and leasing
liabilities
Trade and other payables
Provisions
Deferred revenue
Others
39. EMIRATES VALUATION UB: 11024086
39
Since this account takes into consideration suppliers of all aspects of the company’s
operations, the account was analyzed using operating expenses, excluding depreciation and
amortization. The company’s has always had good terms with suppliers, to the extent that
speculations may be had of them using their government ties in order to achieve this. For
valuation purposes; these terms were compared with industry peers and adjusted
accordingly within the working capital projection in order to reflect a more reasonable fair
market value scenario.
Advances by passengers and cargo clients:
6,209 7,080 9,458 10,483 11,300
58
51
59
56
54
46
48
50
52
54
56
58
60
0
2,000
4,000
6,000
8,000
10,000
12,000
2010 2011 2012 2013 2014
AEDMM
Passenger & cargo sales in advance Days
Figure 5.10: Passenger and cargo sales in advance
The advance payments made by clients is one of the industry specific positive points, since
it greatly aids the working capital aspect of the cash-flow cycle. The account has also been
consistent over the last three years, ranging between 54-59 days.
40. EMIRATES VALUATION UB: 11024086
40
Borrowings and leasing liabilities:
AED: 42.4B
74.7%
23.5%
1.8% 0.0%
Lease liabities
Bonds
Termloans
Bank overdraft
Figure 5.11: Borrowings and leasing liabilies distribution
The company’s interest bearing debt is primarily made up of financial leases and bonds for
fund raising for both future and existing aircrafts. The effective interest rate per annum on
lease liabilities was 2.8% (2013:2.9%), on bonds was 4.5% (2013: 3.8%) and on term loans
was 3.7% (2013: 3.3%). Please see section 6.3 on how this affects the cost of debt portion
of the Weighted Average Cost of Capital (WACC) of the company.
41. EMIRATES VALUATION UB: 11024086
41
5.3 Income statement analysis
Revenue
Figure 5.12: Revenue
The company’s revenue continues to grow at a consistent pace, averaging around 15%
yearly over the last 3 periods.
Revenue distribution (March 2014):
AED: 80.7M
81.0%
14.0%
3.2%
Passenger
Cargo
Courier
E. Baggage
Mail
Sale of goods
Destination & Leisure
Figure 5.13: Revenue distribution
42,477 52,945 61,508 71,159 80,717
24.6%
16.2% 15.7%
13.4%
0.0%
5.0%
10.0%
15.0%
20.0%
25.0%
30.0%
0
10,000
20,000
30,000
40,000
50,000
60,000
70,000
80,000
90,000
2010 2011 2012 2013 2014
AEDMM
Revenue Growth %
42. EMIRATES VALUATION UB: 11024086
42
Around 95% of the revenue is leveraged directly on passenger airfare and cargo carried
fees. The remaining revenue is also somewhat tied to passengers, as they are related to sale
of goods and excessive baggage charges.
Revenue distribution per area (March 2014):
AED: 80.7M
10.3%
29.0%
11.4%
29.5%
10.2%
9.6%
Gulf - MiddleEast &Iran
Europe
Americas
East Asia &Australia
West Asia &Indian Ocean
Africa
Figure 5.14: Revenue distribution per area
The company’s revenue is also well diversified over all the major areas of travel in the
world. Over the five year period analyzed, the revenue from Europe and the East
Asia/Australia region were the most consistent, while the Americas reflected the most
growth.
The Americas in 2009 represented 8.7% of the revenue and now in 2014 it represents
10.2%. Likewise the participation from the GCC region in the revenue distribution reduced
in that same period from 11.4% to 10.3%. This represents the gradual shift the company is
making in their worldwide strategy.
43. EMIRATES VALUATION UB: 11024086
43
Passenger revenue:
32,995 41,415 48,950 57,477 65,405
0.9%
25.5%
18.2%
17.4%
13.8%
0.0%
5.0%
10.0%
15.0%
20.0%
25.0%
30.0%
0
10,000
20,000
30,000
40,000
50,000
60,000
70,000
2010 2011 2012 2013 2014
AEDMM
Revenue Growth %
Figure 5.15: Passenger revenue
Since passenger revenue is the major driver of the company, the trend correlates with the
overall revenue growth rates of the company. The growth over the last 2 years has been
predominately based on volume though, as revenue per passenger has remained relatively
static.
Average revenue per passenger:
1,202 1,318 1,441 1,459 1,470
-16.4%
9.7% 9.3%
1.3% 0.7%
-20.0%
-15.0%
-10.0%
-5.0%
0.0%
5.0%
10.0%
15.0%
0
200
400
600
800
1,000
1,200
1,400
1,600
2010 2011 2012 2013 2014
AED
Revenue per passanger Growth %
Figure 5.16: Average revenue per passenger
44. EMIRATES VALUATION UB: 11024086
44
The company states that premium class seat factor increased 2.1 percentage points
compared with the previous year, so the very small increase cannot be attributed to this. It
seems the company is not passing along any of the additional costs involved with growth to
the fares charged to passengers, but rather using volume as their strategy for profitability.
Passengers carried:
27,454 31,422 33,981 39,391 44,500
20.8%
14.5%
8.1%
15.9%
13.0%
0.0%
5.0%
10.0%
15.0%
20.0%
25.0%
0
5,000
10,000
15,000
20,000
25,000
30,000
35,000
40,000
45,000
50,000
2010 2011 2012 2013 2014
Passengers000
Passengers carried Growth %
Figure 5.17: Passenger carried
As discussed in previous sections of the report, EA’s has had consistent passenger growth
over the last 5 years.
Cargo revenue:
6,315 8,803 9,546 10,346 11,263
-8.1%
39.4%
8.4% 8.4% 8.9%
-20.0%
-10.0%
0.0%
10.0%
20.0%
30.0%
40.0%
50.0%
0
2,000
4,000
6,000
8,000
10,000
12,000
2010 2011 2012 2013 2014
AEDMM
Revenue Growth %
45. EMIRATES VALUATION UB: 11024086
45
Figure 5. 18: Cargo revenue
Cargo carried constitutes the second most important business line based on revenue
distribution within the company. Although the business has shown consistent growth over
the last three years, it shares a similar pattern with passengers, as it’s mostly based on
volumes rather than improved rates.
Average revenue per ton carried:
4,268 4,982 5,315 4,960 5,006
-16.8%
16.7%
6.7%
-6.7%
0.9%
-20.0%
-15.0%
-10.0%
-5.0%
0.0%
5.0%
10.0%
15.0%
20.0%
0
1,000
2,000
3,000
4,000
5,000
6,000
2010 2011 2012 2013 2014
AED
Revenue per ton Growth %
Figure 5.18: Revenue per ton
As shown on the graph above; the average revenue per ton decreased in almost 7% in 2013
and it only marginally increased in 2014 at less than 1%. Since the revenue grew at least
8.4% each over year over the last three, evidence suggests that they are also using volume
as their strategy for profitability in this segment.
46. EMIRATES VALUATION UB: 11024086
46
Cargo carried in Tonnes:
1,580 1,767 1,796 2,086 2,250
12.2% 11.8%
1.6%
16.1%
7.9%
0.0%
2.0%
4.0%
6.0%
8.0%
10.0%
12.0%
14.0%
16.0%
18.0%
0
500
1,000
1,500
2,000
2,500
2010 2011 2012 2013 2014
Tonnes000
Cargo carried in Tonnes Growth %
Figure 5.19: Cargo carried in tones
The increase in volume in 2013 demonstrates why the company was able to post profits
within the business line, despite the drop in their revenue per ton. The company’s growth
plan also contemplates aircrafts for this segment, so we should be able to expect consistent
growth within the next few years.
47. EMIRATES VALUATION UB: 11024086
47
Sale of goods:
1,727 1,774 2,017 2,181 2,555
5.2%
4.3% 4.1% 3.8% 3.9%
10.5%
2.7%
13.7%
8.1%
17.1%
0.0%
2.0%
4.0%
6.0%
8.0%
10.0%
12.0%
14.0%
16.0%
18.0%
20.0%
0
500
1,000
1,500
2,000
2,500
3,000
2010 2011 2012 2013 2014
AEDMM
Revenue % of P. Revenue Growth
Figure 5.20: Sale of merchandise and other goods
The sale of merchandise and other goods has also seen consistent growth throughout the
period analyzed. The consistent pattern of representing between 3.9 and 4.1% of the
passenger revenue, is evidence that their growth are somewhat correlated and therefore as
one grows, the other should follow.
Other smaller revenue business lines like excessive baggage were analyzed and are
included within the valuation projections; please see section 6 of the report for more detail.
Effect of exchange rates in revenue:
Foreign currency transactions are translated into the functional currency at the exchange
rates prevailing at the transaction dates (EA annual report, 2014). The resultant foreign
exchange gains and losses, other than those on qualifying cash flow hedges deferred in
other comprehensive income, are recognized in the consolidated income statement.
Given that the dirham is fixed against a number of currencies, including the dollar, the
results from this account were not material in the historic period analyzed.
48. EMIRATES VALUATION UB: 11024086
48
Operational expenses
35,779 44,471 55,686 64,358 71,828
84.2% 84.0%
90.5% 90.4%
89.0%
80.0%
82.0%
84.0%
86.0%
88.0%
90.0%
92.0%
0
10,000
20,000
30,000
40,000
50,000
60,000
70,000
80,000
2010 2011 2012 2013 2014
AEDMM
Operational expenses % of revenue
Figure 5.21: Operational expenses
The company’s operational expenses have been consistent over the last three years when
compared against revenue. The increase shown in 2012 was mainly due to increases in
global jet fuel prices, which are discussed later on in this section.
Operating expenses distribution (March 2014):
AED: 71.8B
62.6%
19.3%
1.7%
7.5%
8.9%
AircraftOperating
General & Administrative
Costof goodssold
Salesand Marketing
Depreciation&
Amortisation
Figure 5.22: Operational expenses distribution
49. EMIRATES VALUATION UB: 11024086
49
Within the aircraft operating expenses, the company’s accounting policies include
operational leases on aircrafts. For valuation purposes; all leases included as expenses were
adjusted, please see section 5.4 of this report for more details.
Aircraft operating expenses:
20,054 25,886 35,014 40,373 44,962
47.2% 48.9%
56.9% 56.7% 55.7%
0.0%
10.0%
20.0%
30.0%
40.0%
50.0%
60.0%
0
5,000
10,000
15,000
20,000
25,000
30,000
35,000
40,000
45,000
50,000
2010 2011 2012 2013 2014
AEDMM
Aircraft Operating % of revenue
Figure 5.23: Aircraft operating expenses
Aircraft operating expenses, as the name specifies, are those expenses attributed to the
flying of the aircrafts themselves. It is the largest expense account within EA and also the
most volatile, given that external factors play a greater role in its result than any other
expense account within the company.
Aircraft operating expenses distribution (March 2014):
68.2%
10.3%
7.8%
4.8%
3.5%
Jet Fuel
Handling
In-Flight Catering &Others
Aircraft Maintenance
Overflying
Landing & Parking
Figure 5.24: Aircraft operating expenses distribution
50. EMIRATES VALUATION UB: 11024086
50
The cost of Jet Fuel plays a crucial role within the company’s overall result, as it represents
over 40% of the company’s operational expenses. Other expenses like handling, landing
and parking fees have an element of variability, but they don’t have the weight in the
overall expenses structure that Jet Fuel has.
Global Jet Fuel prices:
Figure 5.25: Jet fuel and crude oil prices
Global jet fuel prices have stabilized after the sharp increase observed in 2011 and have
actually somewhat reduced using that date as a reference point. Although the risk that crude
oil prices may considerably increase in the future always exists, the consistency of late
gives some level of assurance in the projections used within the valuation process.
51. EMIRATES VALUATION UB: 11024086
51
Jet Fuel expenses:
11,908 16,820 24,292 27,855 30,685
28.0%
31.8%
39.5% 39.1% 38.0%
0.0%
5.0%
10.0%
15.0%
20.0%
25.0%
30.0%
35.0%
40.0%
45.0%
0
5,000
10,000
15,000
20,000
25,000
30,000
35,000
2009 2010 2011 2012 2013
AEDMM
Jet Fuel % of revenue
Figure 5.26: Jet fuel expenses
The increase observed in jet fuel prices correlates with what the expenses represented for
the company in regards to revenue starting in 2011.
General and administrative (GA) expenses:
8,899 10,207 11,589 12,537 13,834
21.0%
19.3% 18.8%
17.6% 17.1%
0.0%
5.0%
10.0%
15.0%
20.0%
25.0%
0
2,000
4,000
6,000
8,000
10,000
12,000
14,000
16,000
2010 2011 2012 2013 2014
AEDMM
General & Administrative % of revenue
Figure 5.27: General and administrative expenses
52. EMIRATES VALUATION UB: 11024086
52
GA expenses are made out mostly of human resources (74%) and corporate overheads
(26%). The trend observed in these accounts is positive, given that even though they are
expanding their operations, their human resources and administrative expenses to revenue
ratios have reduced every year in the 5 year period analyzed.
Sales and marketing expenses:
3,020 3,862 4,023 5,270 5,421
7.1%
7.3%
6.5%
7.4%
6.7%
6.0%
6.2%
6.4%
6.6%
6.8%
7.0%
7.2%
7.4%
7.6%
0
1,000
2,000
3,000
4,000
5,000
6,000
2010 2011 2012 2013 2014
AEDMM
Sales and Marketing % of revenue
Figure 5.28: Sales and marketing expenses
As stated in previous sections of the report, the marketing of the Emirates brand has been a
key point in the company’s strategy for many years. Their average investments in sales and
marketing activities over the last 3 years have been around 7%.
53. EMIRATES VALUATION UB: 11024086
53
EBITDA and Nopat
10,638 13,437 10,735 13,891 17,229
25.0% 25.4%
17.5%
19.5%
21.3%
0.0%
5.0%
10.0%
15.0%
20.0%
25.0%
30.0%
0
2,000
4,000
6,000
8,000
10,000
12,000
14,000
16,000
18,000
20,000
2010 2011 2012 2013 2014
AEDMM
EBITDA Margin
Figure 5.29: EBITDA
The company’s has consistently posted operating profits over the period analyzed. The
margin drop in 2012 was mostly based on the increase in jet fuel prices, which was
previously discussed in this section. The company however has gained efficiency in other
areas, including GA, so their operating margin is trending towards what it was prior to
2012.
The company’s EBITDA was used as an element within the market approach in the
valuation process; please see section 6.2 for more details.
54. EMIRATES VALUATION UB: 11024086
54
Nopat:
7,626 9,682 6,548 8,691 10,761
18.0% 18.3%
10.6%
12.2%
13.3%
0.0%
2.0%
4.0%
6.0%
8.0%
10.0%
12.0%
14.0%
16.0%
18.0%
20.0%
0
2,000
4,000
6,000
8,000
10,000
12,000
2010 2011 2012 2013 2014
AEDMM
Nopat Margin
Figure 5.30: Nopat
The company’s operating profit after taxes is the first element analyzed within the
company’s free cash (See section 6.3). The UAE has no income tax for the aviation
industry and the company has secured tax exemptions by virtue of double taxation
agreements and airline reciprocal arrangements in most of the jurisdictions in which it
operates.
Therefore, the small income tax expense shown within the income statement relates only to
certain overseas stations where Emirates is subject to income tax. Providing information on
effective tax rates is therefore not meaningful. For valuation purposes; this assumption is
not expected to change within the projections.
55. EMIRATES VALUATION UB: 11024086
55
5.4 Adjustments
Balance Sheet & Income Statement adjustments
EA is audited by a worldwide recognized firm, therefore a level of assurance exists that the
numbers presented reasonably resemble the company’s financial position based on IFRS.
However, for valuation purposes; adjustments were made to how operational leases were
being accounted for.
The company segregated aircraft leases into two sub-groups: financial and operational.
Financial leases were given a treatment as long term debt within the balance sheet, while
operational leases were being accounted for as operational expenses. For valuation
purposes, operational leases were re-classified as financial expenses, therefore not affecting
the company’s Nopat.
The reasoning behind this was that; if operating lease expenses represent fixed
commitments for the future, then they have to be treated as financing expenses rather than
operating expenses (Damodaran, 1999). Damodaran also states that to be consistent with
the treatment of operating leases as financing expenses in the course of acquiring an asset,
we need to consider changes in the present value of operating lease expenses over time as
the equivalent of capital expenditures.
Therefore within the valuation for EA, both the historic and projected operating leases were
considered financial expenses and later included within the DCF calculation as additional
capital expenditures (capex). Since the cost of equity is not affected by the treatment of the
present value of operating lease expenses as debt (Damodaran, 1999) and the
reclassification of the accounts netting themselves out; neither the book value nor projected
equity value was affected by this adjustment.
The adjustment did however considerably affect some of the financial ratios of the
company.
56. EMIRATES VALUATION UB: 11024086
56
5.5 Selected financial ratios
Table 5.1: Financial ratios
Ratios 2010 2011 2012 2013 2014
Liquidity ratios
Current ratio 1.01 1.03 0.98 1.12 0.84
Profitablity ratios and indicators
Sales (Growth%) 0.9% 25.5% 18.2% 17.4% 13.8%
Operating margin (%) 18.1% 18.4% 10.7% 12.3% 13.4%
EBITDA margin (%) 25.0% 25.4% 17.5% 19.5% 21.3%
Return on equity (Net profit) 20.7% 26.3% 7.5% 10.5% 13.4%
Return on equity (Operating income) 43.9% 46.9% 30.8% 38.0% 42.4%
Operating profit to capital employed (ROCE) 19.2% 20.5% 11.7% 12.5% 14.5%
Capital structure
Gearing (D/(D+E)) 57.6% 57.0% 62.4% 66.8% 65.8%
Coverage ratio (EBITDA/Interest) 2.8 3.5 2.6 2.8 3.2
Although the company’s profitability ratios are quite consistent and impressive, their
liquidity and capital structure ones reflect their aggressiveness and vulnerability if their
business plans don’t achieve their targets. Having a current ratio underneath one in 2014 is
a worrisome sign for working capital projections, along with having relatively low historic
interest coverage ratios for their future expansion plans. Both short and long term liquidity
concerns may be an indicator of why the company is considering floating a portion of its
equity within the London Stock Exchange.
5.6 Industry comparison
In order to analyze in proper context the financial ratios that directly affect enterprise value;
it was important to compare them with some of the major players within the industry. The
industry peers selected have financial closes in December of every year, so for illustration
purposes, I compared them against the March close of EA. This will mean that the 2013
results represent December for the competitors, March 2014 for EA.
The financial information presented for the competitors was compiled from the Wall Street
Journal’s Market Watch website, while EA’s information was extracted from their annual
financial reports.
57. EMIRATES VALUATION UB: 11024086
57
Revenue growth
2010 2011 2012 2013
Air France-KLM SA -12.4% 20.9% 0.2% 0.4%
Deutsche Lufthansa 22.6% 5.2% 4.9% -0.4%
American Airlines Group Inc. 11.3% 8.2% 3.7% 7.6%
Emirates Airline 24.6% 16.2% 15.7% 13.4%
-15%
-10%
-5%
0%
5%
10%
15%
20%
25%
30%
Air France-KLM SA Deutsche Lufthansa American Airlines Group Inc. Emirates Airline
Figure 5.31: Industry revenue growth
The revenue growth reflected by EA is considerably more consistent than the selected
industry peers, especially those from Europe. The growth for 2013 of both Air France and
Lufthansa is basically none, while EA posted over 10% for the 4th
straight year.
EBITDA margin
2010 2011 2012 2013
Air France-KLM SA -7.3% -0.1% -1.7% 0.5%
Deutsche Lufthansa 0.3% 0.0% 0.1% -0.5%
American Airlines Group Inc. -4.4% 1.8% 2.0% 7.2%
Emirates Airline 17.2% 9.7% 11.2% 13.2%
-10%
-5%
0%
5%
10%
15%
20%
Air France-KLM SA Deutsche Lufthansa American Airlines Group Inc. Emirates Airline
Figure 5.32: Industry EBITDA margins
58. EMIRATES VALUATION UB: 11024086
58
The profitability of the EA is also quite impressive when compared to its industry peers.
Within the period analyzed, its competitors have struggled to break even times, while EA
has consistently posted profits year after year. The EBITDA reflected for EA is without
adjustments to operational leases, given that the other airlines include them within their
operational expenses based on IFRS regulations.
Working capital management
Current ratio:
2010 2011 2012 2013
Air France-KLM SA 0.77 0.70 0.77 0.73
Deutsche Lufthansa 1.05 0.97 1.00 0.88
American Airlines Group Inc. 0.78 0.78 0.76 1.04
Emirates Airline 1.03 0.98 1.12 0.84
0.00
0.20
0.40
0.60
0.80
1.00
1.20
Figure 5.33: Industry current ratios
The industry as a whole reflects troubled liquidity ratios, as most of the companies’
analyzed struggle to achieve current ratios above one within the period observed. Given
how capital intensive airline companies; being efficient within the working capital cycle is
therefore key within this industry.
59. EMIRATES VALUATION UB: 11024086
59
Trade receivables (Days):
2010 2011 2012 2013
Air France-KLM SA 37 25 27 24
Deutsche Lufthansa 47 45 44 44
American Airlines Group Inc. 12 15 16 21
Emirates Airline 24 26 26 24
0.00
5.00
10.00
15.00
20.00
25.00
30.00
35.00
40.00
45.00
50.00
Figure 5.34: Industry days of accounts receivables
As discussed previously; the company’s trade receivables have been consistent in the past
and judging by their peers, they are mostly in-line or slightly better than the average. Since
the majority of the revenue from passengers is paid either in cash or credit cards, the risk of
this ratio fluctuating in the future is not as material as it would be in other industries.
Trade and other payables (Days):
2010 2011 2012 2013
Air France-KLM SA 36 40 33 36
Deutsche Lufthansa 41 38 36 39
American Airlines Group Inc. 19 16 19 21
Emirates Airline 82 68 76 72
0.00
10.00
20.00
30.00
40.00
50.00
60.00
70.00
80.00
90.00
Figure 5.35: Industry days of trade and other payables
60. EMIRATES VALUATION UB: 11024086
60
As we discussed in the previous section, the terms with suppliers that EA have may not be
industry comparable and the difference between its peers is evidence of this. Given how
low the quick ratios have been in the past for all the companies analyzed, the terms with
suppliers would play a major role in the company’s cash-flow cycle.
Please see section 6.3 for the assumptions used in the working capital projections.
Summary
In a general sense, EA reflects better financial ratios than the peers selected within the
report. Regardless if we analyze based on profitability, liquidity or other operational ratios,
EA has done a better job of achieving positive results. This historical performance in
relation to the industry; is reflected within the valuation section (6) of the report.
Please see appendix C for the all financial indicators of the industry peers selected.
61. EMIRATES VALUATION UB: 11024086
61
6. VALUATION ANALYSIS
As mentioned previously; the standard of value used in our valuation of the Company is
Fair Market Value (FMV). FMV refers to the price, in terms of cash or equivalent that a
buyer would reasonably be expected to pay, and a seller could reasonably be expected to
accept, if the business were exposed for sale on the open market for a reasonable period of
time.
In order to estimate fair market value; the company was analyzed using an asset or cost
approach, market or relative value approach and an income approach, based on discounted
cash-flows.
6.1 Asset approach
The asset approach is generally considered to yield the minimum benchmark of value for an
operating enterprise.
Within this approach; a net asset value analysis was performed. This method assumes that
the value of a business will be realized by the hypothetical sale of its net assets as part of a
going concern or liquidation premise. The net asset value estimated represents net equity of
the business after assets and liabilities have been adjusted to their fair market values.
Figure 6.1: Net operating assets and net asset value
66,739
73,287
25,471 25,471
0.00
10,000.00
20,000.00
30,000.00
40,000.00
50,000.00
60,000.00
70,000.00
80,000.00
2014 Adjusted (2014)
AEDMM'000
Net Operating Assets Net Asset Value
62. EMIRATES VALUATION UB: 11024086
62
The only adjustment made to the net operating assets was the capitalized operating leases
(AED 6.5B) into fixed assets, it did not however affect the net asset value, because it was
assumed that it was financed through debt. Under this approach, the equity value of EA, is
estimated at AED 25.4B.
For full detail of the net asset calculation, please see appendix C.
6.2 Market approach
According to this approach; the value of an entity can be estimated by reference to
comparable publicly traded companies, for which transaction values are known. This
methodology under the market approach is usually referred to as the public guideline
comparables method.
The notion behind the comparative company method is that prices of publicly traded
companies in the same or similar industry provide objective evidence of values at which
investors are willing to buy and sell interests in companies in that industry.
The analysis intended to compare EA’s multiples to similar publicly companies operating
in the same industry, as shown below:
Table 6.1: Industry multiples
Industry competitors EV (US$ B)
Revenue
(US$ B)
Revenue
multiple
EBITDA
(US$ B)
EBITDA
multiple
Deutsche Lufthansa 8.21 29.88 0.27 2.63 3.12
Air France-KLM SA 8.81 25.41 0.35 1.93 4.56
American Airlines Group Inc. 35.66 35.55 1.00 4.77 7.48
Delta Air Lines Inc. 38.48 39.10 0.98 6.15 6.26
United Continental Holdings, Inc. 23.98 38.58 0.62 3.51 6.83
Average 23.03 33.70 0.65 3.80 5.65
Source: Yahoo Finance (2014).
The selection of the industry comparables was done based on companies that had similar
flight volumes to EA according to IATA. Some of the companies analyzed did not
63. EMIRATES VALUATION UB: 11024086
63
publically trade a portion of their equity; therefore the second filter had this as a
requirement, because an estimate of enterprise value (EV) was required.
The dispersion between the multiples found in European based companies, from those
found in the United States, is interesting. The disparity could be due to the fact the US
carriers have more volume in internal flights and therefore are less susceptible to
worldwide conditions.
Although the euro-zone has had a small recovery since the spring of 2013, this came to a
halt in the second quarter of 2014, when GDP stagnated (The economist, 2014). The euro
area was held back by poor performances in its three biggest economies; GDP fell in
Germany, the biggest, and Italy, the third largest, by 0.2%; France, the second largest
economy, stagnated.
Investors might therefore feel that their European carriers are more exposed in the event of
another worldwide or regional financial crisis. The valuation results from this approach are
as follows:
Table 6.2: Market approach valuation
Valuation (AED in MM)
EA's EBITDA (2014) 10,681
Industry comparables multiple 5.65
Enterprise value 60,350
(Interest bearing debt) 42,431
(Other non-operational liabilities) 694
Other non-operational assets 1,857
Equity value 19,082
Even though this approach was not considered the most appropriate for valuation purposes
of this organization, if an industry average of EBITDA multiples is used; an enterprise
value of AED 60.35B and an equity value of AED 19.08B would be arrived under the
market approach.
64. EMIRATES VALUATION UB: 11024086
64
Table 6.3: Market approach sensitivity
Sensitivity analysis
EA's EBITDA (2014) 10,681 10,681 10,681 10,681 10,681
Industry comparables multiple 3.65 4.65 5.65 6.65 7.65
Enterprise value 38,988 49,669 60,350 71,031 81,712
It can be argued that since EA had better financial ratios, a higher multiple could have been
more representative of their value. However, these companies were selected because of
their respective positions within the industry and how comparable they were to EA based
on operations. If the sample was changed based on the sole reason that EA is more
profitable; then I believe the exercise would have been to find the intrinsic value of the
company, instead of its relative value against the industry.
This would also be in-line with Damodaran’s warning stated in the literature review section
of the report; on how some analysts manipulate the industry peers selected in order to
achieve the value that they would want for the company. The relative value analysis within
this report attempted to avoid this common practice and therefore did not modify the set
statistical parameter.
As stated previously however, the income approach is widely considered the most
appropriate approach in order to find the intrinsic, stand-alone value of any enterprise
within a going concern premise.
6.3 Income approach
As stated previously; the income approach is designed to estimate value by considering the
benefits generated by the asset over a period of time. This approach is based on the
fundamental valuation principle that the value of a business is equal to the present value of
the future benefits of ownership. The most accepted methodology within this approach is
the DCF.
65. EMIRATES VALUATION UB: 11024086
65
In order to estimate the company’s future cash-flow, Rappaport’s (1986) value drivers were
analyzed and projections were based upon them. The value drivers are as follows:
Value drivers (micro) Value drivers (macro) Value determinants
Net cash-flow
Market structure
Industry growth
Client preferance
Gross margin
Operational expenses
Efective restructuring
Contingencies
Terms with suppliers
Credit policy
Inventory turnover
Capacity increase
Asset improvements
Capital structure
Financial risk
Country risk
Revenue
Operational
margin
Tax
Working capital
Capex
WACC
Operating profit
after taxes
Operational
investments
Discount rate
Figure 6.2: Value drivers
The analysis and projections of the value driver components is the base in order to estimate
net cash-flow. The net cash-flow result will then be discounted to present value using a
discount rate in order to estimate the enterprise value of EA.
Once enterprise value is calculated, all non-operational assets and liabilities, including
interest bearing debt, will be factored in within the valuation, in order to estimate equity
value.
66. EMIRATES VALUATION UB: 11024086
66
Revenue
6.4%
6.1% 6.1% 6.1% 6.1% 6.1%
5.1% 5.1% 5.1% 5.1%
0.0%
1.0%
2.0%
3.0%
4.0%
5.0%
6.0%
7.0%
0
20,000
40,000
60,000
80,000
100,000
120,000
140,000
160,000
2015 2016 2017 2018 2019 2020 2021 2022 2023 2024
AEDMM
Revenue Growth
Figure 6.3: Revenue projection
The revenue streams within EA were projected individually based on their historical
behavior and assumptions based on their business plans. Please review appendix C for
details on the individual projections for each business line.
Passenger: Within the company’s 2014 annual report; it is stated that the plan for EA is to
possess a fleet of around 300 aircrafts and carry over 70 million passengers worldwide by
the year 2020. This date matches with the Dubai Expo which was recently awarded to the
Emirate and a number of investment projects that are being designed around it and
investments in the airline are no exception. A marginal decrease is expected after 2020 and
therefore is included within the projection.
Therefore the growth rates for aircrafts and passengers are based upon this assumption. The
passenger seat factor was kept at 80% of its capacity based on historical averages. The
revenue per passenger was increased 1% a year based on its behavior over the last 2 years.
It’s a conservative approach, but global competition is not expected to diminish and
regional ones are expected to become stronger, so a pricing strategy would be un-likely
moving forward.
67. EMIRATES VALUATION UB: 11024086
67
Cargo: The Company’s cargo growth plans are somewhat in line with that of passengers.
Their 2014 annual report estimates around 17% growth by 2017, so around 5-6% annually.
Therefore the projections for cargo also stipulate around 5% annual growth in tonnes
carried and 1% increase in the price per ton.
Other passenger revenue: Other revenue streams associated to passengers were projected
based on their historical percentage of passenger revenue. Sale of goods (4%), Excess
Baggage (0.70%) and others (1.5%) were included within this segment.
Other income: The revenue associated to liquidate damages and other compensations
received in connection with aircrafts is not part of the core business of EA. However,
within the 5 year historical review, they were recurrent and therefore I believe they should
be included within the operating cash-flow projection of the company. Historically they
have represented around 2% of total revenue and that was the assumption used moving
forward.
Operational margin (EBITDA)
20.7% 20.7% 20.7% 20.7% 20.7% 20.7% 20.7% 20.7% 20.7% 20.7%
20.7%
20.7%
0
5,000
10,000
15,000
20,000
25,000
30,000
35,000
2015 2016 2017 2018 2019 2020 2021 2022 2023 2024
AEDMM
EBITDA Margin
Figure 6.4: EBITDA projection