1. ABSTRACT
Protein kinases have emerged as promising therapeutic agents
resulting from the discovery of their role in numerous human
diseases including cancer. While there has been considerable
interest in the therapeutic potential of kinase inhibitors, many have
not been tested by unbiased strategies to validate both inhibitor
specificity and target engagement within living cells. To overcome
these limitations, we have developed a label free targeted LC-MS
workflow for identification and validation of biomarkers for kinase
inhibition that we have applied to characterize inhibitors of protein
kinase CK2. Although our methods are optimized for CK2, they are
easily adaptable for any substrate-kinase or inhibitor-kinase relation
characterization. This workflow is free of phospho-peptide
enrichment which provided a robust platform to measure kinase
inhibition through quantification of both phospho- and non-phospho-
species of the same peptide phosphorylated by the kinase. Since
non-phosphorylated peptides are detected easier in any MS
instrument, our method provided an increased sensitivity to monitor
CK2 inhibition with elongation factor 1-delta (EF1D) and
demonstrated that eukaryotic translation initiation factor 2 (IF2B) is a
superior biomarker of CK2 inhibition. Our comparison of eight
commercially available CK2 inhibitors (TBB, TBBz, DMAT, Ellagic
Acid, Quinalirazin, Resorufin, CX-4945 and inhibitor VIII) showed
that CX-4945 and inhibitor VIII were most effective at the inhibition
of CK2 in human osteosarcoma U2OS and adenocarcinoma HeLa
cells. Overall, our methods have yielded implementation of
systematic platforms for studying CK2 inhibitors and to further
characterize the biological functions of CK2.
Figure 2. Chemical structures of ATP, GTP and the evaluated CK2
inhibitors with their previously reported IC50 values.
ACKNOWLEDGEMENT
The work was supported by Canadian Institutes of
Health Research (CIHR) and Canadian Cancer Society
Research Institute (CCSRI).
Robust label free targeted proteomic workflow to identify and validate biomarkers of kinase
inhibition: comparative evaluation of CK2 inhibitors for their inhibition of CK2 in cells
Laszlo Gyenis1, Sam R. Fess1, Stephanie A. Zukowski1, Jacob P. Turowec1, Paula Pittock1, Gilles Lajoie1 and David W. Litchfield1,2
1Department of Biochemistry and 2Department of Oncology, Schulich School of Medicine and Dentistry, University of Western Ontario, London,
Ontario, N6A 5C1, Canada
Figure 1. Overview of systematic kinase inhibitor validation and biomarker
identification strategies. The identified and validated biomarkers are used
for characterization of kinase dependent cell signaling events and for
monitoring kinase inhibition at clinical settings.
Figure 4. Monitoring CK2 inhibition after 24h of 50μM CX-4945 inhibitor
treatment using U2OS cells with a label free targeted LC-MS (A-F) or
immunoblotting methods (G-H). Pie charts are showing the IF2B (E) or
EF1D (F) targeted CK2 phosphorylated or non-phosphorylated peptide
amounts measured by targeted LC-MS or by the immunoblotting method
(H) quantifying immunoblots with LiCor Odyssey v. 3.0 software.
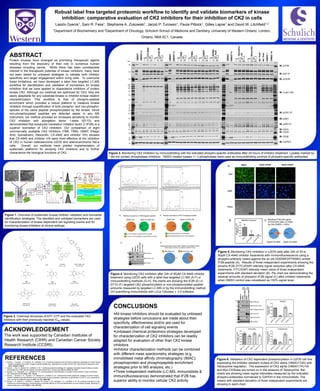
Figure 3. Monitoring CK2 inhibition by immunoblotting with the indicated phospho-specific antibodies after 24 hours of inhibitor treatment. Lysates marked by
* did not contain phosphatase inhibitors. DMSO treated lysates +/- λ-phosphatase were used as immunoblotting controls of phospho-specific antibodies.
CONCLUSIONS
All kinase inhibitors should be evaluated by unbiased
strategies before conclusions are made about their
specificity, effectiveness and/or are used for
characterization of cell signaling events
Unbiased chemical proteomics strategies developed
for characterization of CK2 inhibitors can be readily
adapted for evaluation of other than CK2 kinase
inhibitors
Inhibitor characterization methods can be combined
with different mass spectrometry strategies (e.g.
immobilised metal affinity chromatography (IMAC),
phosphoprotein and phosphopeptide enrichment
strategies prior to MS analysis, etc.)
Three independent methods (LC-MS, immunoblots &
immunofluorescence) demonstrated that IF2B has
superior ability to monitor cellular CK2 activity
REFERENCES1. Gyenis, L.; Turowec, J. P.; Bretner, M.; Litchfield, D. W., Chemical proteomics and functional proteomics strategies for protein kinase
inhibitor validation and protein kinase substrate identification: Applications to protein kinase CK2. Biochimica et biophysica acta
2013, 1834(7):1352-8.
2. Gyenis, L.; Kus, A.; Bretner, M.; Litchfield, D. W., Functional proteomics strategy for validation of protein kinase inhibitors reveals
new targets for a TBB-derived inhibitor of protein kinase CK2. Journal of proteomics 2013, 81, 70-9.
3. Duncan, J. S.; Haystead, T. A.; Litchfield, D. W., Chemoproteomic characterization of protein kinase inhibitors using immobilized
ATP. Methods Mol Biol 2012, 795, 119-34
4. Gyenis, L.; Duncan, J. S.; Turowec, J. P.; Bretner, M.; Litchfield, D. W., Unbiased functional proteomics strategy for protein kinase
inhibitor validation and identification of bona fide protein kinase substrates: application to identification of EEF1D as a substrate for
CK2. Journal of proteome research 2011, 10, (11), 4887-901.
5. Duncan, J. S.; Gyenis, L.; Lenehan, J.; Bretner, M.; Graves, L. M.; Haystead, T. A.; Litchfield, D. W., An unbiased evaluation of CK2
inhibitors by chemoproteomics: characterization of inhibitor effects on CK2 and identification of novel inhibitor targets. Molecular &
cellular proteomics : MCP 2008, 7, (6), 1077-88.
Figure 5. Monitoring CK2 inhibition in U2OS cells after 24h of 30 or
50μM CX-4945 inhibitor treatments with immunofluorescence using a
phospho-antibody raised against the ac-pS-GDEMIFDPTMSKC-amide
IF2B peptide (A). Results of three independent experiments showing the
phosho-IF2B (FITC)/DAPI intensity signal reduction after CX-4945
treatments. FITC/DAPI intensity mean ratios of three independent
experiments with standard deviation (B). Pie chart are demonstrating the
residual amounts of phosphor-IF2B signal (C) after inhibitor treatments
when DMSO control was considered as 100% signal level.
1 10 50 1 10 50 1 10 501 10 50
μM μM μM μM
1 10 50
μM
1 10 50
μM
IB: pIF2B
IB: pEF1D
IB: pCK2B
IB: p-pan CK2
IB: pCDC 37
IB: pAkt1
IB: pXRCC1
IB: CK2α
IB: CK2α’
IB: CK2β
IB: GAPDH
1 10 50
μM
kDa
48
35
25
245
135
100
63
48
35
25
20
63
48
63
135
100
75
48
35
25
20
35
DMSO*
DMSO*+λ
CX-4945
Quinalira
zin
Resorufin
DMSO1
DMSO10
NoTrmt*
NoTrmt
TBB
TBBz
DMAT
Ellagic
Acid
DMSO*
DMSO*+λ
DMSO*
DMSO*+λ
1 10 50
μM
Inhib.#8
Figure 6. Validation of CK2 dependent phosphorylation in U2OS cell line
expressing the inhibitor resistant mutant of CK2 alpha (V66A/I174A) with
Tetracycline regulation. The expression of CK2 alpha (V66A/I174)-HA
and Myc-CK2beta are turned on in the absence of Tetracycline. Bar
charts are showing mean signal intensities measured by the indicated
phospho-antibodies normalized to GAPDH in the immunoblots. The
means with standard deviation of three independent experiments are
showing in each chart.