
Recommended
Recommended
More Related Content
Similar to IBR5.pdf
Similar to IBR5.pdf (20)
More from SaleemBhatti5
More from SaleemBhatti5 (8)
Recently uploaded
Recently uploaded (20)
IBR5.pdf
- 1. Contents lists available at ScienceDirect International Business Review journal homepage: www.elsevier.com/locate/ibusrev Corporate governance and firm performance in emerging markets: Evidence from Turkey Ilhan Ciftcia , Ekrem Tatoglub , Geoffrey Woodc , Mehmet Demirbagc,⁎ , Selim Zaimd a Bahcesehir University, Graduate School of Social Sciences, Besiktas, Istanbul, 34349, Turkey b Ibn Haldun University, School of Business, Basaksehir, 34494, Istanbul, Turkey c University of Essex, Essex Business School, Wivenhoe Park, Colchester, CO4 3SQ, United Kingdom d Istanbul Sehir University, College of Engineering and Natural Sciences, Kartal, 34865, Istanbul, Turkey A R T I C L E I N F O Keywords: Corporate governance mechanisms Institutions Family capitalism Firm performance Emerging markets Turkey A B S T R A C T This is a study of the relationship between context, internal corporate governance and firm performance, looking at the case of Turkey, an exemplar of family capitalism. We found more concentrated ownership, often in the hands of families, led to firms performing better; concentrated ownership means that controlling families bear more of the risks of poor performance. Less predictably, given that the institutional environment is so well attuned to family ownership, we found that mechanisms that accord room for a greater range of voices and interests within and beyond families – larger boards and foreign ownership stakes – seem to also make for positive performance effects. We also noted that increase in cross ownership did not influence market perfor- mance, but was negatively associated with accounting performance. Conversely, we found that a higher pro- portion of family members on boards had no discernable effect on performance. Our findings provide further insights on the relationship between the type of institutions encountered in many emerging markets, internal corporate governance configurations and firm performance. 1. Introduction This is a study of the effect of internal corporate governance (CG) mechanisms on firm performance in an emerging market setting where institutional arrangements are weak and fluid; it further explores whether any relationships follow on the lines of theories developed in the West, or are context specific. The existing CG literature emphasizes two different systems: Market-based (outsider) and relationship-based (insider) ones (Bozec, 2007; Heenetigala, 2011; Hilb, 2006; Kyereboah- Coleman & Biekpe, 2006; Solomon & Solomon, 2004). The market- based or shareholder value system is mostly seen in Anglo-Saxon countries such as the US and UK, where the protection of minority shareholders is robust, and there is a strong emphasis on maximizing shareholder value (La Porta, Lopez-de-Silanes, Shleifer, & Vishny, 1997). On the other hand, the stakeholder orientated or relationship- based system is encountered in Continental Europe and parts of Latin America East Asia. Here, the role of the firm is much broader than maximizing shareholder profit, and that it seeks to benefit as wide a range of stakeholders as possible (Berghe, 2002; Demirbag, Wood, Makhmadshoev, & Rymkevich, 2017; Dore, 2008). There are also hybrid systems, such as Turkey, which combine some of the char- acteristics of each; this may translate to weak ownership rights, but not necessarily stronger countervailing rights for stakeholders (Banks, 2004). There is already an extensive body of literature on the relationship between ownership structure, board composition and attributes, and firm performance (Bauwhede, 2009; Chiang & Lin, 2007; Finegold, Benson, & Hecht, 2007; Górriz & Fumás, 1996; Hillman & Dalziel, 2003; Klapper & Love, 2004; Lam & Lee, 2012; Maury, 2006; Nicholson & Kiel, 2007; Singh & Gaur, 2009). However, rather more contentious is the extent to which such relationships reflect general principles, such as an inherent ‘conflict of interest between the shareholders and man- agers’; how national institutional frameworks might impact on, miti- gate or intensify any such tensions; and, indeed, whether alternative, potentially equally valid approaches to CG are valid, and indeed may work better in specific settings (c.f. Aguilera & Cuervo-Cazurra, 2009). The existing literature on boards, ownership and performance has tended to concentrate on variations in internal CG mechanisms within liberal market frameworks, and on exploring the ways in which shareholder rights may be enforced to maximize shareholder value. https://doi.org/10.1016/j.ibusrev.2018.08.004 Received 26 September 2017; Received in revised form 27 May 2018; Accepted 13 August 2018 ⁎ Corresponding author at: University of Essex, Essex Business School, Southend Campus, Southend-on-Sea, SS1 1LW, United Kingdom. E-mail addresses: ilhan.ciftci@kibarenerji.com (I. Ciftci), ekrem.tatoglu@ihu.edu.tr (E. Tatoglu), gtwood@essex.ac.uk (G. Wood), mdemirc@essex.ac.uk (M. Demirbag), zaims@itu.edu.tr (S. Zaim). International Business Review 28 (2019) 90–103 0969-5931/ © 2018 Elsevier Ltd. All rights reserved. T
- 2. It can be argued that these effects of internal CG arrangements may be amplified – and, hence, much more visible – in contexts with weak and fluid institutions, where external corporate governance arrange- ments are less effective (Dore, 2008). There has been growing interest in understanding how institutions operate, and the effects of variations in institutional coverage in emerging markets, and in contexts where family ownership is widespread (Witt & Redding, 2013). However, a limitation of much of the existing comparative institutional literature is that the firm is treated as something akin to a transmission belt with contextual features translating into performance outcomes (Wood, Deben, & Ogden, 2014). Yet, institutional arrangements directly impact on intra-organization governance and practice; hence, this study pro- vides a close analysis of the relationship between institutions, internal corporate governance and performance, drawing out the linkages and interconnections between them. Moreover, examining the relationship between institution-specific CG influences and firm performance, measured using both accounting and market-based performance in- dicators provides a methodological contribution towards a better ar- ticulation of CG-firm performance link in the context of an emerging market economy for which only a handful of studies have hitherto been conducted (Singh, Tabassum, Darwish, & Batsakis, 2018). Finally, there has been growing interest in Turkey, a rapidly growing emerging market, but one where there has been increasing concerns as to the direction of institutional change (Bugra & Savaşkan, 2014; Karadag, 2010). The remainder of the study is organized as follows. In Section 2, we provide a brief information on the development of CG in Turkey. Then, we review relevant literature and develop the study’s hypotheses. Re- search method is presented in Section 4, followed by results and dis- cussion. Conclusion is given in the final section. 2. Corporate governance in Turkey Turkey is broadly of French legal origin (La Porta et al., 1997), but incorporates some Anglo-Saxon features. Examples of the latter would include monist (one-tier) board systems, that employees are generally not represented on boards, that organizations mostly act for the profit maximization of shareholders (stakeholder countervailing power is weak), whilst banks or financial institutions do not dominate business system through holding shares or voting rights unlike some European countries (Nilsson Okutan, 2007). However, Turkey’s security market is not broad enough and market capitalization is low compared to that of Anglo Saxon firms. Ownership structure is not widely dispersed (Atakan, Ozsoy, & Oba, 2008; Demirbag, Fracknall-Hughes, Glaister, & Tatoglu, 2013). Property rights under the law are relatively weak (La Porta et al., 1997). Families in Turkey own 68 of the 100 largest traded companies and 53 percent of these families possess more than 50 per- cent of voting rights (Demirag & Serter, 2003). Usdiken, Yildirim- Oktem, and Senol (2015) claim that family ownership structure in Turkey has been observed since 1940s. Ararat and Ugur (2006) suggest controlling shareholders in Turkey maintain large stakes and leverage cash flow rights due to privileged shares and pyramidal ownership structures. This causes families hold the majority of shares of one more companies through pyramidal structure (Demirag & Serter, 2003). Due to large and limited number of shareholders in most businesses, Turkish business environment runs as a networking system rather than through formal contracts. Finally, the broadly civil law Turkish legal framework (La Porta et al., 1997) incorporates Anglo Saxon elements (Nilsson Okutan, 2007), but at most, is a hybrid-based system, rather than one that is shareholder rights orientated. The 1999 OECD Corporate Governance Principles required member countries (including Turkey) to take some initial steps to develop an appropriate CG code. In line with this suggestion, Turkey issued its first governance code in 2003. There were also various codes/principles issued voluntarily by the Turkish Industrialists and Businessmen’s Association (TUSIAD), the Corporate Governance Association of Turkey (TKYD), and regulatory agencies such as the Capital Market Board (CMB) up until 2011. These codes were not compulsory and relied on ‘comply or explain’ rule. The CMB was designated by the Turkish Government as a formal authority in charge of both issuing and man- dating CG rules in 2011. This development was important because until that time there were no centralized structure and no obligation for publicly traded firms who were not willing to adopt CG codes. The CMB’s first code, the Communiqué No. 54, brought forward some compulsory rules; this was followed on by three further codes, Communiqués No. 56, No. 57, and No. 60, based on suggestions from public and private companies, but also due to complications arising from the application of the existing CG Code. Finally, the CG principles were updated via Communiqué No. 17, in 2014, in order to comply with the new Turkish Commercial Code, which came into effect in 2012. This new version of CG code brought some compulsory and ad- visory resolutions regarding the composition of board of directors and shareholders. It is widely acknowledged that there have been some significant institutional developments since 2003 regarding the development of internal and external CG mechanisms established by the regulatory authorities: The Turkish CG Code was issued; Turkish Commercial Code revised; Public Oversight Accounting and Auditing Standards Authority founded; Turkish Accounting and Financial Reporting Standards were issued; and the Capital Market Board made some serious changes to increase transparency. Although Turkey has experienced major in- stitutional reforms, Turkey nevertheless shares almost all of the salient features of many emerging market CG regimes, including weak in- stitutions (uneven law enforcement, shareholder and creditor protec- tion), pyramidal business groups, dual class shares and concentrated family ownership (Demirag & Serter, 2003). 3. Theoretical background and hypotheses 3.1. Institution-specific CG influences There are many different strands of institutional theory, from micro level sociological approaches, which focus primarily on internal orga- nizational dynamics (DiMaggio & Powell, 1991) to macro level eco- nomic and socio-economic approaches that seek to link firm behavior to wider societal realities. A key concern of the former is on the em- beddedness of organizational processes and routines, and how these are legitimized (Greenwood & Hinings, 1996); meanwhile the latter con- centrates on the relationship between societal level institutions – and the dominant patterns they assume – and firm level practices (Wood, Dibben, & Ogden, 2014). However, there has been a convergence across the different strands of institutional theory around the recognition of the central role of shared bodies of meaning, systems, regulations and governance (ibid.). Again, institutional theory seeks to explain both stability in, and commonalities between organizations, and how and why systemic and firm level change happens (Greenwood & Hinings, 1996). This study centers on the relationship between contextual dy- namics and intra-firm practice. Hence, it focuses on both on how na- tional level institutions and the associated investment ecosystem impact on internal CG, and how the latter may be associated with persistent modes of behavior reflecting internal and external dynamics. Whilst sharing these concerns with other strands of institutional analysis, the literature on comparative capitalism specifically focuses on the relationship between national level institutional realities, the extent and density of ties between key societal actors, dominant modes of CG and intra-firm practices (Wood et al., 2014). The initial concern of such theories was with the advanced coordinated (e.g. Germany, Japan and Scandinavia) and liberal market economies (e.g. US and UK) (Hall & Soskice, 2001; Hancke, Rhodes, & Thatcher, 2007). Initially, it was felt that emerging markets would evolve towards one or other of these models (ibid). However, there is growing evidence that emerging markets are not so much evolving towards one of the more mature I. Ciftci et al. International Business Review 28 (2019) 90–103 91
- 3. models of capitalism, but rather constitute quite durable and distinct orders. Change may be slowed by complementarity, even if the latter are partial and skewed to benefit insider players (Fainshmidt, Judge, Aguilera, & Smith, 2016). Based on an extensive evaluation of socio- economic features, Witt and Redding (2013) argue that neither the shareholder nor stakeholder dominant archetypes accurately describe family firm dominated economies (Hoskisson, Wright, Filatotchev, & Peng, 2013; Tabalujan, 2002; Witt & Redding, 2013). Liu, Yang, and Zhang (2012) note that whilst the literature on fa- mily firms has been dominated by agency and resource-based per- spectives, institutions impact on how and where family ownership predominates and how it affects performance. They suggest that con- tradictory evidence on the relative performance of family businesses is in part a function of a failure to account for institutional effects (ibid.). Similarly, as Carney (2005) notes, much of the literature on family firms – and contexts where family firms predominate – focuses on the resource-based view; however, it has been supplemented by a growing body of work that brings institutional analysis to bear. Again, Church (1993) argues that it is not possible to understand family firms without taking account of time and place: National institutions and cultures will have a much greater effect than formal structures. Existing institutional accounts on family capitalism would place Turkey squarely within this category (Karadag, 2010). Indeed, it could be argued that this feature has been amplified in recent years; large commercial and industrial families have secured ever greater influence, capitalizing on recent political developments and associated regulatory changes (Karadag, 2010). The latter have opened up new opportunities for leading families to maximize the returns accruing to them, con- centrating ownership and control, leaving other interests much worse off (Bugra & Savaşkan, 2014). Ownership concentration is associated with powerful families and other players, who will have access to more extensive and deeper networks, which can be harnessed to optimize performance (ibid.). Again, as there are fewer opportunities for risk to be offloaded on outsiders, it can be argued that ownership concentra- tion represents the optimal corporate governance arrangement in con- texts such as Turkey, where institutions are relatively weak (Heugens, Van Essen, & van Oosterhout, 2009). Hence: Hypothesis 1. There is a positive association between ownership concentration and firm performance. Secondly, there is the issue of cross ownership. A major function of cross ownership is that it allows minority shareholders to maintain control, whilst only holding a relatively small proportion of equity. In other words, it allows insiders control despite only holding a small proportion of cash flow rights (Bebchuk, Kraakman, & Triantis, 2000). Hence, it may enable organizations to fend off the concerns of non- insider shareholders, leaving the latter worse off (ibid.). In contexts where family ownership is widespread, it may be a vehicle through which families may collaborate, promoting insider interests at the ex- pense of outsiders. For example, cross ownership may enable families to reallocate costs and returns, leaving disempowered non-family share- holders much worse off (Villalonga & Amit, 2006). Cross ownership enables businesses to be captured by families for a disproportionately modest investment, to provide job opportunities for relatives, for prestige reasons, and/or to cross subsidies other businesses where fa- mily members have a larger stake. From an institutional perspective, the relative utility of cross own- ership is closely bound up with contextual dynamics (Peng & Jiang, 2010; La Porta, Lopez-de-Silanes, & Shleifer, 1999). When institutions are relatively closely coupled, to make for effective market coordina- tion, cross ownership may allow for cross- and inter- industry sharing of knowledge and capabilities, the enhancing of sectoral wide skills de- velopment and collective bargaining arrangements, and the support of the agendas of longer term investors (Peng & Jian, 2010). However, when institutional arrangements are less effective, and/or more weakly coupled, cross ownership may yield few of these benefits; rather, the widespread usage of cross ownership is likely to be a reflection of systemic failings, of the inability of non-family shareholders to enforce their rights (La Porta et al., 1999). In such settings, institutional func- tionality is partial and geared to serving specific insider interests only (Wood & Frynas, 2006). Here, it is particularly likely that insiders will manipulate cross ownership in order to shift costs between firms, leaving most, worse off to benefit a favored few. As noted above, it may be used to grant relatives sinecures in firms where there are significant minority shareholders, and/or as a vehicle to support family empire building ambitions. In such instances, the organization will end up performing significantly worse than it otherwise would have. The Turkish institutional environment provides relatively fertile ground for cross ownership, again, given the relative weakness of investor rights (La Porta et al., 1997), and the political clout of leading families (Karadag, 2010). Hence: Hypothesis 2. There is a negative association between the share of cross ownership and firm performance. It can be argued that systems based on personal familial relations functionally optimally if formal contractual rights are weak and the pool of investment capital is limited; personal ties assume greater im- portance in such settings (Rajan & Zingales, 1998). However, as systems modernize, this may result in capital misallocation. On the one hand, family capitalist systems may be poorly equipped to cope with sufficient capital inflows from abroad (Rajan & Zingales, 1998). On the other hand, investors from abroad may be better equipped to cope with systemic change, as they may have experience of the latter in a range of different national contexts. As their commitment to the existing order may be weaker, they also be more inclined to promote the adoption of best practices from abroad (Brewster, Wood, & Brookes, 2008). Again, if family owned firms are supported by strong domestic networks of relationships (Fainshmidt et al., 2016), they may be less experienced in optimizing more transactional or “arm’s length” relationships en- countered in the advanced societies (Wood et al., 2014). Investors from abroad may be able to bring with them the kind of knowledge and experience of the latter that supplements the in-depth understanding of working in family based networks. Existing work on inward FDI to Turkey from an institutional perspective suggests that incoming firms tend to draw on their developed internal capabilities and strengths in compensating for institutional shortfalls at contextual level, and in doing so, pioneering higher value added practices (Collings, Demirbag, Mellahi, Tatoglu, & Wood, 2014; Dumludag, 2009). Again, if MNEs from institutionally advanced contexts are likely to be subject more robust country of origin regulation, then this would suggest that they will be more effective in protecting the interests of investors. Indeed, in looking at the case of Turkey, Alpay, Bodur, Ener, and Talug (2005) found that MNEs were likely to have uphold better corporate govern- ance standards. This leads to the following hypothesis. Hypothesis 3. There is a positive association between the share of foreign ownership and firm performance. Within Turkey, shortfalls in formal regulation and political devel- opments have opened up a void which has been filled by family in- terests, who have capitalized on the opportunities for their own ad- vancement (Karadag, 2010); in turn, this vests internal corporate governance checks and balances with greater significance (Kula, 2005). Carney (2005) argues that family control is associated with three types of propensity: Personalism, parsimony, and particularism. This may optimize social capital and encourage opportunism in investment. There are three dimensions of family capitalism that impact on CG. Firstly, the corporate unit as a legal actor may be difficult to disentangle from family interests (Tabalujan, 2002). Company assets are under omnipresent threat of expropriation by family members. Secondly, there is the issue of accountability: Family members may feel more accountable to the family rather than to shareholders or company of- ficers (ibid.). Thirdly, family members may undermine formal lines of I. Ciftci et al. International Business Review 28 (2019) 90–103 92
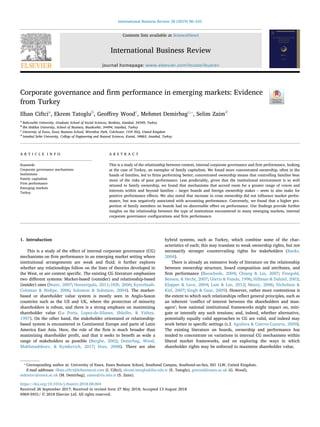
- 4. authority and supervision (Tabalujan, 2002). Larger boards may dilute these effects: At the very least, consensus will have to be forged be- tween key family factions (Topak, 2011), and it may make it easier for professional managers to exert their influence (Dalton, Daily, Johnson, & Ellstrand, 1999). Thus, we expect that: Hypothesis 4. There is a positive association between board size and firm performance. On the one hand, it could be argued that if decision-making is concentrated in the hands of family members, personal ties and loyal- ties may trump commercial exigencies (Morck & Yeung, 2003). Sig- nificant representation of outsiders on boards may allow for the infu- sion of fresh ideas, and temper deep-seated family loyalties (ibid). In other words, even if family ownership may work relatively well in specific settings, it imposes costs; if family based networks are open, rather than closed to fresh ideas, the system may work much better (Johannisson & Huse, 2000). There is much evidence to suggest that family ownership is a relatively efficient model in contexts where in- stitutions are relatively weak (Fainshmidt et al., 2016). If left to their own devices, commercial and industrial families may forge solutions most appropriate to their context. Again, it has been argued that in Turkey, institutional shortfalls mean that firms often are forced to buy the support or acquiescence of local power holders, such as ex-politi- cians, bureaucrats and military officers through sinecures at board level (Ararat, Orbay, & Yurtoglu, 2010). Such board members may add little beyond this, and, indeed, leverage their position to demand additional rents. Hence: Hypothesis 5. There is a positive association between the proportion of family board members and firm performance. 3.2. Control variables When institutions are incompatible, there is a contestation for su- premacy; the lack of a clear and mutually supportive system will open up room for family owned businesses to devise solutions of their own (Leaptrott, 2005). Van Essen, Strike, Carney, and Sapp (2015) find that when investor protection and institutional effectiveness is weaker, fa- mily owned firms are particularly likely outperform non-family firms during times of crisis. This would suggest that a family ownership stake diminishes; these beneficial effects will be less pronounced. Again, public ownership subjects firms to greater scrutiny, which may make it harder for dominant families to forge deals based on their extended networks. Hence, we control for the proportion of publicly held shares, as this will dilute the material stake families have in firms, which may diminish performance. We also control for the effects of the proportion of independent and non-executive directors and CEO duality, given that these are indicators of relative board independence (Chiang & He, 2010). However, we anticipate these effects may be slight. The fact of CEO duality tells us little as to whether s/he is a family member or not, which may exert a stronger effect on managerial-board relations. We also incorporated the following additional control variables: Female board representation, executive board membership, proportion of publicly held shares, CG index, leverage, firm age, firm size, industry and group affiliation (details provided in method section). These con- trol variables are classified under three main categories: Board specific controls, CG infrastructure specific controls and firm specific controls. Fig. 1 delineates the research framework of the hypothesized re- lationships along with the control variables. 4. Research method 4.1. Sample Our sampling frame includes the firms listed in Borsa Istanbul (BIST). As of May 2013, the number of firms listed in BIST was 428. These firms are categorized with respect to their market definitions and requirements, which are shown in Appendix 1. The market conditions are determined in accordance with listing requirements, such as firm size and sector. After excluding firms that do not meet the listing re- quirements of BIST and that are not freely traded, we confine our sample to 234 firms (55 percent). Furthermore, in line with previous studies (Earle, Kucsera, & Telegdy, 2005; Rose, 2007; Setia-Atmaja, 2009), financial institutions are excluded from the dataset because of their different financial reporting standards (Jackling & Johl, 2009). Following the elimination of financial firms, our sample finally includes 210 firms that account for 49 percent of listed firms on the BIST. The data about these companies cover the period of 2010–2013 and are compiled from a wide variety of channels. (1) Central Registry Agency; (2) annual reports of firms; (3) external audit reports; (4) corporate web pages of firms; (5) Public Disclosure Platform, and (6) a personal direct contacts with to mailing or calling a firm’s investor relations department. Most of the data, especially on board attributes, were hand-collected from above channels. There were some limitations to the data collection process owing to some missing variables (e.g., CEO duality, executive and independent board membership), as firms have no legal obligation to disclose information on them. These lim- itations constitute the key reason to confine our time frame to the period of 2010–2013. Table 1 shows the characteristics of the sample. 4.2. Variable definitions and measurement The following subsections include the definitions and measurements of the variables used in the study. 4.2.1. Dependent variable This study uses Tobin’s Q and Return on Assets (ROA) as dependent variables, which are consistent with prior studies (e.g. Sarkar & Sarkar, 2000; Cheng, 2008; Guest, 2009; Jackling & Johl, 2009; Chen & Nowland, 2010; O’Connor, Kinsella, & O’Sullivan, 2014). In fact, re- lying on a single performance indicator may be specious. For instance, Dalton et al. (1999) highlight limitations on the usage of accounting performance measures, as they may be subject to manipulation, and variations in accounting and consolidation methods. Conversely, Muller (2014) claims that market-based measures of performance may be af- fected by investor anticipation. In the light of this, we use both ac- counting and market based performance measures1 . ROA is an accounting performance indicator, defined as the per- centage of net income to total assets. The ROA shows a firm’s opera- tional performance for a specific period (mostly one year) as a per- centage of total assets. In this study, we select ROA over other similar performance indicators – ROE and ROIC – owing to limitations in the latter; for example, in Turkey firms’ leverage ratios are usually higher than those in developed countries. Information for a ROA is obtained from a firm’s annual reports, including external audit reports. Annual reports are available from corporate web sites. Tobin’s Q is the market performance indicator defined as the per- centage of market value of a firm to total assets. Hoon and Prather (2001) claim that Tobin’s Q is frequently regarded as a reliable measure indicating a firm’s performance based on its growth potential. We 1 Although the accounting measures of performance (e.g. price earnings measures) might also be used like Tobin’s Q, the latter provides a rather more realistic measure when evaluating the market performance of firms in emerging countries like Turkey where the capital markets are not as broad and deep as in Anglo-Saxon countries. It is also well acknowledged in the extant literature that the use of accounting-based measures of performance is subject to serious shortcomings stemming largely from differences in systematic risk, tax laws and accounting conventions concerning inventory valuation, R&D and advertising, and is likely to differ across industries creating estimation bias in favor of in- dustry effects (see Singh et al. (2018) for a detailed review). I. Ciftci et al. International Business Review 28 (2019) 90–103 93
- 5. obtained market value, the denominator of Tobin’s Q, from the Central Registry Agency (MKK), which is the central securities depository for capital market instruments. Total assets are derived from the financial statements of firms, which are obtained in the same way as the ROA. 4.2.2. Independent variables We used the following institution specific CG influences as in- dependent variables to examine their impact on firm performance. Ownership concentration (CONCEN) is measured as the percentage of shares held in blocks of 5 percent, or more (Nguyen, Locke, & Reddy, 2014; Tuschke & Sanders, 2003). Cross ownership (C-OWN) is measured by the percentage of corpo- rate shareholders to total shares (Faccioa & Lang, 2002; Dietzenbacher & Temurshoev, 2008). Foreign ownership (F-OWN) is measured using the percentage of foreign investor shares to total shares (Aydin, Sayim, & Yalama, 2007). Board size (B-SIZE) is measured by the number of directors appointed on board (Chiang & Lin, 2007; Mobbs, 2015; Perrini, Rossi, & Rovetta, 2008). Family board membership (B-FML) involves the presence of family board members. It is calculated by the percentage of family directors divided by the total number of directors (Anderson & Reeb, 2004; Ehikioya, 2009). The first three variables of CONCEN, C-OWN and F-OWN were ac- quired from the MKK, while B-SIZE and B-FML were obtained from the firm’s annual reports. Annual reports can be obtained either from a firm’s corporate web site or through the Public Disclosure Platform. In some cases, mostly where there is a lack of data or data that is not clear in the annual reports, data was requested from firms by phone or mail. 4.2.3. Board specific controls Women board membership (B-WMN) refers to the presence of women on boards, measured as the percentage of women directors on a board. Campbell and Minguez-Vera (2008) stress that the gender composition of a board can affect the quality of the controlling role and firm per- formance especially in countries where external mechanisms are less well developed. The presence of women on board has been associated with better monitoring, which will impact on firm values (Isidro & Sobral, 2015; Nielsen & Huse, 2010; Schnake, Williams, & Fredenberger, 2006). Executive board membership (B-EXE) represents the percentage of executive board members. Directors, who are responsible for an ad- ministrative task in the firm’s daily routines, while being a board member, can be defined as executive board members. Previous studies emphasize the relative importance of executive directors, suggesting that they contribute to available expertise, and facilitate more open discussion within management (Donaldson, 1990; Muth & Donaldson, 1998). In their study of Turkish banks, Kaymak and Bektas (2008) found a positive relationship between executive board members and firm performance. Independent board membership (B-IND) is the percentage of in- dependent and non-executive board members. It is measured as the percentage of independent members of a board (Bhagat & Bolton, 2008; Jackling & Johl, 2009; Singh et al., 2018). CEO duality (C-DUAL) or commonly board leadership is defined when a CEO is also chairperson of a board. CEO duality is measured using a dummy variable where “1” denotes whether the CEO also serves as a chairperson and “0” otherwise (Ehikioya, 2009; Veprauskaite & Adams, 2013). Fig. 1. Research framework. Table 1 Characteristics of the sample. Sample characteristics No (%) Firm age (years) Young firms (less than 10) 8 3.8 Middle age firms (10-19) 34 16.2 Mature firms (equal to or more than 20) 168 80.0 Sector of operation Holding and investment companies 24 11.4 Fabricated metal products, machinery and equipment 24 11.4 Non-metallic mineral products 22 10.5 Wholesale and retail trade, hotels and restaurants 22 10.5 Food, beverage and tobacco 19 9.0 Chemicals, petroleum rubber and plastic products 18 8.6 Basic metal industries 14 6.7 Textile, wearing apparel and leather 12 5.7 Technology 11 5.2 Paper and paper products, printing and publishing 11 5.2 Transportation, telecommunication and storage 9 4.3 Other services 24 11.4 Geographic location Marmara 144 68.6 Aegean 29 13.8 Inner Anatolia 16 7.6 Mediterranean 12 5.7 Black Sea 5 2.4 Other 4 1.9 Total 210 100 I. Ciftci et al. International Business Review 28 (2019) 90–103 94
- 6. 4.2.4. CG infrastructure specific controls Publicly held ownership (P-OWN) is calculated as the percentage of public shares to total shares. Corporate governance index (CG-IND) is used by BIST and involves quotations from firms who have proved to be compatible with the index requirements. CG-IND is measured by a dummy variable where “1” denotes firms listed in the CG index and “0” otherwise. The Public Disclosure Platform (www.kap.gov.tr) company notifications are par- tially used to obtain data about firms quoted on the CG index. 4.2.5. Firm specific controls Leverage (LEV) affects firm performance either positively or nega- tively. According to Campbell and Minguez-Vera (2008), leverage is negatively associated with firm performance because a higher level of debt increases the risk of bankruptcy. In contrast, Jensen (1986) notes a positive relationship between leverage and firm performance because high levels of debt decrease potential agency costs, which mean man- agers have less cash available after servicing the debt. Firm age (AGE) effects on firm performance are ambiguous. Sarkar and Sarkar (2000) stress that the performance of younger firm is higher because younger firms are likely to have newer assets relative to mature firms; hence, they are more likely to be able to comply with environ- mental legislation and it easier for them to position themselves in the market on the basis of their environmental responsiveness. However, mature firms possess accumulated knowledge about the country, and market. Mature firms are likely to have built up a level of market share, which may be more difficult for younger firms to match. With experi- ence, they may be more resistant to crises. Firm size (SIZE) also has an effect on firm performance. Zahra and Pearce (1989) and Su, Xu, and Phan, (2008) posit that larger firms are more likely to have larger boards, which, in turn, lead to greater agency costs (Jensen & Meckling, 1976); hence, firm size is negatively asso- ciated with firm performance. On the other hand, Setia-Atmaja (2009) found a positive relationship between firm size and board in- dependence. Mura (2007) explains that due to economies of scale, larger firms are expected to be more profitable. Larger firms can also access cheaper resources and funds. Industry (IND) is another contingent variable in our model. Firms in the manufacturing sector commonly invest in more machinery and equipment, while service sector firms use more funds for their adver- tisement and marketing expenditure. Group affiliation (GRP) is the last contingency variable. According to Zattoni, Pedersen, and Kumar (2009), a business group consists of in- dividual firms with multiple links and they are coordinated to attain common goals. Singh and Gaur (2009) examined the top 500 Indian and Chinese firms and found that the performance of group-affiliated firms was worse than unaffiliated firms. Zattoni et al. (2009) explain the costs of business groups. Costs arise between the controlling and minority shareholders, which lead to misallocation of capital. In- efficient compensation schemes and organization problems may also occur in group firms. Group firms present consolidated financial statements. The operationalization of all variables along with their sources is presented in Appendix 2. 4.3. Data analysis Our dataset includes both cross-sectional and time series observa- tions that fit panel data. It is consistent with prior studies (Campbell & Minguez-Vera, 2008; Tariq & Abbas, 2013; Veprauskaite & Adams, 2013; Zakaria, Purhanudin, & Palanimally, 2014). The specification test proposed by Hausman is the most accepted procedure to select which test to employ in panel data analysis (Baltagi, 2005). It compares fixed effect and random effect regressions. The Hausman specification test confirmed the superiority of the random effect model over the fixed effect model for both Tobin’s Q (χ2 = 15.34; p > 0.10) and ROA (χ2 = 17.77; p > 0.05). In this study, potential endogeneity between firm performance and CG variables is tested by Hansen J statistic (Bhagat & Bolton, 2008; Crespi & Renneboog, 2010). To employ this test, endogenous variables are instrumented by the lagged values of independent variables. The Hansen J statistic test examines whether the residuals of the equation correlate with the instruments. In case of significant correlation, the model is misspecified as such that there is systematic variance in the residuals that can be predicted by the instruments. Thus, parameter estimates are biased and cannot be trusted. The results of the Hansen J test fail to reject overidentification restrictions attesting that the in- strumental variables used throughout the models seem to be valid. The effects of CG mechanisms on firm performance are shown in the following equation: = + + − + − + − + − + − + − + − + − + − + − + + + + + + + PERF α β CONCEN β C OWN β F OWN β B SIZE β B FML β B WMN β B EXE β B IND β C DUAL β P OWN β CG IND β LEV β AGE β SIZE β IND β GRP μ v it 0it 1it 1it 2it 2it 3it 3it 4it 4it 5it 5it 6it 6it 7it 7it 8it 8it 9it 9it 10it 10it 11it 11it 12it 12it 13it 13it 14it 14it 15it 15it 16it 16it it it In the equation above, subscript i denotes ith firm (i = 1… 210), sub- script t denotes tth year (t = 2010… 2013). Considering Tobin’s Q and ROA variables as financial performance measures, two different panel regression models are constructed using Stata 12. 5. Results The descriptive statistics and the correlation coefficients among the dependent, independent and control variables are shown in Table 2. None of the correlations between explanatory variables has corre- lation coefficients above 0.63, and the pairwise correlations do not seem to present serious multicollinearity problems for the regression analyses. The variance inflation factors (VIF) for our variables are also far below the threshold value of 10 (Freund, Wilson, & Sa, 2006), suggesting that the issue of multicollinearity in models is not a concern in this study. The VIF scores are indicated in Appendix 3. An additional test, Condition Number Test (k), is used to check multicollinearity. The test result (k = 3.58) is found to be far less than the threshold value of 15, indicating that there is no multicollinearity. Table 3 presents the random effect regression models predicting the effects of the institution specific CG influences on firm performance. Panel data regression is also run in accordance with OLS and fixed ef- fects. The results of these regression analyses along with random effect are shown in Table 4. 5.1. Testing of hypotheses As shown in Table 3, two models are estimated for each dependent variable. As the first step, all three sets of control variables are entered (Model 1 and Model 3). The effects of the hypothesized variables are then tested in Models 2 and 4 where all independent variables along with control variables are tested, as shown in Table 3. There is full support for Hypothesis 1 in that the coefficient of CONCEN is positive and significant (p < 0.05) in both models. That is, the greater the ownership concentration the higher the firm perfor- mance. Our result is also consistent with previous studies (Ehikioya, 2009; Nguyen et al., 2014; Perrini et al., 2008; Singh & Gaur, 2009; Thomsen & Pedersen, 2000). To exemplify, drawing on a newly created dataset including 324 listed firms in Pakistan, Sing et al. (2018) find that ownership concentration is positively linked with high Tobin’s Q. Similarly, Nguyen et al. (2014), based on a sample of 257 Singaporean domiciled non-financial listed companies, note that ownership I. Ciftci et al. International Business Review 28 (2019) 90–103 95
- 7. concentration is positively related to Tobin’s Q. Again, using archival data on the top 500 Indian and Chinese firms from multiple data sources for 2007, Singh and Gaur (2009) conclude that ownership concentration denoted by the percentage of ownership held by the largest shareholder has a positive effect on firm performance measured by ROA. On the other hand, some researchers come up with contra- dictory results. For instance, relying on a panel data of 468 UK publicly listed firms, Veprauskaite and Adams (2013) find that ownership con- centration is negatively related to firm performance. In a similar vein, El Mehdi (2007), and Bektas and Kaymak (2009) note that ownership concentration has a negative effect on firm performance. Even more interestingly, a number of researchers such as Tuschke and Sanders (2003) and Sacristán-Navarro, Gómez-Ansón, and Cabeza-García (2011) are unable to find any significant relationship between owner- ship concentration and firm performance. It can be argued that more concentrated ownership means that the firm has closer and denser ties to core investors, and hence, better equipped to draw on the range of resources the latter has to offer (Hillman & Dalziel, 2003). Again, it is possible that concentrated ownership means that the organization is not pulled in different di- rections by different groupings of shareholders with very different agendas. Some partial support is found for Hypothesis 2. The coefficient of C- OWN is negative and significant for only ROA (p < 0.01). This means that increases in cross ownership do not influence market performance, but diminish accounting performance. It may be that dominant in- vestors exert pressure on managers to under-report results in order to deflect demands by minority shareholders for higher returns. It is clearly not the case that dominant investors are using their position to cross-subsidize other less successful organizations under their ambit (Abdullah, 2006). Hypothesis 3 is fully supported, as the coefficient of F-OWN is po- sitive and significant for both Tobin’s Q and ROA (p < 0.001). This finding tends to corroborate that of Aydin et al. (2007) who reveal that firms with foreign ownership show better performance (ROA) than domestic ones based on a dataset of 301 firms listed in BIST for the period of 2003-2004. It also aligns with the survey findings of Demirbag, Tatoglu, and Glaister (2007) who, based on a sample of Western-Turkish joint ventures in Turkey, note that the increase in the level of foreign ownership through foreign direct investment (FDI) provides connections to the external environment and helps decrease resource dependence because the interaction of local and foreign board members increases the board’s counselling and advisory services that improve firm performance. The coefficient of B-SIZE is positive for both performance indicators and significant2 . That is, it is positive and significant for Tobin’s Q (p < 0.001) and ROA (p < 0.01), providing full support for Hypoth- esis 4, confirming the view that with larger boards comes opportunities to access a fuller and wider range of family based networks and to build consensus between different interest groups. Although this finding aligns with those of previous studies (Dalton et al., 1999; Lipton & Lorsch, 1992; Singh et al., 2018; Veprauskaite & Adams, 2013), it contradicts with some earlier studiesas well. For instance, a group of researchers including Chiang and Lin (2007), Cheng (2008), Guest (2009) and Nguyen et al. (2014) find that board size is negatively as- sociated with firm performance. On the other hand, some researchers such as Bektas and Kaymak (2009) and Perrini et al. (2008) could not find any significant relationship between the board size and firm per- formance. No support is found for Hypothesis 5, as the coefficient of B-FML is Table 2 Descriptive statistics and correlation matrix. Variables Mean SD 1 2 3 4 5 6 7 8 9 10 11 12 13 14 15 16 17 18 1 TOBIN'S Q 0.94 1.09 1 2 ROA 0.04 0.11 0.25* 1 3 CONCEN 0.65 0.19 0.19* 0.12* 1 4 C-OWN 0.54 0.29 0.14* 0.09* 0.67* 1 5 F-OWN 0.19 0.25 0.18* 0.10* 0.23* 0.30* 1 6 B-SIZE 7.10 2.10 −0.01 0.14* 0.11* 0.18* 0.15* 1 7 B-FML 0.19 0.24 −0.15* 0.02 -0.17* −0.28* −0.24* −0.07 1 8 B-WMN 0.13 0.15 −0.11* 0.02 -0.04 −0.15* −0.17* −0.09* 0.21* 1 9 B-EXE 0.22 0.21 −0.11* -0.11* 0.13* −0.21* −0.08* −0.23* 0.07 0.31* 1 10 B-IND 0.18 0.16 −0.06 -0.08 -0.07 −0.04 −0.02 0.09 −0.07 −0.07 −0.11* 1 11 C-DUL 0.19 0.39 0.05 -0.01 -0.19* −0.29* 0.00 −0.22* 0.12** 0.18* 0.36* 0.00 1 12 P-OWN 0.47 0.25 −0.15* -0.13* -0.63* −0.40* −0.05 −0.14* 0.06 0.02 0.15* 0.07 0.24* 1 13 CG-IND 0.13 0.33 −0.05 0.07 -0.01 0.11* 0.12* 0.26* −0.09* −0.03 −0.09 0.09 −0.16* −0.08* 1 14 LEV 0.50 0.33 −0.11* −0.56* -0.01 −0.04 0.06 0.04 −0.03 −0.10 * 0.02 0.06 −0.05 0.02 0.01 1 15 AGE 3.37 0.67 −0.04 0.11* 0.03 0.05 0.08* 0.07 −0.02 0.01 −0.08 −0.05 −0.01 0.02 0.03 −0.09 1 16 SIZE 20.05 1.77 −0.22* 0.13* 0.13* 0.18* 0.25* 0.48* 0.06 −0.08 −0.17* 0.05 −0.23* −0.18* 0.33* 0.09 0.15* 1 17 IND 0.36 0.48 −0.08 −0.14* −0.14* −0.20* −0.04 0.05 −0.02 −0.04 0.09 0.09 * 0.04 0.02 −0.02 0.18* −0.26* 0.18* 1 18 GRP 0.63 0.48 −0.21* −0.10* -0.08 −0.04 0.02 0.13* 0.07 −0.10 * 0.05 0.06 0.00 0.09 0.13* 0.17* 0.14* 0.39* 0.14* 1 Notes: TOBIN’S Q: Tobin’s Q, ROA: Return on assets, CONCEN: Ownership concentration, C-OWN: Cross ownership, F-OWN: Foreign ownership, B-SIZE: Board size, B-FML: Family board membership, B-WMN: Women board membership, B-EXE: Executive board membership, B-IND: Independent board membership C-DUL: CEO duality, P-OWN: Publicly held ownership, CG-IND: CG, LEV: Leverage, AGE: Firm age, SIZE: Firm size, IND: Industry, GRP: Group affiliation. * p < 0.01, N = 840. 2 We have checked the possibility of having non-linear relationship in the model between board size (by taking its logarithm) and firm performance. According to the test results, no significant difference was found between the variables indicating non-linearity in the model. I. Ciftci et al. International Business Review 28 (2019) 90–103 96
- 8. not significant on the two performance outcomes. In other words, fa- mily board membership does not have any impact on firm performance within the context of Turkey. This would suggest that rather than being a zero-sum game, the relationship between family owners and other shareholders could represent a dynamic and contested relationship, imposing costs and conferring benefits on both sides. It could also be the case that in family dominated firms, boards are more likely to be filled with placemen; it matters less whether board members are family members or not, and more whether they are conducive to the im- plementation of family agendas. It should also be noted that this finding is not particularly surprising in that most of the previous studies come up with mixed results with respect to the effect of family board mem- bership on firm performance. While some studies find a positive re- lationship between family board membership and firm performance (e.g. Anderson & Reeb, 2004; Thomsen & Pedersen, 2000), others note an adverse effect of family board membership on firm performance (e.g. Ehikioya, 2009). Of the board specific control variables, only B-IND is found to have a negative and significant effect on Tobin’s Q (p < 0.001). In fact, non- executive independent board membership appointment was not com- pulsory in Turkey prior to 2012. The general tendency of firms is to appoint their close friends or the persons in their inner circles who have a limited or no effects on decision-making process. Existing work on Turkey suggests that independent members on the boards of Turkish companies often lack real autonomy (Arıkboga & Mentes, 2009; Usdiken & Yildirim-Oktem, 2008). As for CG infrastructure specific controls, both P-OWN and CG-IND have significant coefficients for Tobin’s Q. While the sign on P-OWN is negative (p < 0.01), it is positive for CG-IND (p < 0.05). The ne- gative coefficient of P-OWN may reflect the extent to which public scrutiny makes it much harder for family members to forge deals fa- cilitated by their extended networks. It also may mean that family members will be more inclined to engage in risky actions, as some of the costs will be borne by outsiders. On the other hand, the positive sign on CG-IND confirms that presence in the CG index has a significant relationship on performance in terms of Tobin’s Q. In terms of firm specific control variables, only LEV and SIZE are found to have significant effects (p < 0.001). We note that firms with lower leverage are more likely to achieve better performance as in- dicated by the negative coefficient of LEV. This might be due to cash flow effects, whereby the lower leverage firms enable more free cash for new investment opportunities. More highly leveraged firms may also have more commitments and covenants, however, which complicate the situation. This finding is somewhat at odds with a large body of agency theory, which suggests that debt leverage does not necessarily leave firms worse off; rather, it can serve as a positive device in helping prioritize shareholder interests. SIZE is noted to have a negative and significant effect on Tobin’s Q (p < 0.001), whereas it has a positive and significant influence on ROA (p < 0.001). In other words, smaller firms indicate better market performance, whereas accounting performance is better in larger firms. Larger firms can use economies of scale that reduce production or service costs. Larger firms have also negotiation advantages. This can decrease the cost of capital and increase firm performance when com- pared to smaller firms. Again, this would be somewhat at odds with the assumption that very large firms often represent the product of unto- ward managerial empire building. However, larger firms face co- ordination problems, whilst smaller firms are able to reach decisions more quickly. Smaller firms are also better equipped to circumnavigate the law in settings where institutional coverage is incomplete. In terms of our other control variables, women board membership, executive board membership, CEO duality, firm age, industry and group affiliation are not significantly associated with firm performance. A summary of the hypotheses with the independent variables and their predicted and actual signs is shown in Table 5. 6. Discussion and conclusion This study supplements earlier resource-based and agency accounts in bringing an institutional perspective to bear in understanding the consequences of specific internal CG arrangements within a national setting characterized as family capitalism. We found that ownership concentration directly influenced firm performance. This would reflect the extent to which families may be adept in devising strategies for Table 3 The results of panel data analyses. Variable Variable Definition TOBIN'S Q ROA Model 1 Model 2 Model 3 Model 4 β S.E β S.E β S.E β S.E Independent variables CONCEN Ownership concentration 0.44* 04.3 0.05* 0.03 C-OWN Cross ownership 0.02 0.20 −0.04** 0.02 F-OWN Foreign ownership 0.59*** 0.19 0.05*** 0.02 B-SIZE Board size 0.07*** 0.02 0.00** 0.00 B-FML Family board membership −0.15 0.17 0.01 0.02 Board specific controls B-WMN Women board membership −0.30 0.25 −0.15 0.25 −0.00 0.03 0.00 0.03 B-EXE Executive board membership −0.08 0.20 −0.02 0.20 −0.01 0.02 −0.01 0.02 B-IND Independent board membership −0.19* 0.13 −0.37*** 0.13 −0.02 0.02 −0.02 0.02 C-DUL CEO duality −0.11 0.13 0.01 0.13 0.01 0.01 0.00 0.01 CG infrastructure specific controls P-OWN Publicly held ownership −0.79*** 0.22 −0.52** 0.25 −0.03* 0.02 −0.02 0.02 CG-IND CG index 0.18* 0.13 0.19* 0.13 0.00 0.01 0.00 0.01 Firms specific controls LEV Leverage −0.67*** 0.15 −0.67*** 0.15 −0.21*** 0.02 −0.22*** 0.02 AGE Firm age −0.02 0.10 −0.05 0.10 0.01 0.01 0.01 0.01 SIZE Firm size −0.31*** 0.04 −0.36*** 0.04 0.01*** 0.00 0.01*** 0.00 IND Industry 0.08 0.15 0.12 0.15 −0.01 0.01 −0.01 0.01 GRP Group affiliation 0.08 0.15 0.10 0.15 −0.01 0.01 −0.01 0.01 Constant 7.8*** 0.78 7.90*** 0.78 −0.10* 0.06 −0.10* 0.06 Observations 746 745 750 749 Adjusted R-square 0.09 0.14 0.26 0.29 * p < 0.05; **p < 0.01; ***p < 0.001. I. Ciftci et al. International Business Review 28 (2019) 90–103 97
- 9. filling institutional voids (Liu et al., 2012). The study reveals that when ownership is concentrated, often in the hands of key families, this re- sults in firms performing better. This is because systemic benefits may be optimized: A high concentration of ownership incentivizes families to work together in optimizing performance, as there is a smaller pro- portion of outsiders that will share the costs of failure. At the same time, it provides greater incentives for other actors with links to the dominant family to facilitate the activities of the firm. Within family capitalism, it is precisely such extended family based and associated networks that provide the basis of competitiveness; indeed, the system is skewed in favor of such networks (Fainshmidt et al., 2016). In Turkey, cross ownership often is used as a means of ensuring family control even when the latter has a minority stake (Demirag & Serter, 2003). We found that the performance effects of cross ownership were mixed. This would suggest that any negative effects associated with an ability to offload risks onto other, relatively disempowered shareholders, might be offset with the benefits this may confer. Effec- tively, this allows dominant families to control a wider number of firms than their capital resources would otherwise suggest. In turn, such firms benefit from access to the kind of family based networks that are crucial to accessing markets and resources in such institutional environments. At the same time, the disjuncture between market and (sub-optimal) Table 4 Regression results in terms of different models. Variables Ordinary Least Square Fixed Effect Random Effect Ordinary Least Square Fixed Effect Random Effect TOBIN'S Q TOBIN'S Q TOBIN'S Q ROA ROA ROA CONCEN 0.679** 0.690** 0.445* 0.0556** −0.00938 0.0492* (0.303) (0.426) (0.342) (0.0262) (0.0624) (0.0343) C-OWN −0.160 −0.0121 0.0221 −0.0432*** −0.0301 −0.0416** (0.176) (0.246) (0.200) (0.0153) (0.0364) (0.0201) F-OWN 0.823*** 0.0923 0.586*** 0.0422*** 0.0220 0.0471*** (0.158) (0.249) (0.193) (0.0137) (0.0365) (0.0185) B-SIZE 0.0443** 0.0755*** 0.0738*** 0.00357** 0.00483* 0.00381** (0.0192) (0.0215) (0.0191) (0.00163) (0.00316) (0.00203) B-FML −0.138 −0.135 −0.150 0.00405 0.0236 0.00953 (0.157) (0.207) (0.174) (0.0136) (0.0306) (0.0177) B-WMN −0.635*** 0.116 −0.149 −0.00415 0.0398 0.00252 (0.260) (0.281) (0.253) (0.0226) (0.0413) (0.0278) B-EXE −0.454*** 0.282 −0.0154 −0.0243* 0.0343 −0.00655 (0.192) (0.227) (0.198) (0.0167) (0.0335) (0.0211) B-IND −0.146 0.000649 −0.368*** −0.0310* −0.00539 −0.0195 (0.225) (0.155) (0.134) (0.0195) (0.0225) (0.0173) C_DUAL 0.239** −0.0222 0.0149 0.0101 0.0101 0.00296 (0.103) (0.171) (0.128) (0.00892) (0.0253) (0.0121) P-OWN −0.479*** 0.0872 −0.524** −0.0188 0.0101 −0.0213 (0.184) (0.394) (0.253) (0.0160) (0.0578) (0.0224) CG-IND 0.0606 0.110 0.188* 0.00549 −0.0201 8.86e-05 (0.108) (0.159) (0.129) (0.00936) (0.0235) (0.0126) LEV −0.827*** −0.554*** −0.670*** −0.181*** −0.301*** −0.219*** (0.145) (0.170) (0.146) (0.0125) (0.0250) (0.0157) AGE −0.0379 −0.638*** −0.0509 0.00591 0.0117 0.00770 (0.0626) (0.263) (0.101) (0.00541) (0.0386) (0.00783) SIZE −0.179*** −0.647*** −0.358*** 0.00995*** 0.00872** 0.00997*** (0.0300) (0.0576) (0.0388) (0.00234) (0.00461) (0.00290) IND 0.0530 – 0.120 −0.0139** – −0.0113 (0.0824) – (0.148) (0.00711) – (0.0107) GRP −0.123* – 0.101 −0.0155** – −0.0107 (0.0842) – (0.148) (0.00726) – (0.0108) Constant 4.697*** 15.28*** 7.900*** −0.107** −0.0653 −0.103* (0.587) (1.358) (0.785) (0.0480) (0.161) (0.0624) Observations 745 745 745 749 749 749 R-squared 0.212 0.063 0.155 0.299 0.219 0.293 Number of groups – 197 197 – 197 197 Notes: Standard errors in parentheses. * p < 0.1, **p < 0.05, ***p < 0.01. Table 5 Summary of hypotheses. Hypothesis Variable Name Expected Sign Actual Sign (TOBIN'S Q) Actual Sign (ROA) Level of Support Independent variables H1 There is a positive association between ownership concentration and firm performance. CONCEN (+) (+)* (+)* Supported H2 There is a negative association between the share of cross ownership and firm performance. C-OWN (-) (+) (-)** Partially supported H3 There is a positive association between the share of foreign ownership and firm performance. F-OWN (+) (+)*** (+)*** Supported H4 There is a positive association between board size and firm performance. B-SIZE (+) (+)*** (+)** Supported H5 There is a positive association between the proportion of family board members and firm performance. B-FML (+) (-) (+) Not supported * p < 0.05, **p < 0.01, ***p < 0.001. I. Ciftci et al. International Business Review 28 (2019) 90–103 98
- 10. accounting performance in such firms might suggest that controlling families may under-report result interlocking ownership would reduce pressures by outside shareholders, resulting in an accounting perfor- mance being a lesser priority than would otherwise be the case (Jaggi, Leung, & Gul, 2009). At the same time, we encountered beneficial effects flowing from FDI. Whilst a scrutiny of earlier relevant research might make such a finding relatively predictable (Fainshmidt et al., 2016), our study highlights the extent to which family ownership may perform even better when they have access to knowledge and insights from outsiders, and access to their networks. Hence, we found that when firms at- tracted overseas investment, similarly performed better. Not only might overseas investors provide knowledge on emerging global best prac- tices, but also their access to international networks that might sup- plement domestic family based ones. Again, we found that when firms had larger boards, they performed better. Larger boards may allow more leeway for professional managers to exercise their judgement, helping create more space for fresh in- sights. They would also mean that there is more place to accommodate different interest groupings within the dominant family, draw in ex- tended kin, and allow access to a greater pool of knowledge and, po- tentially access to a wider range of personal and familial networks. Under family capitalism, it is precisely access to such networks that forms the foundation of competiveness, providing a mechanism for coping with failures in formal institutions, providing a greater pre- dictability in exchange relations, and, potentially, solutions for over- coming or circumnavigating unwelcome regulation. They may also in- fluence the allocation of capital, mitigating excessive risks from over- allocation in a specific area, and, hence, offsetting some of the limita- tions of family ownership in this regard (Tabalujan, 2002) Although it could be argued that family ownership brings with it specific problems in its own right – most notably in terms of the allo- cation of capital – it could also be argued that they represent a specific mode of ownership that is particularly suited to specific categories of emerging market (Uddin, 2005). Above all, a core theoretical finding is the importance of context, and the extent to which universalistic ex- planations of CG need to be qualified and altered to take account of very different institutional and social realities. Internal CG is likely to be amended to take advantages of the opportunities and compensate for the challenges imposed by specific national institutional realities, and associated informal social conventions. Our findings highlight most optimal internal CG configurations to maximize systemic benefits and compensate for weaknesses. Clearly, there is no single optimal internal CG ‘recipe’; rather, in specific contexts, dominant forms evolve that are best equipped to cope with, and gain the optimal benefits from a par- ticular setting. This would highlight the relevance of socio-economic approaches to comparative institutional analysis (Amable, 2003; Sinani, Stafsudd, Thomsen, Edling, & Randøy, 2008), but also the re- levance of detailed analysis of internal CG mechanisms in extending our understanding of national institutional effects. Although specifically focusing on Turkey, the findings would be of relevance to other national contexts with uneven and relatively fluid institutions and where family firms play a particularly prominent role: This would include other Mediterranean market economies (Amable, 2003), potentially a wider range of emerging markets further afield, and, indeed, as a basis for future comparative analysis. 6.1. Managerial implications The empirical results show statistically significant and positive as- sociations between ownership concentration, foreign ownership, board size and firm performance and, to a lesser extent negative association between cross ownership and firm performance. In Turkey, ownership concentration is high because firms are generally reluctant to enter into an Initial Public Offering (IPO) process. Organizations that are willing to go public are required to publish a significant amount of financial and operational information. For this reason, organizations feel that they lose competitive advantages in the market; this could also reflect the concern that this may place the pursuit of family interests under undue public scrutiny. Publicly traded firms also have to obey addi- tional regulations especially in sectors such as banking, insurance, tel- ecommunications, and energy. Although this may distort firm level decision-making, the findings suggest that firms are quite good at im- provising solutions and, hence, that regulatory reform may disrupt existing ‘fixes’ without bringing with them better alternative ones. Family businesses in Turkey have incentive to monitor subsidiaries via a cross-shareholding structure; this may have some adverse con- sequences, but the picture we found was equivocal in the latter regard. Although we found that the proportion of family members on boards had no effect, this would reflect the extent to which non-family board members may be carefully selected not only because of their potential influence and expertise, but also because of their relative conduciveness to family interests. 6.2. Limitations and future research While this study sheds light on the extant literature regarding the connection between CG and firm performance, it is subject to some limitations. Some of the important variables typically deployed in stu- dies of this nature, such as CEO and board tenure, CEO and board compensation, managerial or director ownership and board process (number of board meetings and number of decisions taken), were not included in the study due to the unavailability of panel data for these variables. When the study was undertaken, the number of firms quoted in BIST was 428, whereas this research relied on a sample of 210 firms com- posed of mainly large scale and long-established firms. A new dataset involving SMEs and relatively younger firms may also be a valuable contribution to CG performance research in emerging countries such as Turkey. Finally, in exploring the relationship between national in- stitutions, internal governance and performance, the study provides a foundation of understanding in specific contextual dynamics; a com- parative dimension would yield fuller insights on firm level outcomes in contexts where families are a dominant ownership form. Acknowledgements The authors are indebted to the editor and two anonymous re- viewers for their extremely helpful and insightful comments, which enabled us to greatly improve on earlier iterations of this paper. Appendix 1 BIST market definitions pre-november 2015 Market Definition Number of Firms NATIONAL MARKET It is the market where the stocks of companies that satisfy BIST listing requirements are traded. 234 SECOND NATIONAL MARKET It is the market where stocks of the companies that fail to satisfy the applicable listing and trading requirements for National Market, stocks of small and medium sized enterprises and companies, which are temporarily or permanently delisted from National Market, are traded. 78 I. Ciftci et al. International Business Review 28 (2019) 90–103 99
- 11. WATCH LIST COMPANIES MARKET In the case that companies are subject to monitoring and examination as a result of the occurrence of certain conditions, the stocks of such companies can be traded on the BIST Watch list Companies Market under continuous surveillance, supervision and monitoring, along with measures to inform investors in a continuous and timely manner. 22 COLLECTIVE PRODUCTS MARKET It is the market where the stocks of investment trusts, real estate investment trusts, venture capital investment trusts and the participation certificates of ETFs are traded. 66 EMERGING COMPANIES MARKET It is the market established to create a transparent and organized platform where securities, issued in order to raise funds from the capital markets by companies, which could not satisfy the BIST listing requirements but with growth and development potential, can be traded. 11 FREE TRADING PLATFORM It includes the stocks of companies trading in Free Trading Platform. 17 OFF EXCHANGE It includes the stocks of companies that are delisted or suspended from trading by the BIST Executive Council. – TOTAL 428 Appendix 2 Operationalization of variables Variable Measurement Source Related measurement previously used Tobin's Q The percentage of market value of a firm to total assets. Central Registry Agency (www.mkk.com.tr) and auditing financial statements. Nguyen et al. (2014); Veprauskaite and Adams (2013); Heenetigala (2011); Renders, Gaeremynck, and Sercu, (2010); Bozec, Bozec, and Dia, (2010); Guest (2009); Ehikioya (2009); Jackling and Johl (2009); Setia-Atmaja (2009); Perrini et al. (2008); El Mehdi (2007) 2. Return on assets The percentage of net income to total assets. Auditing financial statements Ellwood and Garcia-Lacalle (2014); Veprauskaite and Adams (2013); Bektas and Kaymak (2009); Ehikioya (2009); Jackling and Johl (2009); Bauwhede (2009); Aydin et al. (2007); Krishnan and Park (2005); Thomsen and Pedersen (2000) 3. Ownership concentra- tion Shareholders who own at least 5 percent of the firm’s ordinary shares. Central Registry Agency (www.mkk.com.tr) Nguyen et al. (2014); Veprauskaite and Adams (2013); Sacristán-Navarro et al. (2011); Bektas and Kaymak (2009); Ehikioya (2009); Setia- Atmaja (2009); Perrini et al. (2008); El Mehdi (2007); Tuschke and Sanders (2003); Thomsen and Pedersen (2000) 4. Cross ownership The percentage of firms share (rather than individual share) to total shares. Central Registry Agency (www.mkk.com.tr) Faccioa and Lang (2002); Dietzenbacher and Temurshoev (2008) 5. Foreign ownership The percentage of foreign investors share to total shares Central Registry Agency (www.mkk.com.tr) Aydin et al. (2007) 6. Board size The total number of members on the board of directors. Firms' annual reports and corporate web pages Mobbs (2015); Nguyen et al. (2014); Zakaria et al. (2014); Veprauskaite and Adams (2013); Guest (2009); Jackling and Johl (2009); Kaymak and Bektas (2008); Cheng (2008); Perrini et al. (2008); El Mehdi (2007); Chiang and Lin (2007); Kyereboah-Coleman and Biekpe (2006) 7.Family board member- ship The number of family members divided by the total number of board of directors. Firms' annual reports and corporate web pages Ehikioya (2009); Anderson and Reeb (2004) 8. Women board member- ship The number of female directors divided by the total number of board of directors. Firms' annual reports and corporate web pages Isidro and Sobral (2015); Ellwood and Garcia- Lacalle (2014); Campbell and Minguez-Vera (2008); Schnake et al. (2006) 9. Executive board member- ship The number of executive directors divided by the total number of board of directors Firms' annual reports and corporate web pages Mobbs (2015); Kaymak and Bektas (2008) I. Ciftci et al. International Business Review 28 (2019) 90–103 100
- 12. 10. Independe- nt board member- ship The number of independent directors divided by the total number of board of directors. Firms' annual reports and corporate web pages Nguyen et al. (2014); Zakaria et al. (2014); Agrawal and Knoeber (2012); Heenetigala (2011); Chiang and He (2010); Bektas and Kaymak (2009); Jackling and Johl (2009); Singh and Gaur (2009); Setia-Atmaja (2009); Bhagat and Bolton (2008); Mura (2007); El Mehdi (2007); Kyereboah- Coleman and Biekpe (2006); Anderson and Reeb (2004); Abdullah (2004); Bhagat and Black (2002) 11. CEO duality Chairman of the board and CEO are the same individual. Equals 1 if CEO is also the chairperson of the board, otherwise 0. Firms' annual reports and corporate web pages Nguyen et al. (2014); Veprauskaite and Adams (2013); Heenetigala (2011); Bektas and Kaymak (2009); Ehikioya (2009); Jackling and Johl (2009); Kaymak and Bektas (2008); Bhagat and Bolton (2008); Chiang and Lin (2007); Kyereboah- Coleman and Biekpe (2006); Abdullah (2004) 12. Publicly held ownership The percentage of publicly traded share to total shares. Central Registry Agency (www.mkk.com.tr) – 13. Corporate governance index Whether a firm is quoted in Corporate Governance index (BIST) or not. Equals 1 if firms’ quoted in CG index, otherwise 0. Public Disclosure Platform (www.kap.gov.tr) Renders et al. (2010); Bauwhede (2009); Bozec et al. (2010); Black, Kim, and Jang, (2006); Tuschke and Sanders (2003) 14. Leverage The sum of short-term and long-term debt divided by total assets. Auditing financial statements Ellwood and Garcia-Lacalle (2014); Nguyen et al. (2014); Zakaria et al. (2014); Veprauskaite and Adams (2013); Jackling and Johl (2009); Setia- Atmaja (2009); Mura (2007); Chiang and Lin (2007); Campbell and Minguez- Vera (2008) 15. Firm age Natural log of age of firm from date of incorporation. Public Disclosure Platform (www.kap.gov.tr) Nguyen et al. (2014); Zakaria et al. (2014); Ehikioya (2009); Jackling and Johl (2009); Singh and Gaur (2009); Setia-Atmaja (2009); Anderson and Reeb (2004) 16. Firm size Natural logarithm of the total assets owned by the firm. Auditing financial statements Ellwood and Garcia-Lacalle (2014); Nguyen et al. (2014); Zakaria et al. (2014); Veprauskaite and Adams (2013); Agrawal and Knoeber (2012); Guest (2009); Ehikioya (2009); Jackling and Johl (2009); Singh and Gaur (2009); Setia-Atmaja (2009); Perrini et al. (2008); Campbell and Minguez-Vera (2008); Mura (2007); El Mehdi (2007); Chiang and Lin (2007); Kyereboah- Coleman and Biekpe (2006); Krishnan and Park (2005); Anderson and Reeb (2004); Tuschke and Sanders (2003) 17. Industry Whether a firm is service or manufacturing firm. Equals 1 if firms’ belongs to a manufacturing industry, otherwise 0. Public Disclosure Platform (www.kap.gov.tr) Ehikioya (2009); Setia-Atmaja (2009); Perrini et al. (2008) 18. Group affiliation Whether a firm financials presents consolidated or stand-alone. Equals 1 if firms’ financials present consolidated, otherwise 0. Firms' annual reports Zattoni et al. (2009); Singh and Gaur (2009) Appendix 3 Variance inflation factors # Variables VIF 1/VIF 1 CONCEN 2.72 0.37 2 C-OWN 2.20 0.45 3 F-OWN 1.30 0.77 4 B-SIZE 1.39 0.72 5 B-FML 1.21 0.83 6 B-WMN 1.16 0.86 7 B-EXE 1.31 0.76 8 B-IND 1.05 0.95 9 C_DUAL 1.33 0.75 10 P-OWN 1.81 0.55 11 CG-IND 1.21 0.83 12 LEV 1.12 0.90 I. Ciftci et al. International Business Review 28 (2019) 90–103 101
- 13. 13 AGE 1.17 0.86 14 SIZE 2.12 0.47 15 IND 1.30 0.77 16 GRP 1.37 0.73 Mean VIF 1.49 References Abdullah, S. N. (2004). Board composition, CEO duality and performance among Malaysian listed companies. Corporate Governance: The International Journal of Business in Society, 4(4), 47–61. Abdullah, S. N. (2006). Directors’ remuneration, firm’s performance and corporate gov- ernance in Malaysia among distressed companies. Corporate Governance: The International Journal of Business in Society, 6(2), 162–174. Agrawal, A., & Knoeber, C. R. (2012). Firm performance and mechanisms to control agency problems between managers and shareholders. The Journal of Financial and Quantitative Analysis, 31(3), 377–397. Aguilera, R. V., & Cuervo-Cazurra, A. (2009). Codes of good governance. Corporate Governance an International Review, 17(3), 376–387. Alpay, G., Bodur, M., Ener, H., & Talug, C. (2005). Comparing board-level governance at MNEs and local firms: Lessons from Turkey. Journal of International Management, 11(1), 67–86. Amable, B. (2003). The diversity of modern capitalism. Oxford: Oxford University Press. Anderson, R. C., & Reeb, D. M. (2004). Board composition: Balancing family influence in S &P 500 firms. Administrative Science Quarterly, 49(2), 209–237. Ararat, M., & Ugur, M. (2006). Turkey: Corporate governance at the crossroads. In C. A. Mallin (Ed.). Handbook on international corporate governance country analyses (pp. 193–209). Cheltenham and Northampton: Edward Elgar Publishing Limited. Ararat, M., Orbay, H., & Yurtoglu, B. B. (2010). The effects of board independence in con- trolled firms: Evidence from Turkey. Available at:https://papers.ssrn.com/sol3/papers. cfm?abstract_id=1663403. Arıkboga, S., & Mentes, A. (2009). Türkiye’de kurumsal yönetişim iklimi (Corporate governance climate in Turkey). İktisat Fakültesi Mecmuası, 59(2), 85–120. Atakan, S., Ozsoy, Z., & Oba, B. (2008). Implementation of good corporate governance in Turkey: The case of Dogan Yayin Holding. Human Systems Management, 27, 201–216. Aydin, N., Sayim, M., & Yalama, A. (2007). Foreign ownership and firm performance: Evidence from Turkey. International Research Journal of Finance and Economics, 11, 127–150. Baltagi, B. H. (2005). Econometric analysis of panel data (third edition). West Sussex: John Wiley and Sons. Banks, E. (2004). Corporate governance financial responsibility, controls and ethics. NewYork: Palgrave Macmillan. Bauwhede, H. V. (2009). On the relation between corporate governance compliance and operating performance. Accounting and Business Research, 39(5), 497–513. Bebchuk, L. A., Kraakman, R., & Triantis, G. (2000). Stock pyramids, cross-ownership, and dual class equity: The mechanisms and agency costs of separating control from cash-flow rights. Concentrated corporate ownership. University of Chicago Press295–318. Available at: http://www.nber.org/chapters/c9013.pdf. Bektas, E., & Kaymak, T. (2009). Governance mechanisms and ownership in an emerging market: The case of Turkish banks. Emerging Markets Finance and Trade, 45(6), 20–32. Berghe, L. V. D. (2002). Corporate governance in a globalising world: Convergence or diver- gence? A European perspective. New York, Boston, Dordrecht, London, Moscow: Kluwer Academic Publishers. Bhagat, S., & Black, B. (2002). The non-correlation between board independence and long-term firm performance. The Journal of Corporation Law, 27, 231–273. Bhagat, S., & Bolton, B. (2008). Corporate governance and firm performance. Journal of Corporate Finance, 14, 257–273. Black, B. S., Kim, W., & Jang, H. (2006). Does corporate governance affect firm value? Evidence from Korea. Journal of Law, Economics, & Organization, 22(2), 366–413. Bozec, R. (2007). US market integration and corporate governance practices: Evidence from Canadian companies. Corporate Governance: An International Review, 15(4), 535–545. Bozec, Y., Bozec, R., & Dia, M. (2010). Overall governance, firm value and deviation from one share: One vote principle. International Journal of Managerial Finance, 6(4), 305–328. Brewster, C., Wood, G., & Brookes, M. (2008). Similarity, isomorphism or duality? Recent survey evidence on the HRM policies of MNCs. British Journal of Management, 19(4), 320–342. Bugra, A., & Savaşkan, O. (2014). New capitalism in Turkey: The relationship between pol- itics, religion and business. Cheltenham Edward Elgar Publishing. Campbell, K., & Minguez-Vera, A. (2008). Gender diversity in the boardroom and firm financial performance. Journal of Business Ethics, 83, 435–451. Carney, M. (2005). Corporate governance and competitive advantage in family-controlled firms. Entrepreneurship Theory and Practice, 29(3), 249–265. Cheng, S. (2008). Board size and the variability of corporate performance. Journal of Financial Economics, 87, 157–176. Chen, E., & Nowland, J. (2010). Optimal board monitoring in family-owned companies: Evidence from Asia. Corporate Governance: An International Review, 18(1), 3–17. Chiang, H. T., & He, L. J. (2010). Board supervision capability and information trans- parency. Corporate Governance: An International Review, 18(1), 18–31. Chiang, M.-H., & Lin, J.-H. (2007). The relationship between corporate governance and firm productivity: Evidence from Taiwan’s manufacturing firms. Corporate Governance: An International Review, 15(5), 768–779. Church, R. (1993). The family firm in industrial capitalism: International perspectives on hypotheses and history. Business History, 35(4), 17–43. Collings, D., Demirbag, M., Mellahi, K., Tatoglu, E., & Wood, G. (2014). High-perfor- mance work systems and organizational performance in emerging economies: Evidence from MNEs in Turkey. Management International Review, 54(3), 325–359. Crespi, R., & Renneboog, L. (2010). Is (Institutional) shareholder activism new? Evidence from UK shareholder coalitions in the Pre-Cadbury era. Corporate Governance: An International Review, 18(4), 274–295. Dalton, R. D., Daily, C. H., Johnson, J. L., & Ellstrand, A. E. (1999). Number of directors and financial performance: A meta-analysis. Academy of Management Journal, 42(6), 674–686. Demirag, I., & Serter, M. (2003). Ownership patterns and control in Turkish listed com- panies. Corporate Governance: An International Review, 11(1), 40–51. Demirbag, M., Tatoglu, E., & Glaister, K. W. (2007). Factors influencing perceptions of performance: The case of western FDI in an emerging market. International Business Review, 16(3), 310–336. Demirbag, M., Fracknall-Hughes, Glaister, K. W., & Tatoglu, E. (2013). Ethics and taxa- tion: A cross-national comparison of UK and Turkish firms. International Business Review, 22(1), 100–111. Demirbag, M., Wood, G. T., Makhmadshoev, D., & Rymkevich, O. (2017). Varieties of CSR: Institutions and socially responsible behaviour. International Business Review, 26(6), 1064–1074. Dietzenbacher, E., & Temurshoev, U. (2008). Ownership relations in the presence of cross-shareholding. Journal of Economics, 95(3), 189–212. DiMaggio, P. J., & Powell, W. W. (1991). The new institutionalism in organizational analysis. Chicago, IL: University of Chicago Press. Donaldson, L. (1990). The ethereal hand: Organizational economics and management theory. Academy of Management Review, 15(3), 369–381. Dore, R. (2008). Best practice winning out. Socio-Economic Review, 6(4), 779–784. Dumludag, D. (2009). An analysis of the determinants of foreign direct investment in Turkey: The role of the institutional context. Journal of Business Economics and Management, 10(1), 15–30. Earle, J. S., Kucsera, C., & Telegdy, Á. (2005). Ownership concentration and corporate performance on the Budapest stock exchange: Do too many cooks spoil the goulash? Corporate Governance: An International Review, 13(2), 254–263. Ehikioya, B. I. (2009). Corporate governance structure and firm performance in devel- oping economies: Evidence from Nigeria. Corporate Governance: The International Journal of Business in Society, 9(3), 231–243. El Mehdi, K. I. (2007). Empirical evidence on corporate governance and corporate per- formance in Tunisia. Corporate Governance: An International Review, 15(6), 1429–1441. Ellwood, S., & Garcia-Lacalle, J. (2014). The influence of presence and position of women on the boards of directors: The case of NHS foundation trusts. Journal of Business Ethics, 130, 69–84. Faccioa, M., & Lang, L. H. P. (2002). The ultimate ownership of Western European cor- porations. Journal of Financial Economics, 65(3), 365–395. Fainshmidt, S., Judge, W. Q., Aguilera, R. V., & Smith, A. (2016). Varieties of institutional systems: A contextual taxonomy of understudied countries. Journal of World Business, 53(3), 307–322. Finegold, D., Benson, G. S., & Hecht, D. (2007). Corporate boards and company perfor- mance: Review of research in light of recent reforms. Corporate Governance: An International Review, 15(5), 865–878. Freund, R. J., Wilson, W. J., & Sa, P. (2006). Regression analysis: Statistical modeling of response variable (second edition). London: Elsevier Inc. Górriz, C. C., & Fumás, V. (1996). Ownership structure and firm performance: Some empirical evidence from Spain. Managerial and Decision Economics, 17, 575–586. Greenwood, R., & Hinings, C. R. (1996). Understanding radical organizational change: Bringing together the old and the new institutionalism. Academy of Management Review, 21(4), 1022–1054. Guest, P. M. (2009). The impact of board size on firm performance: Evidence from the UK. European Journal of Finance, 15(4), 385–404. Hall, P., & Soskice, D. (2001). An introduction to the varieties of capitalism. In P. Hall, & D. Soskice (Eds.). Varieties of capitalism: The institutional basis of competitive advantage. Oxford: Oxford University Press. Hancke, B., Rhodes, M., & Thatcher, M. (2007). Introduction. In B. Hancke, M. Rhodes, & M. Thatcher (Eds.). Beyond varieties of capitalism: Conflict, contradiction, and com- plementarities in the European economy.. Oxford: Oxford University Press. Heenetigala, K. (2011). Corporate governance practices and firm performance of listed companies in Sri Lanka. Unpublished doctoral dissertationMelbourne: Victoria University. Heugens, P. P., Van Essen, M., & van Oosterhout, J. H. (2009). Meta-analyzing ownership concentration and firm performance in Asia: Towards a more fine-grained under- standing. Asia Pacific Journal of Management, 26(3), 481–512. Hilb, M. (2006). New corporate governance successful board tools (second edition). Berlin: I. Ciftci et al. International Business Review 28 (2019) 90–103 102
- 14. Springer Science and Business Media. Hillman, A. J., & Dalziel, T. (2003). Boards of directors and firm performance: Integrating agency and resource dependence perspectives. Academy of Management Review, 28(3), 383–396. Hoon, J., & Prather, L. J. (2001). Tobin’s q, agency conflicts, and differential wealth effects of international joint ventures. Global Finance Journal, 12, 267–283. Hoskisson, R. E., Wright, M., Filatotchev, I., & Peng, M. (2013). Emerging multinationals from mid-range economies: The influence of institutions and factor markets. Journal of Management Studies, 50(7), 1295–1321. Isidro, H., & Sobral, M. (2015). The effects of women on corporate boards on firm value, financial performance, and ethical and social compliance. Journal of Business Ethics, 132(1), 1–19. Jackling, B., & Johl, S. (2009). Board structure and firm performance: Evidence from India’s top companies. Corporate Governance: An International Review, 17(4), 492–509. Jaggi, B., Leung, S., & Gul, F. (2009). Family control, board independence and earnings management: Evidence based on Hong Kong firms. Journal of Accounting and Public Policy, 28(4), 281–300. Jensen, C. M. (1986). Agency costs of free cash flow, corporate finance and takeovers. American Economic Review, 76, 323–329. Jensen, C. M., & Meckling, W. (1976). Theory of the firm: Managerial behavior, agency costs, and capital structure. Journal of Financial Economics, 3(4), 305–360. Johannisson, B., & Huse, M. (2000). Recruiting outside board members in the small fa- mily business: An ideological challenge. Entrepreneurship & Regional Development, 12(4), 353–378. Karadag, R. (2010). Neoliberal restructuring in Turkey: From state to oligarchic capitalism (No. 10/7). MPIfG Discussion Paper. Kaymak, T., & Bektas, E. (2008). East meets west? Board characteristics in an emerging market: Evidence from Turkish banks. Corporate Governance: An International Review, 16(6), 550–561. Klapper, L. F., & Love, I. (2004). Corporate governance, investor protection, and per- formance in emerging markets. Journal of Corporate Finance, 10, 703–728. Krishnan, H. A., & Park, D. (2005). A few good women - on top management teams. Journal of Business Research, 58, 1712–1720. Kula, V. (2005). The impact of the roles, structure and process of boards on firm per- formance: Evidence from Turkey. Corporate Governance: An International Review, 13(2), 265–276. Kyereboah-Coleman, A., & Biekpe, N. (2006). The link between corporate governance and performance of the non-traditional export sector: Evidence from Ghana. Corporate Governance: The International Journal of Business in Society, 6(5), 609–623. La Porta, R., Lopez-de-Silanes, F., Shleifer, A., & Vishny, R. W. (1997). Legal determinants of external finance. Journal of Finance, 52(2), 1131–1150. La Porta, R., Lopez-de-Silanes, F., & Shleifer, A. (1999). Corporate ownership around the world. Journal of Finance, 54(2), 471–517. Lam, T., & Lee, S. (2012). Family ownership, board committees and firm performance: Evidence from Hong Kong. Corporate Governance: The International Journal of Business in Society, 12(3), 353–366. Leaptrott, J. (2005). An institutional theory view of the family business. Family Business Review, 18(3), 215–228. Lipton, M., & Lorsch, W. J. (1992). A modest proposal for improved corporate govern- ance. The Business Lawyer, 48(1), 59–77. Liu, W., Yang, H., & Zhang, G. (2012). Does family business excel in firm performance? An institution-based view. Asia Pacific Journal of Management, 29(4), 965–987. Maury, B. (2006). Family ownership and firm performance: Empirical evidence from Western European corporations. Journal of Corporate Finance, 12, 321–341. Mobbs, S. (2015). Is an outside chair always better? The role of non-CEO inside chairs on corporate boards. The Financial Review, 50, 547–574. Morck, R., & Yeung, B. (2003). Agency problems in large family business groups. Entrepreneurship Theory and Practice, 27(4), 367–382. Muller, V.-C. (2014). The impact of board composition on the financial performance of FTSE100 constituents. Procedia - Social and Behavioral Sciences, 109, 969–975. Mura, R. (2007). Firm performance: Do non-executive directors have a mind of their own? Evidence from UK panel data. Financial Management, 36(3), 81–112. Muth, M. M., & Donaldson, L. (1998). Stewardship theory and board structure: A con- tingency approach. Corporate Governance: An International Review, 6(1), 5–28. Nguyen, T., Locke, S., & Reddy, K. (2014). A dynamic estimation of governance structures and financial performance for Singaporean companies. Economic Modelling, 40, 1–11. Nicholson, G. J., & Kiel, G. C. (2007). Can directors impact performance? A case-based test of three theories of corporate governance. Corporate Governance: An International Review, 15(4), 585–608. Nielsen, S., & Huse, M. (2010). Women directors’ contribution to board decision-making and strategic involvement: The role of equality perception. European Management Review, 7(1), 16–29. Nilsson Okutan, G. (2007). Corporate governance in Turkey. European Business Organization Law Review, 8(2), 195–236. O’Connor, T., Kinsella, S., & O’Sullivan, V. (2014). Legal protection of investors, corporate governance, and investable premia in emerging markets. International Review of Economics and Finance, 29, 426–439. Peng, M. W., & Jiang, Y. (2010). Institutions behind family ownership and control in large firms. Journal of Management Studies, 47(2), 253–273. Perrini, F., Rossi, G., & Rovetta, B. (2008). Does ownership structure affect performance? Evidence from the Italian market. Corporate Governance: An International Review, 16(4), 312–325. Rajan, R. G., & Zingales, L. (1998). Which capitalism? Lessons form the East Asian crisis. Journal of Applied Corporate Finance, 11(3), 40–48. Renders, A., Gaeremynck, A., & Sercu, P. (2010). Corporate governance ratings and company performance: A Cross-European study. Corporate Governance: An International Review, 18(2), 87–106. Rose, C. (2007). Does female board representation influence firm performance? The Danish evidence. Corporate Governance: An International Review, 15(2), 404–413. Sacristán-Navarro, M., Gómez-Ansón, S., & Cabeza-García, L. (2011). Large shareholders’ combinations in family firms: Prevalence and performance effects. Journal of Family Business Strategy, 2, 101–112. Sarkar, J., & Sarkar, S. (2000). Large shareholder activism in corporate governance in developing countries: Evidence from India. International Review of Finance, 1(3), 161–194. Schnake, M., Williams, R. J., & Fredenberger, W. (2006). Women on boards of directors: Effects on firm social performance in the basic materials and financial services sec- tors. Journal of Applied Business Research, 22(1), 31–40. Setia-Atmaja, L. Y. (2009). Governance mechanisms and firm value: The impact of ownership concentration and dividends. Corporate Governance: An International Review, 17(6), 694–709. Sinani, E., Stafsudd, A., Thomsen, S., Edling, C., & Randøy, C. (2008). Corporate gov- ernance in Scandinavia: Comparing networks and formal institutions. European Management Review, 5(1), 27–40. Singh, D. A., & Gaur, A. S. (2009). Business group affiliation, firm governance, and firm performance: Evidence from China and India. Corporate Governance an International Review, 17(4), 411–425. Singh, S., Tabassum, N., Darwish, T. K., & Batsakis, G. (2018). Corporate governance and Tobin’s Q as a measure of organizational performance. British Journal of Management, 29, 171–190. Solomon, J., & Solomon, A. (2004). Corporate governance and accountability. The Atrium, Southern Gate. Chichester, West Sussex: John Wiley and Sons. Su, Y., Xu, D., & Phan, P. H. (2008). Principal-principal conflict in the governance of the Chinese public corporation. Management and Organization Review, 4(1), 17–38. Tabalujan, B. S. (2002). Family capitalism and corporate governance of family-controlled listed companies in Indonesia. UNSWLJ, 25, 486–514. Tariq, Y. B., & Abbas, Z. (2013). Compliance and multidimensional firm performance: Evaluating the efficacy of rule-based code of corporate governance. Economic Modelling, 35, 565–575. Thomsen, S., & Pedersen, T. (2000). Ownership structure and economic performance in the largest European companies. Strategic Management Journal, 21, 689–705. Topak, M. S. (2011). The effect of board size on firm performance: Evidence from Turkey. Middle Eastern Finance and Economics, 14, 119–127. Tuschke, A., & Sanders, G. (2003). Antecedents and consequences of corporate govern- ance reform: The case of Germany. Strategic Management Journal, 24, 631–649. Uddin, S. (2005). Privatization in Bangladesh: The emergence of ‘family capitalism’. Development and Change, 36(1), 157–182. Usdiken, B., & Yildirim-Oktem, O. (2008). Changes in the institutional environment and "nonexecutive" and "independent" directors on the boards of firms affiliated to large family business groups. Amme İdaresi Dergisi, 41(1), 43–71. Usdiken, B., Yildirim-Oktem, O., & Senol, F. N. (2015). İç halkaya dâhil olmak: Türkiye’ deki büyük aile holdinglerinde profesyonel yöneticiler. ODTÜ Gelişme Dergisi, 42, 521–551. Van Essen, M., Strike, V. M., Carney, M., & Sapp, S. (2015). The resilient family firm: Stakeholder outcomes and institutional effects. Corporate Governance: An International Review, 23, 167–183. Veprauskaite, E., & Adams, M. (2013). Do powerful chief executives influence the fi- nancial performance of UK firms? The British Accounting Review, 45, 229–241. Villalonga, B., & Amit, R. (2006). How do family ownership, control and management affect firm value? Journal of Financial Economics, 80(2), 385–417. Witt, M. A., & Redding, G. (2013). Asian business systems: Institutional comparison, clusters and implications for varieties of capitalism and business systems theory. Socio-Economic Review, 11(2), 265–300. Wood, G., & Frynas, G. (2006). The institutional basis of economic failure: Anatomy of the segmented business system. Socio-Economic Review, 4(2), 239–277. Wood, G., Dibben, P., & Ogden, S. (2014). Comparative capitalism without capitalism, and production without workers: The limits and possibilities of contemporary in- stitutional analysis. International Journal of Management Reviews, 16(4), 384–396. Zahra, S. A., & Pearce, J. A. (1989). Boards of directors and corporate financial perfor- mance: A review and integrative model. Journal of Management, 15(2), 291–334. Zakaria, Z., Purhanudin, N., & Palanimally, Y. R. (2014). Board governance and firm performance: A panel data analysis. Journal of Business Law and Ethics, 2(1), 1–12. Zattoni, A., Pedersen, T., & Kumar, V. (2009). The performance of group-affiliated firms during institutional transition: A longitudinal study of Indian firms. Corporate Governance: An International Review, 17(4), 510–523. I. Ciftci et al. International Business Review 28 (2019) 90–103 103