1. Assessment of Validity and Mean Differences Analysis of
Global Competence Aptitude Assessment (GCAA) Instrument
Rochana Kaushik - Graduate Research Assistant, Marketing and Business Analytics
Dr. Shonda Gibson - Executive Director of Institutional Effectiveness and Research
Dr. Dan Su - Director of Institutional Research
Dr. Tabetha Adkins - Associate Professor of Literature and Languages and QEP Committee Chair
Introduction and Background
The Texas A&M University-Commerce Quality
Enhancement Plan (QEP) was created to improve students’
levels of global competence, to address employers’ calls for
improvements to students’ knowledge of global dynamics
(issues, trends, processes, systems), and to improve
students’ ability to apply that knowledge of the
interconnectedness of global dynamics, and their ability to
view themselves as engaged citizens within an
interconnected and diverse world.
Global competence has been defined as:
Having an open mind while actively seeking to
understand cultural norms and expectations of
others, and leveraging this gained knowledge to
interact, communicate and work effectively in diverse
environments (Hunter, 2004, p. 81).
A commonly used measurement instrument of individuals’
levels of global competence is the Global Competence
Aptitude Assessment (GCAA) (Hunter,2006), which has
been employed by the university as part of the QEP. The
scale points ranges from 1-100 on each measurement.
The Global Competence Model™
GCAA provides a visual representation of the knowledge,
skills and attitudes that research shows are necessary for
developing Global Competence.
Current Study
Purpose of the study
Assess the validity of the GCAA instrument by conducting a
correlation analysis and Factor Analysis
Measure the internal consistency of the data (reliability) using
Cronbach’s Alpha
Investigate the significant mean differences in scores between the
four colleges and one school at Texas A&M University-Commerce
using Analysis of Variance (ANOVA)
Method and Participants
Correlation Analysis/Factor Analysis/Reliability: 1819 incoming,
first-time, full-time students at Texas A&M University-Commerce
(2014,2015)
ANOVA: 494 incoming, first-time, full time freshman students from
College of Business (COB) (N=78, 16%), College of Education and
Human Services (CED) (N=153, 31%), College of Humanities,
College of Social Sciences and Arts (COH) (N=66, 13%), College of
Science and Engineering (COS) (N= 120, 24%) and School of
Agriculture (SOA) (N=77,16%) in Fall 2015.
Results and Discussions
As prior research (Hunter, 2006) and studies have shown, our
study supports that the GCAA is a reliable and valid instruments of
measuring the constructs related to global competence.
Reliability Statistics
The Cronbach's alpha for 10 constructs in GCAA was α = 0.82
indicating the instrument was a highly reliable one.
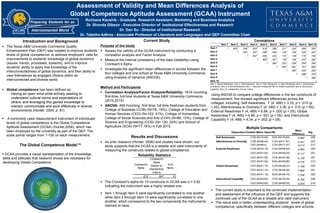
Item 1 through Item 5 were significantly correlated to one another
while Item 5 through Item 10 were significantly correlated to one
another, which correspond to the two components the instruments
claimed to have.
Correlations
Using ANOVA to compare college differences in the ten constructs of
measurement, five showed significant differences across the
colleges, including: Self Awareness, F (4, 489) = 3.33, p = .010 (p
<.05); Attentiveness to Diversity F (4, 489) = 3.36, p = .010 (p <.05);
External Readiness F (4, 489) = 6.84, p = .000 (p <.05); Global
Awareness F (4, 489) = 4.86, p = .001 (p <.05); and Intercultural
Capability F (4, 489) = 4.34, p = .002 (p <.05)
Multiple Comparisons
The current study is important to the continued implementation
and assessment of the influence of the QEP and supports the
continued use of the GCAA as a reliable and valid instrument.
The result aids in better understanding students’ levels of global
competence, specifically between different colleges and schools.
Item 1 Item 2 Item 3 Item 4 Item 5 Item 6 Item 7 Item 8 Item 9 Item 10
Item 1 1 .653
**
.748
**
.833
**
.818
**
.389
**
.211
**
.235
**
.289
**
.329
**
Item 2 1 .343**
.391**
.386**
.290**
.135**
.192**
.220**
.247**
Item 3 1 .547**
.459**
.232**
.137**
.136**
.175**
.186**
Item 4 1 .565**
.301**
.139**
.165**
.237**
.282**
Item 5 1 .360**
.223**
.226**
.250**
.284**
Item 6 1 .667**
.661**
.701**
.690**
Item 7 1 .283
**
.245
**
.228
**
Item 8 1 .288**
.276**
Item 9 1 .382**
Item 10 1
Item 1: Internal Readiness Item 2: Self Awareness Item 3: Risk Taking Item 4: Open Mindeness Item 5: Attentiveness
to Diversity Item 6: External Readiness Item 7: Historical Perspective Item 8: Global Awareness Item 9: Intercultural
Capability Item 10: Collaboration Across Culture
Cronbach's
Alpha
Cronbach's
Alpha
Based on
Standardize
d Items
N of
Items
.815 .847 10
Self Awareness COS (M=70.64) SOA (M=75.62) -4.982* .008
Attentiveness to Diversity COB (M=66.44) COH (M=71.67) -5.231* .037
CED (M=66.5) COH (M=71.67) -5.013* .017
External Readiness COB (M=53.15) COH (M=58.05) -4.892* .045
CED (M=51.93) COH (M=58.05) -6.117
* .001
CED (M=51.93) COS (M=57.06) -5.130
* .001
CED (M=51.93) SOA (M=56.66) -4.734
* .012
Global Awareness CED (M=41.10) COH (M=48.27) -7.168* .033
CED (M=41.10) COS (M=49.00) -7.895* .001
CED (M=41.10) SOA (M=48.14) -7.038
* .025
Intercultural Capability CED (M=63.65) COH (M=70.44) -6.792
* .028
CED (M=63.65) COS (M=69.53) -5.878* .019
Dependent Variable (Mean Value=M)
Mean
Difference
Sig.