stat.pptx
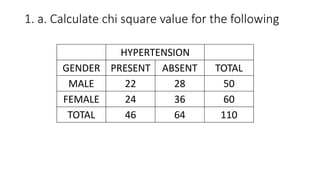
- 1. 1. a. Calculate chi square value for the following
HYPERTENSION
GENDER PRESENT ABSENT TOTAL
MALE 22 28 50
FEMALE 24 36 60
TOTAL 46 64 110
- 3. 1. c. Calculate arithmetic mean and standard
deviation
Protein intake/ day (in grams) No of families
15-25 30
25-35 40
35-45 30
45-55 10
total 110
- 4. Short notes (3 marks)
1. Descriptive statistics
2. Statistical package
3. ANOVA
4. Presentation of data
5. Draw histogram
Class interval frequency
10-15 23
>15-20 28
>20-25 29
>25-30 14
>30-35 10
>35-40 6