SlideShare a Scribd company logo
1 of 10
Types of Data
Key Concepts:
1. Understand the structure of a typical data set.
2. Distinguish between qualitative and quantitative variables.
3. Distinguish between levels of measurements
4. Distinguish between discrete and continuous variables.
Structure of a Data Set
The values of the variables that we obtain
are the data.
The characteristics of the individuals
about which we collect information are
called variables.
Information is collected on individuals.
The information collected is called a data set.
Example 4
Student Major Exam Score Grade
1 Art 92 A
2 Psychology 75 B
3 Communications 82 B
4 Psychology 72 C
5 Art 85 B
Parameter:
Statistic:
A is a number that describes a sample.
A is a number that describes a population.
Example 5:
Which of the following is a statistic and which is a parameter?
57% of the teachers at Central High School are female.
In a sample of 100 surgery patients who were given a new pain reliever,
78% of them reported significant pain relief.
Quantitative Data vs Categorical Data
Variables can be divided into two types:
Quantitative (or numerical) data: consists of numbers representing
counts or measurements.
 The weights of supermodels
 The ages of respondents
Categorical (or qualitative or attribute) data: consists of names or
labels (not numbers that represent counts or measurements).
 The gender (male/female) of professional athletes
 Shirt numbers on professional athletes uniforms - substitutes for
names
Example 6
Example: Quantitative Data vs Categorical Data
Which of the following variables are qualitative and which are
Categorical?
A person’s age
The color of a car
The mileage of a car
The identification number 1, 2, 3, …….,25 are assigned randomly to
the 25 subjects in a clinical trial.
Working with Quantitative Data:
Quantitative data can be further described by distinguishing between
discrete and continuous types.
Discrete data: result when the data values are quantitative and the
number of values is finite, or “countable.”
 The number of tosses of a coin before getting tails
 Age of a person at his or her last birthday
Continuous (numerical) data: result from infinitely many possible
quantitative values, where the collection of values is not countable. Or
can take on any value in some interval
 The lengths of distances from 0 cm to 12 cm
 Distance a person commutes to work
Levels of Measurement
Another way of classifying data is to use four levels of measurement:
nominal, ordinal, interval, and ratio.
Nominal level of measurement: characterized by data that consist of
names, labels, or categories only, and the data cannot be arranged in
some order (such as low to high).
 Survey responses of yes, no, and undecided
Ordinal level of measurement: involves data that can be arranged in
some order, but differences (obtained by subtraction) between data
values either cannot be determined or are meaningless.
 Course grades A, B, C, D, or F
Interval level of measurement: involves data that can be arranged in
order, and the differences between data values can be found and are
meaningful. However, there is no natural zero starting point at which
none of the quantity is present.
 Years 1000, 2000, 1776, and 1492
Ratio level of measurement: data can be arranged in order, differences
can be found and are meaningful, and there is a natural zero starting
point (where zero indicates that none of the quantity is present).
Differences and ratios are both meaningful.
 Class times of 50 minutes and 100 minutes
Summary - Levels of Measurement
• Nominal - categories only
• Ordinal - categories with some order
• Interval - differences but no natural zero point
• Ratio - differences and a natural zero point

More Related Content

What's hot (20)

Presentation1
Presentation1Presentation1
Presentation1
 
Level of measurement
Level of measurementLevel of measurement
Level of measurement
 
Level Of Measurement
Level Of MeasurementLevel Of Measurement
Level Of Measurement
 
Statistics in Physical Education
Statistics in Physical EducationStatistics in Physical Education
Statistics in Physical Education
 
Spss measurement scales
Spss measurement scalesSpss measurement scales
Spss measurement scales
 
Measurement scale
Measurement scaleMeasurement scale
Measurement scale
 
DATA Types
DATA TypesDATA Types
DATA Types
 
Measurement of scales
Measurement of scalesMeasurement of scales
Measurement of scales
 
Statistics
StatisticsStatistics
Statistics
 
Chapter 1 introduction to statistics
Chapter 1 introduction to statisticsChapter 1 introduction to statistics
Chapter 1 introduction to statistics
 
SPSS statistics - get help using SPSS
SPSS statistics - get help using SPSSSPSS statistics - get help using SPSS
SPSS statistics - get help using SPSS
 
121 vhgfhg
121 vhgfhg121 vhgfhg
121 vhgfhg
 
1.2 Data Classification
1.2 Data Classification1.2 Data Classification
1.2 Data Classification
 
Levels of measurement
Levels of measurementLevels of measurement
Levels of measurement
 
Statistics Vocabulary Chapter 1
Statistics Vocabulary Chapter 1Statistics Vocabulary Chapter 1
Statistics Vocabulary Chapter 1
 
Statistics for Physical Education
Statistics for Physical EducationStatistics for Physical Education
Statistics for Physical Education
 
MELJUN CORTES research seminar_1_data_analysis_basics
MELJUN CORTES research seminar_1_data_analysis_basicsMELJUN CORTES research seminar_1_data_analysis_basics
MELJUN CORTES research seminar_1_data_analysis_basics
 
MELJUN CORTES research seminar_1__data_analysis_basics_slides
MELJUN CORTES research seminar_1__data_analysis_basics_slidesMELJUN CORTES research seminar_1__data_analysis_basics_slides
MELJUN CORTES research seminar_1__data_analysis_basics_slides
 
Data processing
Data processingData processing
Data processing
 
quantitative data analysis using spss
quantitative  data analysis using spssquantitative  data analysis using spss
quantitative data analysis using spss
 

Similar to Types of data 1.2

Introduction To Statistics
Introduction To StatisticsIntroduction To Statistics
Introduction To Statisticsalbertlaporte
 
Need a nonplagiarised paper and a form completed by 1006015 before.docx
Need a nonplagiarised paper and a form completed by 1006015 before.docxNeed a nonplagiarised paper and a form completed by 1006015 before.docx
Need a nonplagiarised paper and a form completed by 1006015 before.docxlea6nklmattu
 
Statistics  What you Need to KnowIntroductionOften, when peop.docx
Statistics  What you Need to KnowIntroductionOften, when peop.docxStatistics  What you Need to KnowIntroductionOften, when peop.docx
Statistics  What you Need to KnowIntroductionOften, when peop.docxdessiechisomjj4
 
Sampling, measurement, and stats(2013)
Sampling, measurement, and stats(2013)Sampling, measurement, and stats(2013)
Sampling, measurement, and stats(2013)BarryCRNA
 
Statistics: Chapter One
Statistics: Chapter OneStatistics: Chapter One
Statistics: Chapter OneSaed Jama
 
Stat11t Chapter1
Stat11t Chapter1Stat11t Chapter1
Stat11t Chapter1gueste87a4f
 
1.-Lecture-Notes-in-Statistics-POWERPOINT.pptx
1.-Lecture-Notes-in-Statistics-POWERPOINT.pptx1.-Lecture-Notes-in-Statistics-POWERPOINT.pptx
1.-Lecture-Notes-in-Statistics-POWERPOINT.pptxAngelineAbella2
 
Basic statistics
Basic statisticsBasic statistics
Basic statisticsGanesh Raju
 
Introduction to Statistics and Arithmetic Mean
Introduction to Statistics and Arithmetic MeanIntroduction to Statistics and Arithmetic Mean
Introduction to Statistics and Arithmetic MeanMamatha Upadhya
 
Introduction to Biostatistics_20_4_17.ppt
Introduction to Biostatistics_20_4_17.pptIntroduction to Biostatistics_20_4_17.ppt
Introduction to Biostatistics_20_4_17.pptnyakundi340
 
Sampling of Blood
Sampling of BloodSampling of Blood
Sampling of Blooddrantopa
 
Statistics lesson 1
Statistics   lesson 1Statistics   lesson 1
Statistics lesson 1Katrina Mae
 
Principlles of statistics [amar mamusta amir]
Principlles of statistics [amar mamusta amir]Principlles of statistics [amar mamusta amir]
Principlles of statistics [amar mamusta amir]Rebin Daho
 
Ebd1 lecture 3 2010
Ebd1 lecture 3  2010Ebd1 lecture 3  2010
Ebd1 lecture 3 2010Reko Kemo
 
Ebd1 lecture 3 2010
Ebd1 lecture 3  2010Ebd1 lecture 3  2010
Ebd1 lecture 3 2010Reko Kemo
 

Similar to Types of data 1.2 (20)

Types of Data, Key Concept
Types of Data, Key ConceptTypes of Data, Key Concept
Types of Data, Key Concept
 
1.2 types of data
1.2 types of data1.2 types of data
1.2 types of data
 
Introduction To Statistics
Introduction To StatisticsIntroduction To Statistics
Introduction To Statistics
 
Need a nonplagiarised paper and a form completed by 1006015 before.docx
Need a nonplagiarised paper and a form completed by 1006015 before.docxNeed a nonplagiarised paper and a form completed by 1006015 before.docx
Need a nonplagiarised paper and a form completed by 1006015 before.docx
 
Measurementand scaling-10
Measurementand scaling-10Measurementand scaling-10
Measurementand scaling-10
 
Bio stat
Bio statBio stat
Bio stat
 
Statistics  What you Need to KnowIntroductionOften, when peop.docx
Statistics  What you Need to KnowIntroductionOften, when peop.docxStatistics  What you Need to KnowIntroductionOften, when peop.docx
Statistics  What you Need to KnowIntroductionOften, when peop.docx
 
Sampling, measurement, and stats(2013)
Sampling, measurement, and stats(2013)Sampling, measurement, and stats(2013)
Sampling, measurement, and stats(2013)
 
Statistics: Chapter One
Statistics: Chapter OneStatistics: Chapter One
Statistics: Chapter One
 
Stat11t chapter1
Stat11t chapter1Stat11t chapter1
Stat11t chapter1
 
Stat11t Chapter1
Stat11t Chapter1Stat11t Chapter1
Stat11t Chapter1
 
1.-Lecture-Notes-in-Statistics-POWERPOINT.pptx
1.-Lecture-Notes-in-Statistics-POWERPOINT.pptx1.-Lecture-Notes-in-Statistics-POWERPOINT.pptx
1.-Lecture-Notes-in-Statistics-POWERPOINT.pptx
 
Basic statistics
Basic statisticsBasic statistics
Basic statistics
 
Introduction to Statistics and Arithmetic Mean
Introduction to Statistics and Arithmetic MeanIntroduction to Statistics and Arithmetic Mean
Introduction to Statistics and Arithmetic Mean
 
Introduction to Biostatistics_20_4_17.ppt
Introduction to Biostatistics_20_4_17.pptIntroduction to Biostatistics_20_4_17.ppt
Introduction to Biostatistics_20_4_17.ppt
 
Sampling of Blood
Sampling of BloodSampling of Blood
Sampling of Blood
 
Statistics lesson 1
Statistics   lesson 1Statistics   lesson 1
Statistics lesson 1
 
Principlles of statistics [amar mamusta amir]
Principlles of statistics [amar mamusta amir]Principlles of statistics [amar mamusta amir]
Principlles of statistics [amar mamusta amir]
 
Ebd1 lecture 3 2010
Ebd1 lecture 3  2010Ebd1 lecture 3  2010
Ebd1 lecture 3 2010
 
Ebd1 lecture 3 2010
Ebd1 lecture 3  2010Ebd1 lecture 3  2010
Ebd1 lecture 3 2010
 

Recently uploaded

Privatization and Disinvestment - Meaning, Objectives, Advantages and Disadva...
Privatization and Disinvestment - Meaning, Objectives, Advantages and Disadva...Privatization and Disinvestment - Meaning, Objectives, Advantages and Disadva...
Privatization and Disinvestment - Meaning, Objectives, Advantages and Disadva...RKavithamani
 
microwave assisted reaction. General introduction
microwave assisted reaction. General introductionmicrowave assisted reaction. General introduction
microwave assisted reaction. General introductionMaksud Ahmed
 
Web & Social Media Analytics Previous Year Question Paper.pdf
Web & Social Media Analytics Previous Year Question Paper.pdfWeb & Social Media Analytics Previous Year Question Paper.pdf
Web & Social Media Analytics Previous Year Question Paper.pdfJayanti Pande
 
CARE OF CHILD IN INCUBATOR..........pptx
CARE OF CHILD IN INCUBATOR..........pptxCARE OF CHILD IN INCUBATOR..........pptx
CARE OF CHILD IN INCUBATOR..........pptxGaneshChakor2
 
Nutritional Needs Presentation - HLTH 104
Nutritional Needs Presentation - HLTH 104Nutritional Needs Presentation - HLTH 104
Nutritional Needs Presentation - HLTH 104misteraugie
 
“Oh GOSH! Reflecting on Hackteria's Collaborative Practices in a Global Do-It...
“Oh GOSH! Reflecting on Hackteria's Collaborative Practices in a Global Do-It...“Oh GOSH! Reflecting on Hackteria's Collaborative Practices in a Global Do-It...
“Oh GOSH! Reflecting on Hackteria's Collaborative Practices in a Global Do-It...Marc Dusseiller Dusjagr
 
Grant Readiness 101 TechSoup and Remy Consulting
Grant Readiness 101 TechSoup and Remy ConsultingGrant Readiness 101 TechSoup and Remy Consulting
Grant Readiness 101 TechSoup and Remy ConsultingTechSoup
 
Z Score,T Score, Percential Rank and Box Plot Graph
Z Score,T Score, Percential Rank and Box Plot GraphZ Score,T Score, Percential Rank and Box Plot Graph
Z Score,T Score, Percential Rank and Box Plot GraphThiyagu K
 
BASLIQ CURRENT LOOKBOOK LOOKBOOK(1) (1).pdf
BASLIQ CURRENT LOOKBOOK  LOOKBOOK(1) (1).pdfBASLIQ CURRENT LOOKBOOK  LOOKBOOK(1) (1).pdf
BASLIQ CURRENT LOOKBOOK LOOKBOOK(1) (1).pdfSoniaTolstoy
 
Call Girls in Dwarka Mor Delhi Contact Us 9654467111
Call Girls in Dwarka Mor Delhi Contact Us 9654467111Call Girls in Dwarka Mor Delhi Contact Us 9654467111
Call Girls in Dwarka Mor Delhi Contact Us 9654467111Sapana Sha
 
1029-Danh muc Sach Giao Khoa khoi 6.pdf
1029-Danh muc Sach Giao Khoa khoi  6.pdf1029-Danh muc Sach Giao Khoa khoi  6.pdf
1029-Danh muc Sach Giao Khoa khoi 6.pdfQucHHunhnh
 
The basics of sentences session 2pptx copy.pptx
The basics of sentences session 2pptx copy.pptxThe basics of sentences session 2pptx copy.pptx
The basics of sentences session 2pptx copy.pptxheathfieldcps1
 
Q4-W6-Restating Informational Text Grade 3
Q4-W6-Restating Informational Text Grade 3Q4-W6-Restating Informational Text Grade 3
Q4-W6-Restating Informational Text Grade 3JemimahLaneBuaron
 
Employee wellbeing at the workplace.pptx
Employee wellbeing at the workplace.pptxEmployee wellbeing at the workplace.pptx
Employee wellbeing at the workplace.pptxNirmalaLoungPoorunde1
 
Paris 2024 Olympic Geographies - an activity
Paris 2024 Olympic Geographies - an activityParis 2024 Olympic Geographies - an activity
Paris 2024 Olympic Geographies - an activityGeoBlogs
 
POINT- BIOCHEMISTRY SEM 2 ENZYMES UNIT 5.pptx
POINT- BIOCHEMISTRY SEM 2 ENZYMES UNIT 5.pptxPOINT- BIOCHEMISTRY SEM 2 ENZYMES UNIT 5.pptx
POINT- BIOCHEMISTRY SEM 2 ENZYMES UNIT 5.pptxSayali Powar
 
1029 - Danh muc Sach Giao Khoa 10 . pdf
1029 -  Danh muc Sach Giao Khoa 10 . pdf1029 -  Danh muc Sach Giao Khoa 10 . pdf
1029 - Danh muc Sach Giao Khoa 10 . pdfQucHHunhnh
 
The Most Excellent Way | 1 Corinthians 13
The Most Excellent Way | 1 Corinthians 13The Most Excellent Way | 1 Corinthians 13
The Most Excellent Way | 1 Corinthians 13Steve Thomason
 

Recently uploaded (20)

Privatization and Disinvestment - Meaning, Objectives, Advantages and Disadva...
Privatization and Disinvestment - Meaning, Objectives, Advantages and Disadva...Privatization and Disinvestment - Meaning, Objectives, Advantages and Disadva...
Privatization and Disinvestment - Meaning, Objectives, Advantages and Disadva...
 
microwave assisted reaction. General introduction
microwave assisted reaction. General introductionmicrowave assisted reaction. General introduction
microwave assisted reaction. General introduction
 
Web & Social Media Analytics Previous Year Question Paper.pdf
Web & Social Media Analytics Previous Year Question Paper.pdfWeb & Social Media Analytics Previous Year Question Paper.pdf
Web & Social Media Analytics Previous Year Question Paper.pdf
 
CARE OF CHILD IN INCUBATOR..........pptx
CARE OF CHILD IN INCUBATOR..........pptxCARE OF CHILD IN INCUBATOR..........pptx
CARE OF CHILD IN INCUBATOR..........pptx
 
Nutritional Needs Presentation - HLTH 104
Nutritional Needs Presentation - HLTH 104Nutritional Needs Presentation - HLTH 104
Nutritional Needs Presentation - HLTH 104
 
“Oh GOSH! Reflecting on Hackteria's Collaborative Practices in a Global Do-It...
“Oh GOSH! Reflecting on Hackteria's Collaborative Practices in a Global Do-It...“Oh GOSH! Reflecting on Hackteria's Collaborative Practices in a Global Do-It...
“Oh GOSH! Reflecting on Hackteria's Collaborative Practices in a Global Do-It...
 
Grant Readiness 101 TechSoup and Remy Consulting
Grant Readiness 101 TechSoup and Remy ConsultingGrant Readiness 101 TechSoup and Remy Consulting
Grant Readiness 101 TechSoup and Remy Consulting
 
Z Score,T Score, Percential Rank and Box Plot Graph
Z Score,T Score, Percential Rank and Box Plot GraphZ Score,T Score, Percential Rank and Box Plot Graph
Z Score,T Score, Percential Rank and Box Plot Graph
 
INDIA QUIZ 2024 RLAC DELHI UNIVERSITY.pptx
INDIA QUIZ 2024 RLAC DELHI UNIVERSITY.pptxINDIA QUIZ 2024 RLAC DELHI UNIVERSITY.pptx
INDIA QUIZ 2024 RLAC DELHI UNIVERSITY.pptx
 
BASLIQ CURRENT LOOKBOOK LOOKBOOK(1) (1).pdf
BASLIQ CURRENT LOOKBOOK  LOOKBOOK(1) (1).pdfBASLIQ CURRENT LOOKBOOK  LOOKBOOK(1) (1).pdf
BASLIQ CURRENT LOOKBOOK LOOKBOOK(1) (1).pdf
 
Call Girls in Dwarka Mor Delhi Contact Us 9654467111
Call Girls in Dwarka Mor Delhi Contact Us 9654467111Call Girls in Dwarka Mor Delhi Contact Us 9654467111
Call Girls in Dwarka Mor Delhi Contact Us 9654467111
 
1029-Danh muc Sach Giao Khoa khoi 6.pdf
1029-Danh muc Sach Giao Khoa khoi  6.pdf1029-Danh muc Sach Giao Khoa khoi  6.pdf
1029-Danh muc Sach Giao Khoa khoi 6.pdf
 
The basics of sentences session 2pptx copy.pptx
The basics of sentences session 2pptx copy.pptxThe basics of sentences session 2pptx copy.pptx
The basics of sentences session 2pptx copy.pptx
 
Q4-W6-Restating Informational Text Grade 3
Q4-W6-Restating Informational Text Grade 3Q4-W6-Restating Informational Text Grade 3
Q4-W6-Restating Informational Text Grade 3
 
Mattingly "AI & Prompt Design: Structured Data, Assistants, & RAG"
Mattingly "AI & Prompt Design: Structured Data, Assistants, & RAG"Mattingly "AI & Prompt Design: Structured Data, Assistants, & RAG"
Mattingly "AI & Prompt Design: Structured Data, Assistants, & RAG"
 
Employee wellbeing at the workplace.pptx
Employee wellbeing at the workplace.pptxEmployee wellbeing at the workplace.pptx
Employee wellbeing at the workplace.pptx
 
Paris 2024 Olympic Geographies - an activity
Paris 2024 Olympic Geographies - an activityParis 2024 Olympic Geographies - an activity
Paris 2024 Olympic Geographies - an activity
 
POINT- BIOCHEMISTRY SEM 2 ENZYMES UNIT 5.pptx
POINT- BIOCHEMISTRY SEM 2 ENZYMES UNIT 5.pptxPOINT- BIOCHEMISTRY SEM 2 ENZYMES UNIT 5.pptx
POINT- BIOCHEMISTRY SEM 2 ENZYMES UNIT 5.pptx
 
1029 - Danh muc Sach Giao Khoa 10 . pdf
1029 -  Danh muc Sach Giao Khoa 10 . pdf1029 -  Danh muc Sach Giao Khoa 10 . pdf
1029 - Danh muc Sach Giao Khoa 10 . pdf
 
The Most Excellent Way | 1 Corinthians 13
The Most Excellent Way | 1 Corinthians 13The Most Excellent Way | 1 Corinthians 13
The Most Excellent Way | 1 Corinthians 13
 

Types of data 1.2

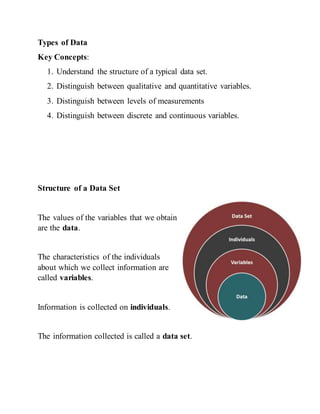
  • 1. Types of Data Key Concepts: 1. Understand the structure of a typical data set. 2. Distinguish between qualitative and quantitative variables. 3. Distinguish between levels of measurements 4. Distinguish between discrete and continuous variables. Structure of a Data Set The values of the variables that we obtain are the data. The characteristics of the individuals about which we collect information are called variables. Information is collected on individuals. The information collected is called a data set.
  • 2. Example 4 Student Major Exam Score Grade 1 Art 92 A 2 Psychology 75 B 3 Communications 82 B 4 Psychology 72 C 5 Art 85 B
  • 3. Parameter: Statistic: A is a number that describes a sample. A is a number that describes a population.
  • 4. Example 5: Which of the following is a statistic and which is a parameter? 57% of the teachers at Central High School are female. In a sample of 100 surgery patients who were given a new pain reliever, 78% of them reported significant pain relief.
  • 5. Quantitative Data vs Categorical Data Variables can be divided into two types: Quantitative (or numerical) data: consists of numbers representing counts or measurements.  The weights of supermodels  The ages of respondents Categorical (or qualitative or attribute) data: consists of names or labels (not numbers that represent counts or measurements).  The gender (male/female) of professional athletes  Shirt numbers on professional athletes uniforms - substitutes for names
  • 6. Example 6 Example: Quantitative Data vs Categorical Data Which of the following variables are qualitative and which are Categorical? A person’s age The color of a car The mileage of a car The identification number 1, 2, 3, …….,25 are assigned randomly to the 25 subjects in a clinical trial.
  • 7. Working with Quantitative Data: Quantitative data can be further described by distinguishing between discrete and continuous types. Discrete data: result when the data values are quantitative and the number of values is finite, or “countable.”  The number of tosses of a coin before getting tails  Age of a person at his or her last birthday Continuous (numerical) data: result from infinitely many possible quantitative values, where the collection of values is not countable. Or can take on any value in some interval  The lengths of distances from 0 cm to 12 cm  Distance a person commutes to work
  • 8. Levels of Measurement Another way of classifying data is to use four levels of measurement: nominal, ordinal, interval, and ratio. Nominal level of measurement: characterized by data that consist of names, labels, or categories only, and the data cannot be arranged in some order (such as low to high).  Survey responses of yes, no, and undecided Ordinal level of measurement: involves data that can be arranged in some order, but differences (obtained by subtraction) between data values either cannot be determined or are meaningless.  Course grades A, B, C, D, or F
  • 9. Interval level of measurement: involves data that can be arranged in order, and the differences between data values can be found and are meaningful. However, there is no natural zero starting point at which none of the quantity is present.  Years 1000, 2000, 1776, and 1492 Ratio level of measurement: data can be arranged in order, differences can be found and are meaningful, and there is a natural zero starting point (where zero indicates that none of the quantity is present). Differences and ratios are both meaningful.  Class times of 50 minutes and 100 minutes
  • 10. Summary - Levels of Measurement • Nominal - categories only • Ordinal - categories with some order • Interval - differences but no natural zero point • Ratio - differences and a natural zero point