The document presents a case study on reducing domestic water consumption in Saudi Arabia through implementing a strategy dynamics framework. It summarizes that domestic water usage in Saudi Arabia is increasing annually by 3.5% due to population growth and current consumption behaviors. A survey found that most Saudis are unaware of water costs and depletion issues. The objective is to reduce domestic usage by 30% by 2022 without impacting industry. The proposed strategy involves distributing and installing water reduction tools by 2014, introducing policies for low-consumption equipment, and raising water tariffs over time. Modeling shows this strategy could increase population 132% but only increase consumption 38%, saving around 90% of water and associated oil usage and emissions.
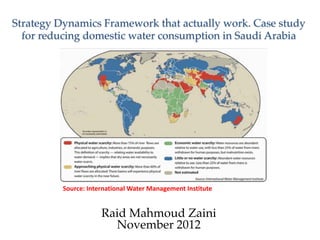
Strategy Dynamics Framework that actually work. Case study for reducing domestic water consumption in Saudi Arabia
1. Raid Mahmoud Zaini
November 2012
Strategy Dynamics Framework that actually work. Case study
for reducing domestic water consumption in Saudi Arabia
!
Source: International Water Management Institute
2. • The population of Saudi Arabia is briskly
growing (2.4% Saudi and 5.6% none Saudi).
The domestic water consumption is increasing
by an average 3.5% annually, which puts great
pressure over the rare water resources of the
country. Such consumption behavior wasn’t
sudden and it developed over time and was
influenced by the adapted water policies in
Saudi Arabia.
@MWA6EEN ----ﻣواطن ﻣﺟﺗﻣﻊﯾﺗﻌﻠم 2
Executive Summary
3. • According to a survey done by the Ministry of
Water and Electricity (MOWE), 99% of the
people didn’t know how much they pay or the
cost of producing one M3 that they consumed.
The same survey showed that 68% of the
people don’t know about the depletion of the
water resources and how alarming the situation
in the country is. It’s a clear indication of poor
water policies [subsidization of water price and
MOWE efforts in educating the society] and
the need for imperative change.
@MWA6EEN ----ﻣواطن ﻣﺟﺗﻣﻊﯾﺗﻌﻠم 3
Executive Summary
4. • The objective of the case study is to use the
strategy dynamics framework to establish a
strategy to reduce domestic water
consumption by 30% by 2022 in Saudi
Arabia. The study didn’t include the industrial
water consumption or the treated wastewater
usage.
@MWA6EEN ----ﻣواطن ﻣﺟﺗﻣﻊﯾﺗﻌﻠم 4
Executive Summary
5. • I have analyzed the data and forecasted the
consumption based on the current behavior till
year 2037 and the projected consumption is very
alarming and very costly which also raised the
concern about another highly important issue
which is the depletion of groundwater resources,
which needs urgent focus.
• My focus was not to reinvent the wheel and look
for new tools and methods but rather use the
proposed tools provided by MOWE as a starting
point but the implementation is different.
@MWA6EEN ----ﻣواطن ﻣﺟﺗﻣﻊﯾﺗﻌﻠم 5
Executive Summary
6. • The proposed strategy is simple but in order to see
the results it must be IMPLEMENTED. The
strategy consists of several steps, the first step is
to DISTRIBUTE and INSTALL the reduction
tools by 2014, inspect and fix housing leaks and
introduce a new policy for using and importing
low consumption equipment only in new houses
effective by 2017. The second step is to
implement the new policy of low consumption
equipment by 2017. The third step is to raise the
water tariff after a comprehensive analysis of the
dynamics of such change.
@MWA6EEN ----ﻣواطن ﻣﺟﺗﻣﻊﯾﺗﻌﻠم 6
Executive Summary
7. • The results of implementing the proposed strategy
based on the model showed that while the population
increased by 132% between 2014 and 2037, the water
consumption actually increased by only 38% instead of
132% a net saving around 90%. Barrel of Oil
Equivalent (BOE) consumption also reduced by 90%
and the CO2 emission also reduced by 90% not to
mention the reduction of the highly concentrated
discharge stream from the desalination plants back to
the sea which is not part of the current study. These
results didn’t include the amount of savings [water and
oil] we could have if water network leaks are fixed
which is estimated to be One million M3/Day according
to MOWE in December 2012.
@MWA6EEN ----ﻣواطن ﻣﺟﺗﻣﻊﯾﺗﻌﻠم 7
Executive Summary
8. • Applying the framework of strategy dynamics
showed a new possibility of turning the situation
around from dark to a bright future. A framework
that actually works and produces the results we
truly want to create if it is implemented. There
are several steps that could be done to further
reduce the consumption by adapting the routing of
the discharge of faucet water to the toilet flushing
box and wastewater treatment so its important to
remember this is not the end but rather the start.
Without the implementation of the strategy it
will be a waste of time and effort.
@MWA6EEN ----ﻣواطن ﻣﺟﺗﻣﻊﯾﺗﻌﻠم 8
Executive Summary
9. • The water scarcity issue in Saudi Arabia is already alarming and with the
current consumption behavior of Domestic and Agricultural sectors the
issue will get even worse. The Ministry of Water and Electricity (MOWE)
has been very active for the last several years trying to satisfy the demand
in a very rapid growing population and to conserve the water recourses in
Saudi Arabia.
• The charts below summarize the past, current and the future situation in a
very clear picture. It also asks the three most important questions that we
should answer if we are truly committed to solve our challenges.
• The numbers in this chart are just used for demonstration purposes!
@MWA6EEN ----ﻣواطن ﻣﺟﺗﻣﻊﯾﺗﻌﻠم 9
Background
!"!!!!
!5,000,000.00!!
!10,000,000.00!!
!15,000,000.00!!
!20,000,000.00!!
!25,000,000.00!!
!30,000,000.00!!
!35,000,000.00!!
!40,000,000.00!!
!45,000,000.00!!
!50,000,000.00!!
!"!!!!
!500,000,000.00!!
!1,000,000,000.00!!
!1,500,000,000.00!!
!2,000,000,000.00!!
!2,500,000,000.00!!
!3,000,000,000.00!!
!3,500,000,000.00!!
!4,000,000,000.00!!
!4,500,000,000.00!!
1990! 1995! 2000! 2005! 2010! 2015! 2020! 2025! 2030! 2035!
!Popula1on!
M3/Year!
Water!Consumed!per!Year!in!M3!
Water!Consumed! Where! How! Popula>on!
How?!
Where?!
Why?!
10. • Why has past performance followed the time path that it has?
• Where will the future performance go it we carry on as we are?
• How can we improve future performance?
• The numbers in this chart are just used for demonstration purposes!
@MWA6EEN ----ﻣواطن ﻣﺟﺗﻣﻊﯾﺗﻌﻠم 10
Background
!"!!!!
!5,000,000.00!!
!10,000,000.00!!
!15,000,000.00!!
!20,000,000.00!!
!25,000,000.00!!
!30,000,000.00!!
!35,000,000.00!!
!40,000,000.00!!
!45,000,000.00!!
!50,000,000.00!!
!"!!!!
!500,000,000.00!!
!1,000,000,000.00!!
!1,500,000,000.00!!
!2,000,000,000.00!!
!2,500,000,000.00!!
!3,000,000,000.00!!
!3,500,000,000.00!!
!4,000,000,000.00!!
!4,500,000,000.00!!
1990! 1995! 2000! 2005! 2010! 2015! 2020! 2025! 2030! 2035!
!Popula1on!
M3/Year!
Water!Consumed!per!Year!in!M3!
Water!Consumed! Where! How! Popula>on!
How?!
Where?!
Why?!
12. • Sadly enough I have to admit that I couldn’t find a single official number
while I have seen different numbers in different studies from 250 to 400
Liters/Person/Day (L/P/D).
• However, in this study I used the 250 L/P/D for a conservative analysis.
@MWA6EEN ----ﻣواطن ﻣﺟﺗﻣﻊﯾﺗﻌﻠم 12
Comparing Saudi Arabia to other countries
386
493
149
187
320
250
164
173
193
301
366 135
575
374
46
15
15
27
36
86
15
15
46
4
Daily Water Consumptoin per person for several contries
4.0 575.0
Avg. L/P/D
USA
575
UK
Spain
320
Peru
173
Norway
301
Mexico
366
Japan
374
Italy
386
India
Germany
193
France
287
Denmark
210
China
Brazil
187
Austria
250
Australia
493
Saudi Arabia
250
Sheet 3
4.0 575.0
Avg. L/P/D
13. Country
0.0 0.2 0.4 0.6 0.8 1.0 1.2 1.4 1.6 1.8 2.0
$/M3
Germany
Denmark
Saudi Arabia more than 300 m3
Belgium
Netherlands
France
United Kingdom of Great Britain an..
Saudi Arabia between 201 and 300 ..
Italy
Finland
Ireland
Sweden
Spain
Saudi Arabia between 101 to 200 m3
U.S.A
Australia
South Africa
Canada
Saudi Arabia between 51 to 100 m3
Saudi Arabia less than 50 m3
Cost of water in several countries as of 2001
0.030 1.910
$/M3
@MWA6EEN ----ﻣواطن ﻣﺟﺗﻣﻊﯾﺗﻌﻠم 13
14. • 20 years ago the total population of Saudi Arabia was around 16 million
people which represents 57% of the current population. In just 20 years the
country grew to 28,376,355.
@MWA6EEN ----ﻣواطن ﻣﺟﺗﻣﻊﯾﺗﻌﻠم 14
Why this become an issue?
15. • There are several estimates from different sources but most of them do not
seem to be correct. They could be mixing up the water price and electricity
generated from desalination plants or sometimes the amount of water being
generated. According to A Water Sector Assessment Report on the
Countries of the Cooperation Council of the Arab States of the Gulf March
31, 2005 2 the estimated cost was “US$3.2 billion in 2000 which represent
1.7 % GDP and 7.0% of oil export revenue”. This is based on a production
of 2,500 MCM with a production cost of $1.35/m3 and average revenue
US$0.08/m3.
@MWA6EEN ----ﻣواطن ﻣﺟﺗﻣﻊﯾﺗﻌﻠم 15
How much the desalination costs
16. • When it comes to reducing the domestic water consumption MOWE has been
actively [initiating] major initiatives:
• In 2012 MOWE launched a new campaign called “Save water, take a quick 4-
minute shower” aiming to reduce the amount of water being used during
showers.
• Phase 1 water conservation campaign targeting home owners and distributed 30
millions tap and flushing water box reduction tools with a 80% successful
installation rate. MOWE claimed that this has resulted in 30% reduction in
water consumption.
• Phase 2 water conservation campaign targeting government and public services
buildings and distributed 1.3 millions tap water reduction tools. MOWE
claimed that this has resulted in 25-50% reduction in water consumption.
• Phase 3 water conservation campaign targeting private sectors aiming to
distribute 900,000 tap water reduction tools. MOWE claim that this reduces
40% of the private sector consumption that represents 20% of the total demand.
• Phase 4 water conservation campaign aiming to distribute 5 millions shower
reduction tools for government, private and homes
@MWA6EEN ----ﻣواطن ﻣﺟﺗﻣﻊﯾﺗﻌﻠم 16
History of initiatives and policies
17. The Dynamics effect
@MWA6EEN ----ﻣواطن ﻣﺟﺗﻣﻊﯾﺗﻌﻠم 17
450,000,000
500,000,000
550,000,000
600,000,000
650,000,000
700,000,000
750,000,000
2002 2003 2004 2005 2006 2007 2008 2009 2010 2011 2012
The Dynamics Effect of New Houses and the Discard
of R-Tools on Water Consumption
Business As- Is consumption Consumption after installing R-Tools but never maintained
Reduction Tools = R-Tools
19. • The water tariff or pricing policy, which is an important factor in balancing
the supply-demand, has not been changed since 1998 according to the
World Bank regardless of the dynamic changes overtime. Keeping the
water tariff constant for 14 years has not been the best strategy. However,
that doesn’t mean the cost of producing water didn’t change overtime. In
fact the production cost has been increasing as per the available
information.
@MWA6EEN ----ﻣواطن ﻣﺟﺗﻣﻊﯾﺗﻌﻠم 19
The water tariff and pricing policy
20. • Why has past performance followed the time path that it has?
• Why the water consumption was increasing overtime. Well, the population is
growing and in the case of Saudi Arabia it’s growing even faster than the rest of the
world. Also, the water tariff plays a major role in maintaining the high consumption
rate.
• Where will the future performance go if we carry on as we are?
• The water consumption will continue to grow more and will consume more
resources to satisfy the demand.
• How can we improve future performance?
@MWA6EEN ----ﻣواطن ﻣﺟﺗﻣﻊﯾﺗﻌﻠم 20
The three strategy dynamics questions that are essential to answer.
!"!!!!
!5,000,000.00!!
!10,000,000.00!!
!15,000,000.00!!
!20,000,000.00!!
!25,000,000.00!!
!30,000,000.00!!
!35,000,000.00!!
!40,000,000.00!!
!45,000,000.00!!
!50,000,000.00!!
!"!!!!
!500,000,000.00!!
!1,000,000,000.00!!
!1,500,000,000.00!!
!2,000,000,000.00!!
!2,500,000,000.00!!
!3,000,000,000.00!!
!3,500,000,000.00!!
!4,000,000,000.00!!
!4,500,000,000.00!!
1990! 1995! 2000! 2005! 2010! 2015! 2020! 2025! 2030! 2035!
!Popula1on!
M3/Year!
Water!Consumed!per!Year!in!M3!
Water!Consumed! Where! How! Popula>on!
How?!
Where?!
Why?!
21. Performance depends on Resources
• Performance changes overtime
– The main reason for the changes overtime is contributed to population
growth [Resource]
• Resources drive performance
– “Performance at any time depends on resource levels, management
decisions, and external factors.” Kim Warren
• Key Resources
– “If that causal logic works to explain today’s performance and if the
organization engaged in the same activities as in the past in the same
manner, time charts for every item that causal chain can be linked to
provide a complete explanation of the organization’s performance
history” Kim Warren
@MWA6EEN ----ﻣواطن ﻣﺟﺗﻣﻊﯾﺗﻌﻠم 21
22. Key Resources
@MWA6EEN ----ﻣواطن ﻣﺟﺗﻣﻊﯾﺗﻌﻠم 22
Resources Description Unit Starting #
Groundwater Amount of groundwater MCM 428,000 2
Oil No specific number, but we will
demonstrate the depletion of oil
Tons Zero
Desalination plants Number of plants based on constant
capacity
Plant 25
High consumption toilets box The number of high consumption
toilets box installed
Unit 12,841,680
Low consumption toilets box The number of low consumption toilets
box installed
Unit 500,325
High consumption toilets box with R-
Tool
The number of high consumption
toilets box installed with reduction
tools
Unit 3335501
High consumption washing machines The number of high consumption
washing machines installed
Unit 4085989
Low consumption washing machines The number of high consumption
washing machines installed
Unit 83387
High consumption shower heads The number of high consumption
shower heads installed
Unit 16677507
Low consumption shower heads The number of low consumption
shower heads installed
Unit Zero
House with leaks The number of houses have leaks Houses 4169376.8
House with no leaks The number of houses with no leaks Houses Zero
Fixed Assets The total cost of desalination plants Dollars 124,931,506,849
Saudi Population Saudi population People 15,588,805
Immigrant population Immigrant population People 5,258,079
23. Resources Dynamics
@MWA6EEN ----ﻣواطن ﻣﺟﺗﻣﻊﯾﺗﻌﻠم 23
Performance we
want to improve
Domestic Water
Consumption
Desalination Water
Resources
Groundwater for Domestic
use
Supply Side
But, what drives Domestic Water
Consumption?
24. Resources Dynamics
@MWA6EEN ----ﻣواطن ﻣﺟﺗﻣﻊﯾﺗﻌﻠم 24
Performance we
want to improve
Domestic Water
Consumption
Desalination Water
Resources
Groundwater for Domestic
use
Supply Side
Population growth
drives domestic
water consumption
The performance we want to improve is the
Domestic water consumption, which is the
summation of Desalination water supply and
groundwater for domestic use.
However, such model can not be used to study or
improve the performance.
25. Resources Dynamics
@MWA6EEN ----ﻣواطن ﻣﺟﺗﻣﻊﯾﺗﻌﻠم 25
The domestic water consumption should be broken down to its fundamental
drivers (faucet, washing machine, toilet, shower and leakage).
Domestic Water
Consumption
Desalination
Water
Resources
Groundwater for
Domestic use
Supply SideLeakage
Faucet
Other
Washing Machine
Shower heads
Toilet
Flushing box
Population growth
drives domestic
water consumption
26. Breaking down the 250 L/P/D
@MWA6EEN ----ﻣواطن ﻣﺟﺗﻣﻊﯾﺗﻌﻠم 26
Performance we
want to improve
Domestic Water
Consumption
Desalination Water
Resources
Groundwater for
Domestic use
Supply SideLeakage
Faucet
Other
Washing Machine
Shower heads
Toilet Flushing box
35
Population
L/Person/D
42.
12
55
40
65
L/Person/D
L/Person/D
L/Person/D
L/Person/D
L/Person/D
27. How is consumption connected to Key Resources?
@MWA6EEN ----ﻣواطن ﻣﺟﺗﻣﻊﯾﺗﻌﻠم 27
Performance we
want to improve
Domestic Water
Consumption
Desalination
Water
Resources
Groundwater for
Domestic use
Supply SideLeakage
Faucet
Other
Washing
Machine
Shower heads
Toilet Flushing
box
35
Population
L/Person/D
42
.
12
55
40
65
L/Person/D
L/Person/D
L/Person/D
L/Person/D
L/Person/D
Water demand depleting
ground water
Water Demand
drive building new
plants
Desalination plants
CO2 Emission
Burning oil
generating CO2
Oil resources
Water demand drive
burning oil in
desalination plants
28. Supply and Demand
@MWA6EEN ----ﻣواطن ﻣﺟﺗﻣﻊﯾﺗﻌﻠم 28
• To summarize the demand side, the population growth is the main driver
for water consumption.
• The demand is driving the supply side. Water demand is satisfied from
two sides, desalination water and groundwater.
• The more water being consumed the more desalination plants to be built.
• Also, the more water being consumed the more oil to be burned in
desalination plants.
• The more oil being burned the more CO2 being emitted to the
atmosphere. The remaining water is being pumped from ground water
resources.
• The more groundwater being consumed the faster the groundwater will be
depleted.
29. Can this model used for policy intervention?
@MWA6EEN ----ﻣواطن ﻣﺟﺗﻣﻊﯾﺗﻌﻠم 29
Performance we
want to improve
Domestic Water
Consumption
Desalination
Water
Resources
Groundwater for
Domestic use
Supply SideLeakage
Faucet
Other
Washing
Machine
Shower heads
Toilet Flushing
box
35
Population
L/Person/D
42
.
12
55
40
65
L/Person/D
L/Person/D
L/Person/D
L/Person/D
L/Person/D
Water demand depleting
ground water
Water Demand
drive building new
plants
Desalination plants
CO2 Emission
Burning oil
generating CO2
Oil resources
Water demand drive
burning oil in
desalination plants
The short answer is NO. Such structure
could be useful for forecasting but not for
intervention (No policy space)
30. Can this model used for policy intervention?
@MWA6EEN ----ﻣواطن ﻣﺟﺗﻣﻊﯾﺗﻌﻠم 30
• Such model structure is not useful because we don’t have a way to change
the consumption. The best way is to find out the flows that are responsible
for driving the individual consumption so we can control them.
• To do that we need to find out how many “High consumption” toilet
flushing boxes already exist and how many will exist in the future per
house, how many “low consumption” toilet flushing boxes exist and how
many will be exist in the future per house and how many people in one
house.
• In other words, the best way to model the demand per person is by linking
it to household consumption, which includes the people and the
equipment being used to consume water.
31. Creating a policy Space. Water consumption due to toilet flushing
@MWA6EEN ----ﻣواطن ﻣﺟﺗﻣﻊﯾﺗﻌﻠم 31
Although the consumption figure is per person it depends on the volume of
the flushing box being installed in each house and the number of flushes per
person. The old flushing box uses 12 L/Flush while the ones with R-Tools
uses 9L/Flush and the new models use 3.5L/Flush.
The resources here are high consumption toilet boxes, which are initially
installed, and it changes overtime by several flows.
The first flow is through adding a new one every year, the second flow is
through life time (Discard) and after implementing the new “Policy” it
changes through installing the reduction tools as a new resource and later to a
full replacement “Policy” to low consumption toilet box a new resource.
32. Creating a policy Space. Water consumption due to toilet flushing
@MWA6EEN ----ﻣواطن ﻣﺟﺗﻣﻊﯾﺗﻌﻠم 32
33. The Impact on water consumption!
@MWA6EEN ----ﻣواطن ﻣﺟﺗﻣﻊﯾﺗﻌﻠم 33
ü The first reduction step occurred when the Flow [R-Tools Installed] started by year
2014
ü The second reduction step occurred when we introduced the new policy for installing
“low consumption” toilet flushing boxes for new houses by 2017 and then started
replacing both existing “high consumption” toilet boxes and toilet boxes with R-tools
to “low consumption” toilet boxes.
34. Creating a policy Space. Water consumption due to washing machine WM
@MWA6EEN ----ﻣواطن ﻣﺟﺗﻣﻊﯾﺗﻌﻠم 34
The high consumption WM changes overtime through the in-flow rate Old
WM/Year which is driven by adding (new houses) and the out flow rate
discarding (life span).
However, once the new Policy of installing low consumption equipment
starts, the number of High consumption WM will be reduced by the out-flow
WM replaced/Year governed by the percentage of WM we target to replace
per year.
At the same time all the new houses will install low consumption WM
[resource] through the in-flow New WM/Year.
In addition any discarded HC WM will be replaced with a low consumption
WM.
All the in-flows and out-flows are operating at the same time and the results
we see is the net outcome of this dynamic interaction.
35. Creating a policy Space. Water consumption due to washing machine WM
@MWA6EEN ----ﻣواطن ﻣﺟﺗﻣﻊﯾﺗﻌﻠم 35
36. The Impact on water consumption!
@MWA6EEN ----ﻣواطن ﻣﺟﺗﻣﻊﯾﺗﻌﻠم 36
The chart below represents Business As-Is consumption [red line] and the new
consumption [blue line] over time. The average reduction in consumption is
around 21% / Year.
37. Creating a policy Space. Water consumption due to shower heads
@MWA6EEN ----ﻣواطن ﻣﺟﺗﻣﻊﯾﺗﻌﻠم 37
38. The Impact on water consumption!
@MWA6EEN ----ﻣواطن ﻣﺟﺗﻣﻊﯾﺗﻌﻠم 38
The result of installing low consumption shower heads is impressive. The
consumption in 2037 with this strategy is less than the consumption of 2016
while the population has been increased by 117% between 2016 and 2037.
39. Water leaks from houses
@MWA6EEN ----ﻣواطن ﻣﺟﺗﻣﻊﯾﺗﻌﻠم 39
• The current estimate shows that every person has a share of 12.8M3/Year
water leak. In order to model it, I had to convert it to houses with leaks.
• However, some of the leaks could be form the underground piping network.
• The structure below shows how houses with leaks change over time.
• Initially houses start with no leaks but it starts developing leaks within 2
years.
• Once the leak is fixed it is transferred to a new [resource] houses with no
leaks. However, when the leaks are fixed it doesn’t mean it will never
comeback again and this is why it requires continuous work and it’s not a
one-time deal.
40. Crude Oil Consumption
@MWA6EEN ----ﻣواطن ﻣﺟﺗﻣﻊﯾﺗﻌﻠم 40
We didn’t assume initial number for the BOE instead we just kept consuming
crude oil which drove the crude oil inventory to the negative side. The crude oil
changes through its outflow (non-renewable resource), which is driven by the
water production from the desalination plants.
41. Groundwater Consumption
@MWA6EEN ----ﻣواطن ﻣﺟﺗﻣﻊﯾﺗﻌﻠم 41
• The groundwater resource is changing by different flows [in and out].
• The in- flow is the yearly renewable rate, which can increase the amount of
ground water.
• The two out-flows that can change the amount of ground water are ground
water being used for agriculture purposes and ground water being used for
domestic use assuming industrial usage is not supplied by groundwater.
• Groundwater for domestic use is calculated based on the GAP between
demand and desalination plants production capacity. So if the demand
increased above the desalination plants production, the groundwater usage
will increase until a new plant is constructed.
42. Desalination Plants
@MWA6EEN ----ﻣواطن ﻣﺟﺗﻣﻊﯾﺗﻌﻠم 42
• The desalination plants are driven by the domestic water consumption. When
the GAP between the demand (actual or predicted) and the actual capacity
increases, it triggers the need to add a new plant in order to satisfy the
demand (may not be the best way).
• The number of plants can also be reduced by an out flow of out of service
due to ageing but its not shown in this model for the simplicity purpose.
• I have included a decision point to set the leakage percentage of the water
network in order to model the real life condition.
• In this model I have assumed at a SET year the government must limit the
use of groundwater in domestic use.
43. The How
@MWA6EEN ----ﻣواطن ﻣﺟﺗﻣﻊﯾﺗﻌﻠم 43
Now it is the time to answer the How can we improve future performance?
The proposed strategy is not complicated or rocket science in itself in fact it is
very simple.
The strategy is divided in three stages as follow:
• 1- Stage 1 [SET:S1S-Year(2014)] consists of two parts,
• Part one is to introduce a new policy to be implemented by 2017 for all
new houses to install low consumption equipment and stop importing or
manufacturing high consumption equipment.
• Part two is to establish a new division in National Water Company NWC
to actually distribute and install the reduction tools by 2014. It might
sound like a costly solution but it is not if we compare how much the
government spends on subsidizing the water.
44. The How
@MWA6EEN ----ﻣواطن ﻣﺟﺗﻣﻊﯾﺗﻌﻠم 44
(500,000,000.00)
-
500,000,000.00
1,000,000,000.00
1,500,000,000.00
2,000,000,000.00
2,500,000,000.00
3,000,000,000.00
$
Years
Installation and Maintenance cost $ Saving-Loses
The calculation is based on the following
Installation, maintaining and fixing cost/ Year = Number of Houses/ Year X
Hours/House (to install, maintain & repair) X Hourly rate $/Hour
Hours/House = 1.5
Hourly Rate = $20
Number of houses = changes every year based on population growth
45. The How
@MWA6EEN ----ﻣواطن ﻣﺟﺗﻣﻊﯾﺗﻌﻠم 45
2- Stage 2 [SET:S2S-Year(2017)] Implement the new policy for all new houses
that will be constructed from 2017 onward to install low consumption toilet
flushing box, washing machines and shower heads.
Again there is a dynamic behavior that we should not ignore otherwise we will
only see a short term improvement.
What we need to remember is this new flushing box has a lifetime which means
they need to be replaced overtime. It is very important to ensure the
reinforcement of the policy otherwise the high consumption flushing box could
find its way back to the system and we could see a high consumption again.
46. The result of implementing the strategy
@MWA6EEN ----ﻣواطن ﻣﺟﺗﻣﻊﯾﺗﻌﻠم 46
From 2015 till 2030 the population will be increased by 71% [the blue line],
which could means the water consumption, will increase by 71% [the green line]
however, by implementing the new strategy the consumption will be increased
by 5%[the red line]. This means we could save 20 years of consumption while
we growing as a population!
47. The result of implementing the strategy
@MWA6EEN ----ﻣواطن ﻣﺟﺗﻣﻊﯾﺗﻌﻠم 47
This also means we could eliminate building a huge number of desalination
plants and its cost overtime due to the reduction in water consumption. The red
line represents the business as-is case while the blue line is representing the
result of proposed strategy.
48. The How
@MWA6EEN ----ﻣواطن ﻣﺟﺗﻣﻊﯾﺗﻌﻠم 48
3-Stage 3 raise the water cost from $0.08 /M3 to $0.6/M3 after four years from
stage 1.
The red lines in the below diagram represent business as-is case which is high
consumption and highly subsidized water cost, a result that under no
circumstances could be sustainable.
On the other hand, the blue lines represent the result of implemented strategy.
However, this step was done just for illustration purposes and not for
implementation.
To implement a price change we should look at the dynamics effect of the price
increase in all the activities that use water and have a direct impact to the
population especially if the citizens’ income remained constant.
For the comparison purpose, the yearly water bill for a house with 5 people
consuming 250L/P/D is $36.5/Year while with the proposed price change it will
be $163/Year.
The three different steps is presented in the below chart.
52. Conclusion
@MWA6EEN ----ﻣواطن ﻣﺟﺗﻣﻊﯾﺗﻌﻠم 52
The model showed that while the population increased by 132% between 2014
and 2037 the water consumption actually increased by only 38% instead of
132% a net saving around 90%.
The BOE consumption also reduced by 90% and the CO2 emission also reduced
by 90%.
The number of desalination plants reduced from 164(business as is) to 99.
However, an alarming indication for the over consumption of groundwater was
observed. With the current rate of renewable groundwater [in flow to
groundwater stock] and the amount of groundwater used for agriculture
purposes and domestic purposes [out flow of groundwater stock] the
groundwater stock will be completely depleted by year 2026.
53. Conclusion
@MWA6EEN ----ﻣواطن ﻣﺟﺗﻣﻊﯾﺗﻌﻠم 53
Another important point is most of Saudi Arabia desalination plants are a
cogeneration plants [water and electricity]. This means without a similar effort
to reduce electricity usage while we are reducing the water consumption it could
jeopardize the whole effort.
I’m sure the number we have used [consumption per person per day,
groundwater current level or the actual distribution of personal water
consumption] will raise some controversy among the people. However,
regardless of the values of these numbers the results will be the same if the
structure remains the same and the consumption behavior does not change. The
only difference is how fast or slow the change will happen.
54. Final Point
@MWA6EEN ----ﻣواطن ﻣﺟﺗﻣﻊﯾﺗﻌﻠم 54
• The other side of the strategy, which is very important, is to gain people
commitment and not compliance to continually try to reduce the water
consumption.
• To create committed society out of unaware and uncommitted society is
possible but it needs time.
• Such strategy could be done by applying the adoption model while using the
increase in water cost as a leverage point to implement such strategy.
55. Peter Senge describes the difference between compliance and commitment
@MWA6EEN ----ﻣواطن ﻣﺟﺗﻣﻊﯾﺗﻌﻠم 55
“Today, it is common to hear managers talk of getting people to "buy into" the vision.
For many, I fear, this suggests a sales process, where I sell and you buy. Yet, there is a
world of difference between "selling" and "enrolling." "Selling" generally, means getting
someone to do something that he might not do if they were in full possession of all the
facts. "Enrolling," by contrast, literally means "placing one's name on the roll."
Enrollment implies free choice, while "being sold" often does not.”
“Yet, there is a world of difference between compliance and commitment. The committed
person brings an energy, passion, and excitement that cannot be generated if you are
only compliant, even genuinely compliant. The committed person doesn't play by the
"rules of the game." He is responsible for the game. If the rules of the game stand in the
way of achieving the vision, he will find ways to change the rules. A group of people truly
committed to a common vision is an awesome force. They can accomplish the seemingly
impossible.”
“The hardest lesson for many managers to face is that, ultimately, there is nothing you
can do to get another person to enroll or commit. Enrollment and commitment require
freedom of choice. The guidelines above simply establish conditions most favorable to
enrollment, but they do not cause enrollment. Commitment likewise is very personal;
efforts to force it will, at best, foster compliance.”
57. @MWA6EEN ----ﻣواطن ﻣﺟﺗﻣﻊﯾﺗﻌﻠم 57
• Non renewable resources are
resources that can’t be
regenerated, reused, or replaced
with new one such as Oil.
Non renewable resource
Consumption
Renewable resource
Out flow
(Consumption)
In flow
(Regeneration)
• Renewable resources are resources
that can be regenerated, reused,
recycled or replaced with new one
such as groundwater.
• In order to maintain the stock of a
renewable resource, the outflow
must be equal to its inflow J