Tree in-bud sign golden s sign
•Download as PPTX, PDF•
18 likes•8,403 views

Tree-in-bud sign Golden S sign

Recommended
More Related Content
What's hot
What's hot (20)
Viewers also liked
Viewers also liked (12)
Similar to Tree in-bud sign golden s sign
Similar to Tree in-bud sign golden s sign (20)
More from Minstry of health ,Ibn alnafis hoapital, Damascus
More from Minstry of health ,Ibn alnafis hoapital, Damascus (9)
Recently uploaded
Recently uploaded (20)
Tree in-bud sign golden s sign
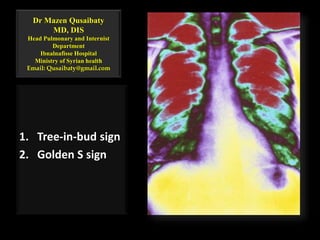
- 1. Dr Mazen Qusaibaty MD, DIS Head Pulmonary and Internist Department Ibnalnafisse Hospital Ministry of Syrian health Email: Qusaibaty@gmail.com 1. Tree-in-bud sign 2. Golden S sign
- 2. Topic Outline 1. Tree-in-bud sign 2. Golden S sign 2
- 6. Airways Central Cartilage >2mm of internal diameter Peripheral Non cartilage <2mm internal diameter 6
- 7. Airways Central Cartilage >2mm of internal diameter 0-16 Peripheral Non cartilage <2mm internal diameter 7 - 23 7
- 9. Dead Space The portion of each breath that does not participate in gas exchange
- 11. Dead Space DS Anatomic DS Conducting zone 150 ml
- 12. Dead Space DS Anatomic DS Conducting zone 150 ml Physiologic DS
- 13. Dead Space DS Anatomic DS Conducting zone 150 ml Physiologic DS Conducting zone
- 14. Dead Space DS Anatomic DS Conducting zone 150 ml Physiologic DS Conducting zone Alveoli that are well-ventilated but poorly perfused
- 15. Quiz • Asthma always attacks: A. Lung parenchyma B. Central airways C. Peripheral airways D. B + C 15
- 16. Quiz • Asthma always attacks: A. Lung parenchyma B. Central airways C. Peripheral airways D. B + C 16
- 17. Quiz • COPD always attacks: A. Central airways B. Peripheral airways C. Lung parenchyma D. B + C 17
- 18. Quiz • COPD always attacks: A. Central airways B. Peripheral airways C. Lung parenchyma D. B + C 18
- 21. Volume-rendered images demonstrate normal central and peripheral airways / Axial image 21
- 22. Volume-rendered images demonstrate normal central and peripheral airways / Coronal image
- 23. Volume-rendered images demonstrate normal central and peripheral airways / Sagittal image
- 24. Peripheral airways TB: Terminal Bronchiole RB1: Respiratory Bronchiole 1 RB2: Respiratory Bronchiole 2 RB3: Respiratory Bronchiole 3 AD: Alveolar Duct AS: Alveolar sac
- 26. Quiz / Tree-in-bud sign This sign could be seen in : A. HRCT scanner of thorax B. CT scanner of thorax C. PA chest x ray D. Left profile chest x ray
- 27. Tree-in-bud sign This sign could be seen in : A. HRCT scanner of thorax B. CT scanner of thorax C. PA chest x ray D. Left profile chest x ray
- 28. Tree-in-bud sign could be seen • In: A. Endobronchial Tuberculosis B. Asthma C. Bronchoalveolar carcinoma 28
- 29. Tree-in-bud sign could be seen • In: A. Endobronchial Tuberculosis B. Asthma C. Bronchoalveolar carcinoma 29
- 30. Case 1 • A 29-year-old man • Acute myeloid leukemia after bone marrow transplantation • The patient had a history of fever and cough 30
- 31. Case 1 HRCT in RLL 31
- 32. Case 1 • Multiple, small, centrolobular nodules of soft- tissue attenuation connected to linear branching opacities (arrows) • Tree-in-bud sign 32
- 33. Case 1 At serologic examination, an infection with A. Klebsiella pneumoniae B. Mycoplasma pneumoniae C. Streptococcus pneumoniae 33
- 34. Case 1 At serologic examination, an infection with A. Klebsiella pneumoniae B. Mycoplasma pneumoniae C. Streptococcus pneumoniae 34
- 35. Tree-in-bud sign associated with bronchiolar infection • Transverse thin- section CT scan through right lower lobe in a patient with airways disease and bacterial infection related to AIDS (acquired immunodeficiency syndrome) 35
- 36. Tree-in-bud sign associated with bronchiolar infection • Multiple impacted centrilobular bronchioles result in tree-in-bud appearance (arrowheads). • Bronchiectasis is also present 36
- 37. Lung slice from patient with bronchopneumonia • Impacted mucus- and pus-filled bronchioles (arrows) are visible throughout the lung 37
- 38. 38
- 39. Golden S sign
- 41. Golden S sign Refers to a reverse S shaped shadow
- 42. Golden S sign Caused by right upper lobe collapse
- 43. Golden S sign The upper curve of the reverse S (concave infero-laterally)
- 44. Golden S sign A central mass causing the collapse forming the lower curve (convex infero-medially)
- 45. • When a lobe collapses around a large central mass, the peripheral lung collapses and the central portion of lung is prevented from collapsing by the presence of the mass. 45
- 46. • The relevant fissure is concave toward the lung peripherally but convex centrally, and the shape of the fissure resembles an S or a reverse S . 46
- 47. Conclusion • Golden S sign - indicates lobar collapse with a central mass, suggesting an obstructing bronchogenic carcinoma in an adult 47
Editor's Notes
- A Pictorial Review of “Signs in Thoracic Imaging” Karuppasamy, K.1, Abhyankar-Gupta, M.1, Fewins, H.1, Curtis, J.2 1The Cardiothoracic Centre - Liverpool NHS Trust, 2Aintree University Hospitals NHS Foundation Trust, Liverpool, United Kingdom
- Dead Space The portion of each breath that does not participate in gas exchange. Anatomic dead space is the volume of the conducting airways; physiologic dead space also include sthe contribution of alveoli that are well-ventilated but poorly perfused. Dead Space Dead space is the portion of each tidal volume that does not take part in gas exchange. There are two different ways to define dead space-- anatomic and physiologic. Anatomic dead space is the total volume of the conducting airways from the nose or mouth down to the level of the terminal bronchioles, and is about 150 ml on the average in humans. The anatomic dead space fills with inspired air at the end of each inspiration, but this air is exhaled unchanged. Thus, assuming a normal tidal volume of 500 ml, about 30% of this air is "wasted" in the sense that it does not participate in gas exchange. Physiologic dead space includes all the non-respiratory parts of the bronchial tree included in anatomic dead space, but also factors in alveoli which are well-ventilated but poorly perfused and are therefore less efficient at exchanging gas with the blood. Because atmospheric PCO2 is practically zero, all the CO2 expiredin a breath can be assumed to come from the communicating alveoli and none from the dead space. By measuring the PCO2 in the communicating alveoli (which is the same as that in the arterial blood) and the PCO2 in the expired air, one can use the Bohr Equation to compute the "diluting," non-CO2 containing volume, the physiologic dead space. In healthy individuals, the anatomic and physiologic dead spaces are roughly equivalent, since all areas of the lung are well perfused. However, in disease states where portions of the lung are poorly perfused, the physiologic dead space may be considerably larger than the anatomic dead space. Hence, physiologic dead space is a more clinically useful concept than is anatomic dead space.
- Dead Space The portion of each breath that does not participate in gas exchange. Anatomic dead space is the volume of the conducting airways; physiologic dead space also include sthe contribution of alveoli that are well-ventilated but poorly perfused. Dead Space Dead space is the portion of each tidal volume that does not take part in gas exchange. There are two different ways to define dead space-- anatomic and physiologic. Anatomic dead space is the total volume of the conducting airways from the nose or mouth down to the level of the terminal bronchioles, and is about 150 ml on the average in humans. The anatomic dead space fills with inspired air at the end of each inspiration, but this air is exhaled unchanged. Thus, assuming a normal tidal volume of 500 ml, about 30% of this air is "wasted" in the sense that it does not participate in gas exchange. Physiologic dead space includes all the non-respiratory parts of the bronchial tree included in anatomic dead space, but also factors in alveoli which are well-ventilated but poorly perfused and are therefore less efficient at exchanging gas with the blood. Because atmospheric PCO2 is practically zero, all the CO2 expiredin a breath can be assumed to come from the communicating alveoli and none from the dead space. By measuring the PCO2 in the communicating alveoli (which is the same as that in the arterial blood) and the PCO2 in the expired air, one can use the Bohr Equation to compute the "diluting," non-CO2 containing volume, the physiologic dead space. In healthy individuals, the anatomic and physiologic dead spaces are roughly equivalent, since all areas of the lung are well perfused. However, in disease states where portions of the lung are poorly perfused, the physiologic dead space may be considerably larger than the anatomic dead space. Hence, physiologic dead space is a more clinically useful concept than is anatomic dead space.
- Dead Space The portion of each breath that does not participate in gas exchange. Anatomic dead space is the volume of the conducting airways; physiologic dead space also include sthe contribution of alveoli that are well-ventilated but poorly perfused. Dead Space Dead space is the portion of each tidal volume that does not take part in gas exchange. There are two different ways to define dead space-- anatomic and physiologic. Anatomic dead space is the total volume of the conducting airways from the nose or mouth down to the level of the terminal bronchioles, and is about 150 ml on the average in humans. The anatomic dead space fills with inspired air at the end of each inspiration, but this air is exhaled unchanged. Thus, assuming a normal tidal volume of 500 ml, about 30% of this air is "wasted" in the sense that it does not participate in gas exchange. Physiologic dead space includes all the non-respiratory parts of the bronchial tree included in anatomic dead space, but also factors in alveoli which are well-ventilated but poorly perfused and are therefore less efficient at exchanging gas with the blood. Because atmospheric PCO2 is practically zero, all the CO2 expiredin a breath can be assumed to come from the communicating alveoli and none from the dead space. By measuring the PCO2 in the communicating alveoli (which is the same as that in the arterial blood) and the PCO2 in the expired air, one can use the Bohr Equation to compute the "diluting," non-CO2 containing volume, the physiologic dead space. In healthy individuals, the anatomic and physiologic dead spaces are roughly equivalent, since all areas of the lung are well perfused. However, in disease states where portions of the lung are poorly perfused, the physiologic dead space may be considerably larger than the anatomic dead space. Hence, physiologic dead space is a more clinically useful concept than is anatomic dead space.
- Dead Space The portion of each breath that does not participate in gas exchange. Anatomic dead space is the volume of the conducting airways; physiologic dead space also include sthe contribution of alveoli that are well-ventilated but poorly perfused. Dead Space Dead space is the portion of each tidal volume that does not take part in gas exchange. There are two different ways to define dead space-- anatomic and physiologic. Anatomic dead space is the total volume of the conducting airways from the nose or mouth down to the level of the terminal bronchioles, and is about 150 ml on the average in humans. The anatomic dead space fills with inspired air at the end of each inspiration, but this air is exhaled unchanged. Thus, assuming a normal tidal volume of 500 ml, about 30% of this air is "wasted" in the sense that it does not participate in gas exchange. Physiologic dead space includes all the non-respiratory parts of the bronchial tree included in anatomic dead space, but also factors in alveoli which are well-ventilated but poorly perfused and are therefore less efficient at exchanging gas with the blood. Because atmospheric PCO2 is practically zero, all the CO2 expiredin a breath can be assumed to come from the communicating alveoli and none from the dead space. By measuring the PCO2 in the communicating alveoli (which is the same as that in the arterial blood) and the PCO2 in the expired air, one can use the Bohr Equation to compute the "diluting," non-CO2 containing volume, the physiologic dead space. In healthy individuals, the anatomic and physiologic dead spaces are roughly equivalent, since all areas of the lung are well perfused. However, in disease states where portions of the lung are poorly perfused, the physiologic dead space may be considerably larger than the anatomic dead space. Hence, physiologic dead space is a more clinically useful concept than is anatomic dead space.
- Dead Space The portion of each breath that does not participate in gas exchange. Anatomic dead space is the volume of the conducting airways; physiologic dead space also include sthe contribution of alveoli that are well-ventilated but poorly perfused. Dead Space Dead space is the portion of each tidal volume that does not take part in gas exchange. There are two different ways to define dead space-- anatomic and physiologic. Anatomic dead space is the total volume of the conducting airways from the nose or mouth down to the level of the terminal bronchioles, and is about 150 ml on the average in humans. The anatomic dead space fills with inspired air at the end of each inspiration, but this air is exhaled unchanged. Thus, assuming a normal tidal volume of 500 ml, about 30% of this air is "wasted" in the sense that it does not participate in gas exchange. Physiologic dead space includes all the non-respiratory parts of the bronchial tree included in anatomic dead space, but also factors in alveoli which are well-ventilated but poorly perfused and are therefore less efficient at exchanging gas with the blood. Because atmospheric PCO2 is practically zero, all the CO2 expiredin a breath can be assumed to come from the communicating alveoli and none from the dead space. By measuring the PCO2 in the communicating alveoli (which is the same as that in the arterial blood) and the PCO2 in the expired air, one can use the Bohr Equation to compute the "diluting," non-CO2 containing volume, the physiologic dead space. In healthy individuals, the anatomic and physiologic dead spaces are roughly equivalent, since all areas of the lung are well perfused. However, in disease states where portions of the lung are poorly perfused, the physiologic dead space may be considerably larger than the anatomic dead space. Hence, physiologic dead space is a more clinically useful concept than is anatomic dead space.
- San Jose Three-Dimensional Perspective Satellite Image, Photo, Costa Rica 2000
- Normal airways. Axial (a), coronal (b), and sagittal (c)volume-rendered images demonstrate normal central and peripheral airways. Note the sheet overlying the chest wall. CT scans allow doctors to see cross-sectional images (slices) of your body. This slice shows heart and lung tissue.
- Normal airways. Axial (a), coronal (b), and sagittal (c)volume-rendered images demonstrate normal central and peripheral airways. Note the sheet overlying the chest wall.
- Normal airways. Axial (a), coronal (b), and sagittal (c)volume-rendered images demonstrate normal central and peripheral airways. Note the sheet overlying the chest wall.
- Refers to the pattern of opacity seen in a HRCT; the terminal tufts of TIB represent inflammatory material filling respiratory bronchioles and alveolar ducts and the stalks of TIB represent filling within terminal bronchiole; e.g. Endobronchial TB
- Refers to the pattern of opacity seen in a HRCT; the terminal tufts of TIB represent inflammatory material filling respiratory bronchioles and alveolar ducts and the stalks of TIB represent filling within terminal bronchiole; e.g. Endobronchial TB Inflammatory material filling : TB/RB/AD
- Refers to the pattern of opacity seen in a HRCT; the terminal tufts of TIB represent inflammatory material filling respiratory bronchioles and alveolar ducts and the stalks of TIB represent filling within terminal bronchiole; e.g. Endobronchial TB
- Refers to the pattern of opacity seen in a HRCT; the terminal tufts of TIB represent inflammatory material filling respiratory bronchioles and alveolar ducts and the stalks of TIB represent filling within terminal bronchiole; e.g. Endobronchial TB
- Thin-section CT scan obtained in a 29-year-old man with acute myeloid leukemia after bone marrow transplantation. The patient had a history of fever and cough. Image shows multiple, small, centrilobular nodules of soft-tissue attenuation connected to linear branching opacities (arrows). Note the morphologic similarities to the photograph of the tree in bud (Fig 1). At serologic examination, an infection with Mycoplasma pneumoniae was confirmed.
- Thin-section CT scan obtained in a 29-year-old man with acute myeloid leukemia after bone marrow transplantation. The patient had a history of fever and cough. Image shows multiple, small, centrilobular nodules of soft-tissue attenuation connected to linear branching opacities (arrows). Note the morphologic similarities to the photograph of the tree in bud (Fig 1). At serologic examination, an infection with Mycoplasma pneumoniae was confirmed.
- Thin-section CT scan obtained in a 29-year-old man with acute myeloid leukemia after bone marrow transplantation. The patient had a history of fever and cough. Image shows multiple, small, centrilobular nodules of soft-tissue attenuation connected to linear branching opacities (arrows). Note the morphologic similarities to the photograph of the tree in bud (Fig 1). At serologic examination, an infection with Mycoplasma pneumoniae was confirmed.
- Thin-section CT scan obtained in a 29-year-old man with acute myeloid leukemia after bone marrow transplantation. The patient had a history of fever and cough. Image shows multiple, small, centrilobular nodules of soft-tissue attenuation connected to linear branching opacities (arrows). Note the morphologic similarities to the photograph of the tree in bud (Fig 1). At serologic examination, an infection with Mycoplasma pneumoniae was confirmed.
- Thin-section CT scan obtained in a 29-year-old man with acute myeloid leukemia after bone marrow transplantation. The patient had a history of fever and cough. Image shows multiple, small, centrilobular nodules of soft-tissue attenuation connected to linear branching opacities (arrows). Note the morphologic similarities to the photograph of the tree in bud (Fig 1). At serologic examination, an infection with Mycoplasma pneumoniae was confirmed.
- Tree-in-bud sign associated with bronchiolar infection. (a) Transverse thin-section CT scan through right lower lobe in a patient with airways disease and bacterial infection related to acquired immunodeficiency syndrome. Multiple impacted centrilobular bronchioles result in tree-in-bud appearance (arrowheads). Bronchiectasis is also present. (b) Lung slice from patient with bronchopneumonia. Impacted mucus- and pus-filled bronchioles (arrows) are visible throughout the lung; this is the pathologic examination equivalent of the tree-in-bud sign. (Image courtesy of Martha Warnock, MD, University of California, San Francisco.)
- Tree-in-bud sign associated with bronchiolar infection. Transverse thin-section CT scan through right lower lobe in a patient with airways disease and bacterial infection related to acquired immunodeficiency syndrome. Multiple impacted centrilobular bronchioles result in tree-in-bud appearance (arrowheads). Bronchiectasis is also present. Lung slice from patient with bronchopneumonia. Impacted mucus- and pus-filled bronchioles (arrows) are visible throughout the lung; this is the pathologic examination equivalent of the tree-in-bud sign. (Image courtesy of Martha Warnock, MD, University of California, San Francisco.)
- Tree-in-bud sign associated with bronchiolar infection. Transverse thin-section CT scan through right lower lobe in a patient with airways disease and bacterial infection related to acquired immunodeficiency syndrome. Multiple impacted centrilobular bronchioles result in tree-in-bud appearance (arrowheads). Bronchiectasis is also present. Lung slice from patient with bronchopneumonia. Impacted mucus- and pus-filled bronchioles (arrows) are visible throughout the lung; this is the pathologic examination equivalent of the tree-in-bud sign. (Image courtesy of Martha Warnock, MD, University of California, San Francisco.)
- Refers to a reverse S shaped shadow caused by right upper lobe collapse forming the upper curve of the reverse S (concave infero-laterally) and a central mass causing the collapse forming the lower curve (convex infero-medially)
- Refers to a reverse S shaped shadow caused by right upper lobe collapse forming the upper curve of the reverse S (concave infero-laterally) and a central mass causing the collapse forming the lower curve (convex infero-medially)
- Refers to a reverse S shaped shadow caused by right upper lobe collapse forming the upper curve of the reverse S (concave infero-laterally) and a central mass causing the collapse forming the lower curve (convex infero-medially)
- Refers to a reverse S shaped shadow caused by right upper lobe collapse forming the upper curve of the reverse S (concave infero-laterally) and a central mass causing the collapse forming the lower curve (convex infero-medially)
- When a lobe collapses around a large central mass, the peripheral lung collapses and the central portion of lung is prevented from collapsing by the presence of the mass. The relevant fissure is concave toward the lung peripherally but convex centrally, and the shape of the fissure resembles an S or a reverse S .
- When a lobe collapses around a large central mass, the peripheral lung collapses and the central portion of lung is prevented from collapsing by the presence of the mass. The relevant fissure is concave toward the lung peripherally but convex centrally, and the shape of the fissure resembles an S or a reverse S .