Arrow diagram shows required order of tasks arrows software power point templ...
Percentage proportion pie chart powerpoint diagrame templates 0712
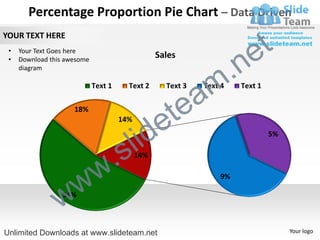
1. Percentage Proportion Pie Chart – Data Driven
YOUR TEXT HERE
e t
.n
• Your Text Goes here
• Download this awesome
Sales
diagram
Text 1 Text 2
a
Text 3
m
Text 4 Text 1
18%
e te
id
14%
l
5%
. s 14%
w w 9%
w54%
Unlimited Downloads at www.slideteam.net Your logo
2. Edit Color
2 3
e t
1
m .n
tea
id e
. s l
w w
1. Select the shape to change the color and Right click the object( click any object which you
w
want to change color)
2. Choose Format Data Series in the dialog box.
3. Choose “Fill” in the Format Shape box then “Solid” or “Gradient” depending on the
appearance of the object. Change colour as shown in the picture.
Unlimited Downloads at www.slideteam.net
3. Edit Chart
2 3
e t
.n
1
a m
e te
s l id
w .
w w
1. Select the shape to edit chart and Right click the object.
2. Choose Edit Data in the dialog box.
Unlimited Downloads at www.slideteam.net