Arrow diagram shows required order of tasks arrows software power point templ...
Glossy pie chart data driven ppt slides diagrams templates
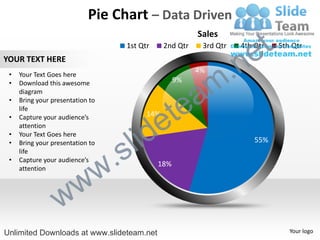
1. Pie Chart – Data Driven
t
Sales
e
1st Qtr 2nd Qtr 3rd Qtr 4th Qtr 5th Qtr
.n
YOUR TEXT HERE
4%
m
• Your Text Goes here
9%
a
• Download this awesome
diagram
te
• Bring your presentation to
e
life
• Capture your audience’s 14%
id
attention
l
• Your Text Goes here
s
• 55%
.
Bring your presentation to
life
w
• Capture your audience’s
18%
attention
w w
Unlimited Downloads at www.slideteam.net Your logo
2. Edit Color
2 3
e t
1
m .n
tea
id e
. s l
w w
1. Select the shape to change the color and Right click the object( click any object which you
w
want to change color)
2. Choose Format Data Series in the dialog box.
3. Choose “Fill” in the Format Shape box then “Solid” or “Gradient” depending on the
appearance of the object. Change colour as shown in the picture.
Unlimited Downloads at www.slideteam.net
3. Edit Chart
2 3
e t
.n
1
a m
e te
s l id
w .
w w
1. Select the shape to edit chart and Right click the object.
2. Choose Edit Data in the dialog box.
Unlimited Downloads at www.slideteam.net