This is a presentation of a work abount the American Index that I made at the end of June.
I hope it's useful for someone, even there are questions, criticism or advises don't hesitate to contact me, thank you.
Check it out and have a good read!
GIFT City Overview India's Gateway to Global Finance
4 things maybe you don't know about nasdaq-100 (posted 23th June 2017)
1. 4 things maybe you don’t know about
Nasdaq-100
By Pietro Di Leo
As is well known, the Nasdaq-100 (^NDX) is one of the most important stock Market index traded in the
American stock exchange NASDAQ. Its performance is evaluated and followed all over the world by
traders, brokers, banks, funds and many others.
Few people know of more detailed information in order to operate in this asset consciously and, why not,
with more profits.
So here are 4 things maybe you don’t know about Nasdaq-100:
1) It’s the index of the biggest technology stocks.
If you are Steve Job’s fans or you like playing videogames at XBOX, this asset is perfect for you: in fact it is
modified capitalization-weighted index based on 107 non-financial companies listed on Nasdaq, most of
which develops and sell consumer electronics, computer software: Apple, Microsoft, Intel…
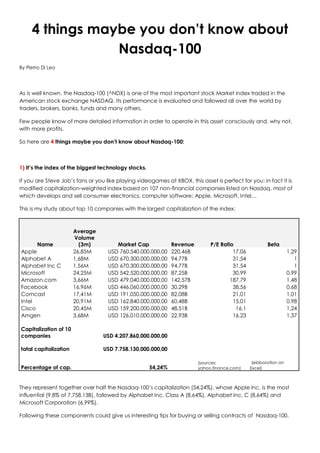
This is my study about top 10 companies with the largest capitalization of the index:
Name
Average
Volume
(3m) Market Cap Revenue P/E Ratio Beta
Apple 26,85M USD 760.540.000.000,00 220,46B 17,06 1,29
Alphabet A 1,68M USD 670.300.000.000,00 94,77B 31,54 1
Alphabet Inc C 1,56M USD 670.300.000.000,00 94,77B 31,54 1
Microsoft 24,25M USD 542.520.000.000,00 87,25B 30,99 0,99
Amazon.com 3,66M USD 479.040.000.000,00 142,57B 187,79 1,48
Facebook 16,96M USD 446.060.000.000,00 30,29B 38,56 0,68
Comcast 17,41M USD 191.050.000.000,00 82,08B 21,01 1,01
Intel 20,91M USD 162.840.000.000,00 60,48B 15,01 0,98
Cisco 20,45M USD 159.200.000.000,00 48,51B 16,1 1,24
Amgen 3,68M USD 126.010.000.000,00 22,93B 16,23 1,37
Capitalization of 10
companies USD 4.207.860.000.000,00
tatal capitalization USD 7.758.130.000.000,00
Percentage of cap. 54,24%
(sources:
yahoo.finance.com)
(elaboration on
Excel)
They represent together over half the Nasdaq-100’s capitalization (54,24%), whose Apple inc. is the most
influential (9,8% of 7.758.13B), followed by Alphabet Inc. Class A (8,64%), Alphabet Inc. C (8,64%) and
Microsoft Corporation (6,99%).
Following these components could give us interesting tips for buying or selling contracts of Nasdaq-100.
2. 2) Follow others assets, above all Russell 200 and Nasdaq Composite
Statistical models for data analysis help us build a strategy in any kind of market order (Intraday, multiday…)
and in hedging bets, we can use:
a) Endogenous models like the Exponential Smoothing you need to smooth time series otherwise to give
more weight to recent data than that older.
Yt* = ( 1- λ ) Yt + λ Yt-1 * where λ is the smoothing factor, and 0 < λ < 1
- λ 0 for smoothing
- λ 1 to make short-term predictions
B) Exogenous models (with more variables) like multiple linear regression: it’s based on discovering possible
connections between our target and external factors.
I have done this analysis with a monthly dataset (from January 2004 to May 2017) that contains 161
observations about 10 assets: Nasdaq-100(^NDX), S&P 500 (^GSPC), Dow Jones (^DJI), Nasdaq Composite (^IXIC), Russell 2000
(^RUT), EUR/USD (forex), Crude oil (CL), Gold Aug 17 (GC) FUTURES, Apple (AAPL) and Microsoft Corporation (MSFT).
The method follows 2 steps, scilicet correlation analysis with F-test and then regression with p-value.
First of all I did multivariable correlation on Excel, then I used the F test to verify hipotheses F= (r²/(1-r²)) * (n-
2) with Fx,1,n-2 where r= correlation coefficient and n= number of observations
I compared coefficient with F value and I realized that all values are significant ( COEFFICIENTS > f= 0.3317).
There are different relationships between elements and Nasdaq, so I need to understand which of external
variables is the best, and Regression gives the answer.
0.00
1000.00
2000.00
3000.00
4000.00
5000.00
6000.00
Nasdaq-100 Monthly (closing prices) From
january 2004 to may 2017
--- λ = 0,2
--- λ = 0,8
--- NSX
3. (Dataset is available on yahoo.finance.com, investing.com, processing on Excel)
Nasdaq
100
(NDX)
S&P
500
(^GSP
C)
Dow
Jones
(^DJI)
Nasdaq
Composit
e (^IXIC)
Russell
2000
(^RUT)
EUR/US
D
Crude
oil (CL)
Gold
Aug 17
(GC)
FUTURES
Apple
(AAPL)
Microsoft
Corporati
on (MSFT)
Nasdaq
100 (NDX) 1
S&P 500
(^GSPC)
0,9601
4 1
Dow
Jones
(^DJI)
0,9652
6 0,99328 1
Nasdaq
Composit
e (^IXIC)
0,9964
8 0,97794
0,9787
1 1
Red=High
correlatio
n
Yellow=
Medium
correlatio
n
Green=low
correlation
Russell
2000
(^RUT)
0,9613
3 0,98252
0,9855
2 0,97689 1
EUR/USD
-
0,5756
2
-
0,54582
-
0,5058
8 -0,5774
-
0,5018
5 1
Crude oil
(CL)
-
0,1285
8
-
0,12441 -0,0619 -0,13616
-
0,0253
3 0,71969 1
Gold Aug
17 (GC)
FUTURES
0,5027
4 0,33972
0,4164
4 0,45249
0,4396
9 0,0385
0,4833
8 1
Apple
(AAPL) 0,9554 0,86481
0,8884
3 0,93503
0,8908
1 -0,5095
-
0,0114
3 0,68092 1
Microsoft
Corporati
on (MSFT)
0,9408
6 0,93584
0,9269
8 0,94638
0,8944
6
-
0,61432
-
0,2807
2 0,27827 0,83189 1
In regression, after the control of indices of determination (both are 99,95%, so we have only 0.05% error
percentage) the significance level must be lower than p-value (0.05). Here we must exclude 3 variables,
and in comparison between standard error (distance of observation from estimation) and correlation
coefficient, the better choices are Nasdaq Composite and Russell 2000.
Coefficients
Standard
Error Stat t
Significance
level
Inferior
95%
Superior
95%
Inferior
95,0%
Superior
95,0%
Nasdaq-100 -114,7275 44,09043
-
2,602096 0,010188
-
201,8413 -27,61369
-
201,8413 -27,61369
S&P 500 (^GSPC) -0,139898 0,082167
-
1,702608 0,090699
-
0,302244 0,022447
-
0,302244 0,022447
Dow Jones (^DJI) 0,003357 0,008778 0,382366 0,702727
-
0,013988 0,020701
-
0,013988 0,020701
Nasdaq Composite
(^IXIC) 1,205397 0,028565 42,19798 1,79E-85 1,148958 1,261837 1,148958 1,261837
Russell 2000 (^RUT) -1,132576 0,086474
-
13,09733 1,15E-26
-
1,303431 -0,961722
-
1,303431 -0,961722
EUR/USD -104,6402 36,89552
-
2,836121 0,005193
-
177,5383 -31,74202
-
177,5383 -31,74202
Crude oil (CL) 0,565837 0,211634 2,673653 0,008329 0,14769 0,983984 0,14769 0,983984
Gold Aug 17 (GC)
FUTURES 0,144623 0,015262 9,476289 5,24E-17 0,114469 0,174776 0,114469 0,174776
Apple (AAPL) 0,769284 0,321365 2,393799 0,017902 0,134331 1,404237 0,134331 1,404237
Microsoft Corporation 0,818693 0,926204 0,883923 0,378143 -1,0113 2,648685 -1,0113 2,648685
4. 3) Wait!! Here’s the answers to the classical question “What should I invest?”
a) Graphical analysis: you can study the psychological behaviour between “Bulls” and “Bears” : in this case
I used daily candlesticks (in order to have 4 elements: open and closed prizes, maximum and minimum of
the day) , I marked the uptrend began from 04/11/2016 with a gap-up and the most interesting patterns, 2
Bear bozu (17 may and 09 june), and the Hanging Man before the last bozu, they are signals for a potential
trend reversal. We need to control that there’s no breakline of trend.
5. b) Seasonality and trend-cycle estimation: we need to know when it’s more advantageous buying or
selling, in other words when the price of the assets is lower (for long) or higher (for short).
I have found the coefficients of seasonality by calculating the average between errors and seasonal
average (SMA 12).
We can see in the graphic how the index loses value during summer months and goes up in the autumn.
The thing is visible also in the other graphic for the trend-cycle estimation.
0.00
50.00
100.00
150.00
200.00
250.00
300.00
350.00
400.00
450.00
Seasonality
0.00
1000.00
2000.00
3000.00
4000.00
5000.00
6000.00
trend-cycle estimation
(Ch - St)…
6. 4) Watch macroeconomic data.
Balance of Payments (B.O.P), interest rate, inflation rate and money supply are a few of the most important
indicators can can be divided into 4 categories:
a) Confidence indicators such as Zew o Ifo. In USA there is Consumer Confidence Index (CCI) is published
every month, specifically in the last Tuesday of every month at 4:00 p. m. (Italian time).
It shows the degree of confidence of Americans consumers about purchase power for the next semester in
comparison with the real purchase power.
b) Economic activities Indexes, specific to each sector:
- Monthly data for American manufacturing, the first published is Philadelphia Fed Index, that could
anticipate the Chicago’s Purchasing Managers’ Index (PMI) and the Institute for supply Management’s
(ISM). While Pmi is a market survey carried on opinions of 200 companies of the area, Ism is a progress report
of 300 companies of the whole state.
- Gross Domestic Product (GDP) , report with annual and quarterly values about investments, private
consumption, public spending and difference between export and import (Also important for the Balance
of Payments).
- Real estate market, to follow in particular monthly building permits and the real estate sells, perhabs the
most powerful influencer to consumption.
- Labour market , whose 3 things are very followed: weekly jobless claims, monthly non farm payrolls and the
monthly unemployment rate; these is made by Bureau of Labour Statistics.
c) Inflation indicators, that analyze both consumption and supply:
- The Consumer Price Index (CPI) studies the cost of living trend based on a basket of goods normally is
“cleaned” of goods with high volatility like food and energy because represents real price changes. It’s also
important for forex traders, but their expectations are in opposition to stock traders: they want an inflation
increasing ( so a stock markets decrease) in order to buy national currency because they estimate an
increasing cost of this;
- The Producer Price Index (PPI) measures the cost of a basket of production factors (raw products, finished
and semifinished) net of energy and food and you can see how prices change. Traders find this index very
useful for analyzing the commodities trend (Gold, Crude Oil, Corn…) , and since it is the first indicator of
inflation published every month, operators could anticipate price pressures.
d) Central Banks, if the currency changes stock prices might fluctuate, for this reason who invests controls
what are the monetary policy choices they realize through 2 different strategies:
- direct interventions, that is to say buying / selling own currency in order to revalue / devalue it;
- Report about American economy health state, that is named “The Beige Book” ; Federal Reserve publishes
it 8 times a year, 2 weeks before the known meeting Federal Open Market Committee (FOMC).
N.B. This is my point of view on this market and presentation of my work on Excel, I don’t
want influence anyone for investment choices, on the contrary I wanted to show you my
finance skills (I need to improve them certainly). If there are any ask, critique or
recommendation don’t hesitate to contact me.