Infographic
•Download as DOCX, PDF•
0 likes•6 views
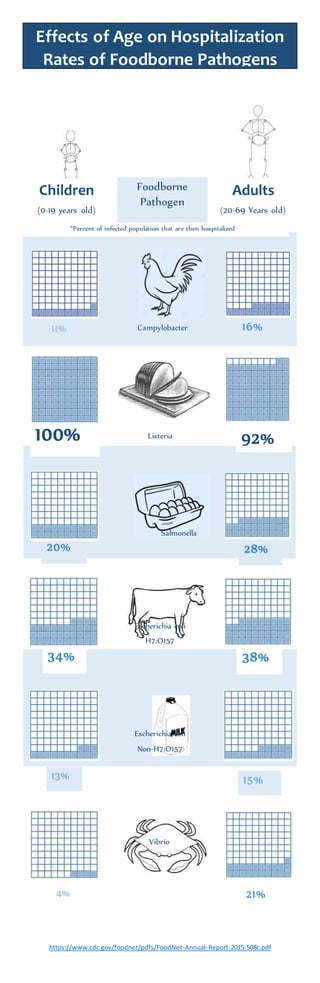
This is my sample of displaying information in an easy to read visual. this example displayed the effects of age on the hospitalization rates of food borne pathogens.
Report
Share
Report
Share
Recommended
Presentation from the 3rd Joint Meeting of the Antimicrobial Resistance and Healthcare-Associated Infections (ARHAI) Networks, organised by the European Centre of Disease Prevention and Control - Stockholm, 11-13 February 2015EARS-Net, ESAC-Net and HAI-Net: specific objectives to achieve a common goal,...
EARS-Net, ESAC-Net and HAI-Net: specific objectives to achieve a common goal,...European Centre for Disease Prevention and Control
Exquisite Culinary Journey: Chaîne des Rôtisseurs Cambodia Chapitre Dinner Menu 2024
Dive into the luxurious dining experience of the Chaîne des Rôtisseurs Bailliage Cambodia Chapitre Dinner, held on May 25th, 2024, at the prestigious Topaz Restaurant. This meticulously crafted menu showcases a symphony of flavors, blending local ingredients with global gourmet standards. From the delicate warmth of Gillardeau oysters to the rich, buttery textures of Tajima Wagyu, each course is paired perfectly with a selection of fine wines. Explore the full menu that promises a sensory journey through the finest culinary traditions and innovations. Perfect for gastronomy enthusiasts and members of the Chaîne des Rôtisseurs who appreciate the art of fine dining. Join us in celebrating a night of elegance, exceptional cuisine, and unforgettable memories.Chaine des Rotisseurs Gala Dinner Menu May 25 2024 Cambodia
Chaine des Rotisseurs Gala Dinner Menu May 25 2024 CambodiaChaîne des Rôtisseurs Bailliage National du Vietnam
NO1 Pakistan Amil Baba In Bahawalpur, Sargodha, Sialkot, Sheikhupura, Rahim Yar Khan, Jhang, Dera Ghazi Khan, Gujrat, Sahiwal, Okara, Hafizabad, Mandi Bahauddin, Jhelum, Jaranwala, Wazirabad, Taxila
NO1 Pakistan Amil Baba In Bahawalpur, Sargodha, Sialkot, Sheikhupura, Rahim Y...
NO1 Pakistan Amil Baba In Bahawalpur, Sargodha, Sialkot, Sheikhupura, Rahim Y...Amil Baba Dawood bangali
More Related Content
Recently uploaded
Exquisite Culinary Journey: Chaîne des Rôtisseurs Cambodia Chapitre Dinner Menu 2024
Dive into the luxurious dining experience of the Chaîne des Rôtisseurs Bailliage Cambodia Chapitre Dinner, held on May 25th, 2024, at the prestigious Topaz Restaurant. This meticulously crafted menu showcases a symphony of flavors, blending local ingredients with global gourmet standards. From the delicate warmth of Gillardeau oysters to the rich, buttery textures of Tajima Wagyu, each course is paired perfectly with a selection of fine wines. Explore the full menu that promises a sensory journey through the finest culinary traditions and innovations. Perfect for gastronomy enthusiasts and members of the Chaîne des Rôtisseurs who appreciate the art of fine dining. Join us in celebrating a night of elegance, exceptional cuisine, and unforgettable memories.Chaine des Rotisseurs Gala Dinner Menu May 25 2024 Cambodia
Chaine des Rotisseurs Gala Dinner Menu May 25 2024 CambodiaChaîne des Rôtisseurs Bailliage National du Vietnam
NO1 Pakistan Amil Baba In Bahawalpur, Sargodha, Sialkot, Sheikhupura, Rahim Yar Khan, Jhang, Dera Ghazi Khan, Gujrat, Sahiwal, Okara, Hafizabad, Mandi Bahauddin, Jhelum, Jaranwala, Wazirabad, Taxila
NO1 Pakistan Amil Baba In Bahawalpur, Sargodha, Sialkot, Sheikhupura, Rahim Y...
NO1 Pakistan Amil Baba In Bahawalpur, Sargodha, Sialkot, Sheikhupura, Rahim Y...Amil Baba Dawood bangali
Recently uploaded (10)
Chaine des Rotisseurs Gala Dinner Menu May 25 2024 Cambodia
Chaine des Rotisseurs Gala Dinner Menu May 25 2024 Cambodia
NO1 Pakistan Amil Baba In Bahawalpur, Sargodha, Sialkot, Sheikhupura, Rahim Y...
NO1 Pakistan Amil Baba In Bahawalpur, Sargodha, Sialkot, Sheikhupura, Rahim Y...
NO1 Top Black Magic Expert Specialist In UK Black Magic Expert Specialist In ...
NO1 Top Black Magic Expert Specialist In UK Black Magic Expert Specialist In ...
Medical Foods final.ppt (Regulatory Aspects of Food & Nutraceiticals)
Medical Foods final.ppt (Regulatory Aspects of Food & Nutraceiticals)
100^%)( FORDSBURG))(*((+27838792658))*))௹ )Abortion Pills for Sale in Benoni,...
100^%)( FORDSBURG))(*((+27838792658))*))௹ )Abortion Pills for Sale in Benoni,...
Featured
Featured (20)
Product Design Trends in 2024 | Teenage Engineerings
Product Design Trends in 2024 | Teenage Engineerings
How Race, Age and Gender Shape Attitudes Towards Mental Health
How Race, Age and Gender Shape Attitudes Towards Mental Health
AI Trends in Creative Operations 2024 by Artwork Flow.pdf
AI Trends in Creative Operations 2024 by Artwork Flow.pdf
Content Methodology: A Best Practices Report (Webinar)
Content Methodology: A Best Practices Report (Webinar)
How to Prepare For a Successful Job Search for 2024
How to Prepare For a Successful Job Search for 2024
Social Media Marketing Trends 2024 // The Global Indie Insights
Social Media Marketing Trends 2024 // The Global Indie Insights
Trends In Paid Search: Navigating The Digital Landscape In 2024
Trends In Paid Search: Navigating The Digital Landscape In 2024
5 Public speaking tips from TED - Visualized summary
5 Public speaking tips from TED - Visualized summary
Google's Just Not That Into You: Understanding Core Updates & Search Intent
Google's Just Not That Into You: Understanding Core Updates & Search Intent
The six step guide to practical project management
The six step guide to practical project management
Beginners Guide to TikTok for Search - Rachel Pearson - We are Tilt __ Bright...
Beginners Guide to TikTok for Search - Rachel Pearson - We are Tilt __ Bright...
Infographic
- 1. https://www.cdc.gov/foodnet/pdfs/FoodNet-Annual-Report-2015-508c.pdf 11% 16% 100% 92% 20% 28% 34% 38% 13% 15% 21%4% Campylobacter Listeria Salmonella Escherichia coli H7:O157 Escherichia coli Non-H7:O157 Vibrio Effects of Age on Hospitalization Rates of Foodborne Pathogens Children (0-19 years old) Adults (20-69 Years old) Foodborne Pathogen *Percent of infected population that are then hospitalized