Peter Gamundani ISS Final Dissertation November 2016
1. i
The state of communal farmers’ livelihoods and vulnerability in rural
Zimbabwe after the Fast Track Land Reform Program (FTLRP): A Case
study of the Hurungwe District
A Research Paper presented by:
PETER GAMUNDANI
in partial fulfilment of the requirements for obtaining the degree of
MASTER OF ARTS IN DEVELOPMENT STUDIES
Major:
Social Policy for Development
Members of the Examining Committee:
Prof Dr Erhard Berner
And
Dr Freek Schiphorst
November 2016
2. ii
Disclaimer:
This document represents part of Peter Gamundani’s study programme while at the Institute
of Social Studies. The views stated therein are those of the author and not necessarily of the
Institute.
Postal Address:
Institute of Social Studies
P.O. Box 29776 2502 LT
The Hague
The Netherlands
Location:
Kortenaerkade 12,
2518 AX
The Hague
The Netherlands
Telephone +31704260460 Fax +31704260799
3. iii
TABLE OF CONTENTS
Disclaimer: …………………………………………………………………………….ii
Acknowledgements:.............................................................................................................. vi
LIST OF TABLES...............................................................................................................vii
LIST OF FIGURES.............................................................................................................vii
LIST OF APPENDICES ....................................................................................................viii
LIST OF ACRONYMS ......................................................................................................viii
ABSTRACT………............................................................................................................... ix
CHAPTER 1………............................................................................................................... 1
1.1 Background....................................................................................................................... 1
1.2 Statement of Problem........................................................................................................ 2
1.3 Research Questions........................................................................................................... 4
1.4 Research Objectives.......................................................................................................... 4
1.5 Summary........................................................................................................................... 5
CHAPTER 2 THEORETICAL REVIEW AND CONCEPTUAL FRAMEWORK ....... 6
2.1 A Theory of Land Reform ................................................................................................ 6
2.1.1 . Timelines in Zimbabwe’s Land Reform: A Struggling Economy and Livelihoods at Stake
.......................................................................................................................................... 7
2.1.2 The Dying Zimbabwean Economy, Successive Economic Blueprints and Poverty....... 11
2.1.3 The Decade of Total Chaos 1998 to 2008: Effect on Livelihoods and Vulnerability
Patterns........................................................................................................................... 12
2.2 Livelihoods .................................................................................................................... 14
2.3 Vulnerability ................................................................................................................... 15
2.4.1 Caroline Moser's Asset Vulnerability Framework- The AVF ........................................ 16
2.5 Communal Farmer .......................................................................................................... 18
2.6 The Communal Areas: Livelihoods and Vulnerability ................................................... 18
2.7.1 Sustainable Livelihoods and Vulnerability Analysis ...................................................... 20
2.8 The Conceptual Framework: Sustainable Rural Livelihoods- Ian Scoones.................... 22
CHAPTER 3 METHODOLOGY................................................................................ 25
3.1 Background..................................................................................................................... 25
3.2 Case Study Area.............................................................................................................. 26
3.2.1 Focus Group Discussion ................................................................................................. 26
3.2.2 Survey ............................................................................................................................. 26
3.2.3 Key Informants Interviews.............................................................................................. 27
3.3 Instrumentation ............................................................................................................... 27
4. iv
3.4 Sampling ......................................................................................................................... 28
3.5 Data Analysis.................................................................................................................. 28
3.6 Ethical Considerations .................................................................................................... 28
3.7 Study Limitations............................................................................................................ 29
CHAPTER 4 RESULTS ANALYSIS................................................................................. 30
4.1 Introduction.................................................................................................................... 30
4.2 Household Demographic Profiles .................................................................................. 30
4.2.1 Gender of Household Head............................................................................................ 30
4.2.2 Age of Respondents ...................................................................................................... 30
4.2.3 Education / Academic Qualifications............................................................................ 30
4.2.4 Marital status.................................................................................................................. 31
4.3 Number of years living in village................................................................................... 32
4.4 Household Asset Endowment, Production and Resistance to External Shocks............. 32
4.5 TEST STATISTICS ANALYSIS OF THE CROSS-SECTIONAL SURVEY DATA .. 44
4.5.1 The Relationship between Number of people in a Household, Assets Endowment and
Production ...................................................................................................................... 44
4.5.2 Plot Sizes........................................................................................................................ 45
4.5.3 Income Levels................................................................................................................ 45
CHAPTER 5 SUMMARY OF THE INTERVIEWS AND FOCUS GROUP
DISCUSSIONS 49
5.1 Introduction..................................................................................................................... 49
5.1.1 VULNERABILITY PATTERNS BEFORE THE FTLRP ............................................. 49
5.1.2 LIVELIHOODS PATTERNS BEFORE THE FTLRP................................................... 50
5.1.3 The Commercial Farmers’ View on Vulnerability and Livelihoods in the Context of the
FTLRP............................................................................................................................ 51
5.2 Transformations in Livelihoods after the FTLRP........................................................... 52
5.2.1 Asset Structure: Better homes......................................................................................... 53
5.2.2 Access to Information and Education ............................................................................. 53
5.3 Asset Ownership Structure, External Shocks and Livelihoods after the FTLRP............ 53
5.3.1 Related Developments: Electrification of homes and the potential for other diversified
incomes........................................................................................................................... 53
5.4 Related Support Services: Access to Social Welfare Services ....................................... 53
5.4.1 Agricultural Extension Services Support........................................................................ 54
5.5 Better Environmental Preservation Through Decongestion of Rural Areas ................... 54
5.6 Livelihoods and Vulnerability in the era of Climate Change and its Shocking Effects.. 54
5.7 Improved livelihoods after the FTLRP among communal farmers ............................... 57
5. v
5.8 The Sustainable Livelihoods Framework Analysis: An Interrogation of Scoones Using
Hurungwe District Findings ........................................................................................... 59
CHAPTER 6 Conclusions, Discussion and Recommendations................................. 61
6.1 Conclusion ...................................................................................................................... 61
6.2 Discussion....................................................................................................................... 62
6.3 Recommendations........................................................................................................... 64
APPENDIX 1 70
SURVEY OF HURUNGWE FTLRP BENEFICIARIES................................................................... 70
APPENDIX TWO:............................................................................................................... 75
Structured Interview Guide for Key Informants................................................................................. 75
APPENDIX 3 76
Focus Group Discussion Guide .......................................................................................................... 76
APPENDIX 4 77
MAP OF ZIMBABWE SHOWING STUDY SITE: HURUNGWE DISTRICT IN MASHONALAND
WEST............................................................................................................................. 77
6. vi
Acknowledgements:
God has made this journey worthwhile and definitely gave me new insights into limitless
human capabilities we can only tap into.
To my supervisor Professor Dr. Erhard Berner., thank you for the incisive and timely
comments which made the journey all worthwhile. Your guidance was simply invaluable and
priceless.
I also want to acknowledge the contribution of my second reader Dr Freek Schiphorst, who
was ready with the right comments at just the right time.
I also want to express my gratitude to Dr Dumisani Kutywayo, Director, Crops Research
Division, Department of Research and Specialist Services in the Ministry of Agriculture,
Irrigation and Mechanization.
I was humbled by the people of Hurungwe where I did my data collection. I hope this work
will in some way find a way of improving your lives. You welcomed me like one of your own
and went out of your way to provide considered views.
My international colleagues at ISS who made the discussions appear like a mini UN session, I
will always hold your encouragement dear, and my profound gratitude to you all.
To my family: Thank you for giving me the space to go through this challenging programme.
It was worth the effort.
7. vii
LIST OF TABLES
Table 1: Household Demographic Characteristics…………………………….31
Table 2 Household Assets Distribution …………………….…………………32
Table 3: Crops Grown By Household ..……………………………………….33
Table 4: Livestock Per household…………………………………………. ….34
Table 5: Source of Crop Seeds…………………………………………………35
Table 6: Fertiliser Sources…..……………………………………………… …35
Table 7: Farming Chemicals Source..……………………………………… ….35
Table 8: Income Sources Per Househ……………………………………. ........36
Table 9: Number of Paid and Unpaid Workers by Househol…………… ........39
Table 10: Institutions Supporting Livelihoods Strategies ……………… …….43
Table 11: Gender Differences on Assets and Productivity …………… ………45
LIST OF FIGURES
Figure 1 Sustainable Livelihoods Framework ……………………………….24
Figure 2 Record Keeping …………………………………………………….36
Figure 3 Labour Sources at Household Level……………………….……… 37
Figure 4 Bank Account Possession and Loan Access ………………… …… 38
Figure 5 Active Membership in Associations…………………………… …. 39
Figure 6 Sources of Farming Information………………………………… 40
Figure 7 Corruption Perception ………………………………………………40
Figure 8: Agreement with FTLRP Statements…………………………… …41
Figure 9 Coping Strategies Adopted for Food in Relation to Shocks…… … 42
Figure 10 Remittances Received ………………………………..……… 42
8. viii
LIST OF APPENDICES
Appendix 1 Cross-Sectional Survey Questionnaire
Appendix 2 Key Informants Interview Guide
Appendix 3 Focus Group Discussion Guide
LIST OF ACRONYMS
AVF Asset Vulnerability Framework
CFU Commercial Farmers Union
DFID Department for International Development
FTLRP Fast Track Land Reform Program
GDP Gross Domestic Product
MERP Millennium Economic Recovery Programme
NERP National Economic Recovery Programme
SAPES Southern Africa Political and Economic Series
SLA Sustainable Livelihoods Approach
ISS Institute of Social Studies
UNDP United Nations Development Programme
ZCFU Zimbabwe Commercial Farmers Union
ZFU Zimbabwe Farmers Union
ZIMSTAT Zimbabwe Statistical Agency
9. ix
ABSTRACT
Land ownership is a recognised human right. Being in possession of land can be the
foundation for livelihood strategies. Land ownership also has a relationship with vulnerability
patterns especially among those communities that depend on farming for their survival. Using
a mixed methods approach, this study interrogated the Zimbabwe Fast Track Land Reform
Programme (FTLRP) and its impact on rural livelihoods and vulnerability patterns before and
after the year 2000. The sustainable livelihoods framework was employed as a theoretical
framework in unpacking the study. The study findings pointed to asset ownership structure as
important in determining vulnerability and livelihoods among communal farmers. Those
endowed with more assets significantly produced more from their land based activities. The
findings also showed that the challenges of the Zimbabwean economy invariably impacted on
vulnerability and livelihood patterns. Apparently, any land reform without the necessary
support (through finance, relevant assets and the necessary infrastructure) was generally not
effective in reducing poverty. Land reform consequently must be complemented by
programmes that enabled land beneficiaries to access financing and support in the form of
assets that assisted them to utilise their land more productively. It was also noted that due to
constrained livelihoods, some beneficiaries ended up resorting to relying on the natural
resources through cutting down of trees for resale and engaging in unregulated mining
activities. Climate change was a reality as most respondents had a perception that droughts
were becoming more frequent and this affected their livelihoods. Any land reform
programme hence must be comprehensive in order to have any significant impact on
communal farmers’ livelihoods patterns.
The Relevance to Development Studies
Agriculture is considered the backbone of Zimbabwe’s economy. It is at the very centre of
the fight against poverty and development initiatives as land based activities are crucial in
unpacking and strengthening the resilience of the rural communities. Using the Sustainable
Livelihoods and Vulnerability Framework, this paper attempts to illuminate how the
development question must be interwoven into the asset ownership structure of land
beneficiaries. The paper puts into perspective the common thinking that land reform is the
magic bullet to the development question. Consequently, my paper correlates the asset
ownership structure and productivity of communal farmers in rural Zimbabwe who are
beneficiaries of the 2000 land reform programme. The land reform question and development
policies and programmes are invariably interlinked. There is need for an integrated approach
to development in order to have a chance to make a lasting impression on livelihoods and
vulnerability patterns.
KEY WORDS: Fast Track Land Reform Program, livelihoods, assets, vulnerability, climate
change.
10. 1
CHAPTER 1
1.1 Background
Up to the year 2000, Zimbabwe’s economy was premised on agriculture, manufacturing and
tourism. Agriculture was the backbone of the country as most downstream industries where
put up as value chains for processing the products from the farms. There is a school of
thought arguing that agriculture has been in shambles due to the fast track land reform
programme that exploded largely in the period after 2000. Poverty is argued to have
dramatically increased particularly in the vulnerable rural communities. At the same time,
Zimbabwe has been in the eye of international controversies and emotional debates centering
on land reform and the country’s evident economic decline. On the other hand, the
government has blamed sanctions for the growing poverty and economic malaise. In 1999,
around 5000 farmers owned 29% of the land in Zimbabwe and by 2006 less than 400
remained owning less than 1% of the land (Derman 2006). This research is part of the wider
efforts to understand get insights on fast track land reform programme with emphasis on
livelihoods and the vulnerability patterns of the marginalized rural communal areas before
and after the year 2000.
Land ownership or access has generally been a recognized human right in poor rural
communities. It is actually an important corollary for rights to livelihood and the realisation
of other standard economic and social rights that reduces the vulnerability of the poorest
blacks in the rural areas. Land thus becomes an important central resource that must be
distributed and redistributed by the state. However orderly redistribution is only possible
when the state has initiated the land reform process and puts in place a clear land use policy
and framework which must be guided by the need to protect the environment and fight
poverty. Of note is also the realization that Africans identify themselves through their
11. 2
association with land (Matika 2014). This was one of the reasons that a protracted war of
liberation was wedged with the colonial government.
With the observation that there are many differing claims to land either as market determined
or in the form of customary rights, Bird and Prowse (2008) argue that land reform has taken
the form of an instrument through which to explore the many faces of poverty and
vulnerability in Zimbabwe. How will the FTLRP process be described and understood after
the dust has largely settled? Will the land reform programme be described as having
transformed Zimbabwe or will it be seen as the precursor to the destruction of a once
promising and vibrant economy? These questions still loom large in any discussion of the
land reform question in Zimbabwe. Poverty alleviation is also at the very heart of livelihoods
in current discourses. The FTLRP has to be interrogated on this dimension in an attempt to
understand the impact on the vulnerable communal farmers.
Most of the former commercial farms were allocated to village-based communal farmers
(Sachikonye 2003). The question that follows hence is how and whether these have also
graduated into viable farmers not solely concerned with subsistence farming. What is it that
researchers can learn from these land beneficiaries about how they view themselves when
compared to the survival strategies before the FTLRP?
1.2 Statement of Problem
Although the FTLRP improved access to land by the landless citizens, (Buka Report 2003,
Utete Report 2003), the impact on livelihood and vulnerability has not been impressive. The
provision of social services (such as education, health, agriculture support services)
deteriorated in general and actually collapsed in some areas where land was reclaimed
12. 3
(Sachikonye 2003; Moyo 2004). Farm workers were the hardest hit as they were displaced
and forced to join informal settlements where the social and living conditions were poor
(Moyo 2004)1
. According to Moyo (2004: 25), “…Indeed, former farm workers are amongst
the poorest, the most vulnerable to the effects of HIV/AIDS, the least food secure and the
least educated and healthy. Investments into this are just too low to have critical impacts."
However, beyond the impact on the farm workers, no systematic analysis has been done to
understand impact of FTLRP on communal farmers particularly on the poverty alleviation
dimension. Communal farmers depend on natural rainfall agriculture and with the effects of
climate change seen through increased droughts, livelihoods are more at stake and
vulnerability has potentially heightened. The education and health sector challenges give
insight into the state of livelihoods and vulnerability of a community. Although schooling
rates had generally been lower in farming areas when compared with communal and urban
areas (for example as at 1997, before the FTLRP, enrolment rates for farm workers kids
averaged 59% compared to 79% in communal areas and 89% in urban areas), schooling rates
dropped during the FTLRP by between 15-55% (Sachikonye 2003; Moyo 2004). This is
attributable to the loss of income and more importantly lack of access to school facilities due
to long distances students have to travel. Health and community support services the former
land owners (commercial farmers) provided were disrupted by the FTLRP.
While this sheds some light on the overall picture of livelihoods soon after FTLRP, little has
been done to comprehensively understand the livelihood and vulnerability dynamics in light
of changes in assets, skills and capital in the context of the FTLRP. In addition, very little
analysis on livelihood impact has been done beyond farm communities and general
1
While this data was provided as at 2004, from 2002 up to now, government’s overall capacity to provide
social services has since deteriorated drastically due to economic sanctions imposed by key Western partners
as well as macro-economic mismanagement. In fact provision of basic social services in urban areas has
deteriorated such that most suburban areas in Harare (capital city) go for 3 months without water, refuse
collection and electricity.
13. 4
typologies as given above. Furthermore, since 2004, almost a decade has passed and most of
the livelihood impacts of FTLRP are likely to manifest now due to the delayed effect of any
policy on poverty.
A thorough, scientific and integrated approach to assessing and understanding changes to
communal farmers’ livelihoods and vulnerability arising from the FTLRP is an important
building block in exploring policy options that enhance the livelihoods and limits
vulnerability of communal farmers.
1.3 Research Questions
The Main Research Question
How has the FTLRP impacted on the livelihoods and vulnerability patterns of communal
farmers in rural Zimbabwe?
Specific Research Questions
How has the contracting economy impacted on the livelihoods dimension and
vulnerability in relation to the FTLRP in Zimbabwe?
How does asset ownership impact on livelihoods and vulnerability patterns among the
rural poor?
How have communal farmers reacted to external shocks such as droughts in the quest
to maintain their livelihoods?
What has been the impact of support mechanisms, if any, such as financing and input
provision (seeds, fertilizer, pesticides, marketing, and extension) on enhancing
livelihoods?
1.4 Research Objectives.
14. 5
Main Objective
To examine the nexus between the FTLRP (as a land reform strategy) and communal farmers'
livelihood and vulnerability patterns?
Specific Objectives
a) To provide an appraisal of the impact of the FTLRP on communal farmers’ assets,
livelihoods and vulnerability in order to update the policy and academic debate on the
issues.
b) To better inform the targeting of agriculture and livelihood support schemes in an
increasingly cash strained and contracting economy.
c) To raise an awareness on the community resilience elements constituting the base for
community building and strengthening by government and donors.
1.5 Summary
This study is organized in the following manner: The first chapter is introductory and
provides a synopsis of some issues on land reform, rural livelihoods and vulnerability. An
expose of landlessness in the Hurungwe district in Mashonaland West serves as the case
study area and provides a window consistent with the realities in other rural areas. The
second chapter is on the theoretical review and the theoretical structure of livelihoods and
vulnerability, with special attention on the framework proffered by Scoones. There is also an
exploration of Zimbabwe pre and post the fast track. Chapter 3 comprises the methodology
and summarizes the mixed method design employed. Chapter 4 is comprised of the
quantitative results analysis whilst Chapter 5 contains the qualitative findings. Chapter 6 has
the conclusions and the recommendations. The research inclusion criterion was limited to
issues on livelihoods and vulnerability in relation to Zimbabwe’s FTLRP in communal areas.
Land reform admittedly, has been widely researched in Zimbabwe.
15. 6
CHAPTER 2 THEORETICAL REVIEW AND CONCEPTUAL FRAMEWORK
2.1 A Theory of Land Reform
Land reform largely refers to measures aimed at redistributing land in favor of peasants and
small farmers (Doner 1977). Land reform in that sense is targeted at enabling equal
opportunity. It is important as a developmental tool and has the potential to contribute to the
improvement of agricultural outputs and supporting decent paid or self employment.
However, land reform must be undertaken together with a variety of supporting institutional
arrangements. The support can include better credit provision, expansion of markets for
agricultural produce and the targeted extension and advisory services. Land reform becomes
a transformation of the subsisting land ownership patterns. For Doner (1977), even though
there are many definitions of land reform, there are commonalities in the definitions. Land
reform aims at diffusing wealth, income or productive capacity across the entire society. The
process itself becomes an openly driven transformation of the existing land tenure system.
Land reform radically changes and restructures the ground rules in an effort to ensure that
land ownership is in synchrony with the macroeconomic development trajectory.
In certain cases, there could be internal obstacles such as restrictive laws, hence land reform
policy requires the active involvement of those within the disenfranchised ranks. The
legislative environment may also pose problems such as in the case of Zimbabwe where the
government could not touch the land owned by commercial farmers due to clauses that had
been written in the Lancaster House Constitution. There could also be a lack of specific
criteria for land taking, lack of financing to purchase expropriated land, or very complicated
and excessive legal procedures. All the foregoing, coupled with inadequate financing and
lack of skilled staff in the administrators are some of the hinderances to land reform.
16. 7
Some internal obstacles can also be at play as land reform must have the active participation
of the disenfranchised. Poor rural organization also plays havoc with the efficient
administration of any land reform. Unclear laws can also be the source of problems. There
must also be clear criteria for land taking and financial incentives to be used in purchasing
expropriated land.
Land reform programmes differ from one country to another. The UNDP (2001) specifies
that reform programmes in any country must resonate with the challenges posed by the
agrarian structure as well as the socioeconomic and political environment where these
problems are targeted at being resolved. Land ownership systems hence are a window into
the specific historic and geographical conditions, which make any particular country unique.
The intention of agrarian reform is to raise the living standards of the poor. Land
redistribution of land is coupled with new registrations of land. Land reform also targets
income redistribution through employment creation. Griffin (1976) argues that there is also
the intent to enhance productivity of agricultural produce through using modern methods and
agricultural chemicals such as insecticides and fertilizers. With land reform also arises the
need to enhance supportive infrastructure developments such as through building of roads
and irrigation schemes.
2.1.1 .Timelines in Zimbabwe’s Land Reform: A Struggling Economy and Livelihoods
at Stake
Zimbabwe has a population of over 14.1 million people (World Development Indicators
2013; ZimStats 2012). The Zimbabwe Labour Force Survey (2011:13) outlines that
agriculture has been the main employer accounting for 91% of the population in the rural
communal areas and around 80% of those in urban areas having a linked with it.
17. 8
According to Moyo (2004), the British settlers colonized Zimbabwe and gave white pioneers
large tracts of land and in the same vein condemned the indigenous (black) to the marginal
and infertile communal areas. This is argued to have resulted in significant inequality in land
access with 2% of the population owning over 80 percent of the best agriculture land in
Zimbabwe (Moyo 2004). A liberation struggle was then waged by the blacks with one of its
objectives being the reclamation of the land and the restoration of the right to self-
determination for the majority black Zimbabweans.
Successive land reform programs since independence in 1980 up to the FTLRP from year
2000 were mainly concerned with on reassigning property rights from commercial farmers to
the government (Sachikonye 2003). Through successive legislative changes (to be discussed
later), the government has been legally empowered to own and redistribute land. It then
issued 99 year leases to the landless majority, which however still have challenges as
financers argue the leases not to be good enough to be used in lieu of title deeds. The
beneficiaries obtained leases for free and as they did not pay anything for them.
The FTLRP was allowed to run its course as the argument then was that land access had been
the rallying call for Zimbabwe’s second war of liberation from the 1960s to 1979. Against
this background, land redistribution has remained a major avenue of empowering citizens,
addressing poverty, reducing the vulnerability of the poor communal farmers and improve
livelihoods along with other social wellness issues. The FTLRP has also been viewed as a
tool to correct the past injustices (where the indigenous populations were condemned to
unproductive communal land and 2% of the British settlers owned 80% of productive land)
(Moyo 2004).
18. 9
At independence in 1980, the Zimbabwean government took over a land tenure system
characterized by a skewed distribution. According to The Zimbabwe Institute Report of 2007,
the country’s land tenure system was characterised by2
;
“Large scale commercial farms whose owners could buy and sell land freely.,
In 1994, only 450 of the country’s 4400 large scale commercial farmers where black.
Freehold Tenure of Small Scale Commercial farms owned by blacks who had
undergone “Master Farmer” training. One got title deeds after meeting the
government stipulated conditions.
Communal areas which were also called native reserves or tribal trust lands (TTLs)
where the majority poor blacks who had been displaced by settlers were forced into.
75 percent of the land was in drought prone areas.
State land is owned by the government and is both in urban and rural areas. Most of
this land is used for resettlement as well as for social and economic projects.”
Therefore in Zimbabwe’s land policy is potentially a mechanism for socio-economic
progression. It becomes a means to address inequality and promoting national economic
development and food security. It has a direct relationship with the political and national
sovereignty issue (Boudreaux 2010). In addition, the intrinsic and extrinsic value of land
ownership by Zimbabweans has been noted earlier on.
This study examines the livelihood and vulnerability of communal farmers in the aftermath of
the FTLRP and attempts to compare with what obtained before the programme. Given the
history of land dispossession and the successive periods of economic challenges the country
2
This was adopted from a paper submitted by the researcher in the course Critical Social Policy for
Transformative Development in 2015 titled: EMPOWERMENT OF THE POOR THROUGH LAND
REFORM IN ZIMBABWE—CASE STUDY OF SOCIAL PROVISIONING. REPORT ON THE FAST TRACK LAND
REFORM POLICY IN ZIMBABWE AS A SOCIAL PROVISIONING SYSTEM: A CASE STUDY.
19. 10
has faced, it becomes necessary to track the economic programmes and their intractable links
with the land question.
The land reform as a system was meant to provide land to landless communal farmers as well
as improve their livelihoods. The success of the social provisioning system depends on
whether the rural peoples’ livelihoods were enhanced or got worse in respect to their “access
to basic economic and other social services such including schools, roads, water, housing,
markets, among other things.3
”
Social policy correlates with a government’s approach to the development of social services
in the setting up of a welfare state (Alcock 2003).The crafting of legislation particularly in
relation to land access has been a strategy to consider the needs of the poor. Social policy
became an important instrument for impacting on the social and economic conditions of a
country and the promotion of the conditions for the development of a welfare state that
priorities fighting poverty and reducing vulnerability of the poor communal farmers. In the
context of livelihoods, also exist related issues such as poverty, gender and the pertinent
collective responsibility question for the community (Coffey 2004).
Mkwandwire (2001) argues that social policy and welfare provisioning need to be viewed
within the political context. Therefore, the FTLRP in Zimbabwe needs to be understood in
the context of its origins in the liberation struggle and the colonial history. In 1980, the
government had taken over an untenable system that had 6,000 white commercial farmers
holding 15.5 million hectares of the best arable land. At the same time, around 760,000
communal farmers occupied just 16.4 million hectares in generally very poor areas (The
Zimbabwe Institute 2007). From 1980 up to 1992, farms were using the willing seller-willing
buyer arrangement up to the time of the Land Apportionment Act. As farmers could
3
Adopted from an assignment in the course Critical Social Policy for Transformative Development submitted
by the researcher in 2015.
20. 11
challenge the government when their farms were earmarked for forced acquisition, there
indeed were many court cases from 1992 to 1997. This held back the land reform and
resettlement initiative.
From 2000, there were sweeping changes largely driven by the FTLRP. Government then
followed with supporting laws. This period was also the precipitated the economic downturn.
Social service provision hence suffered from the onset of the FTLRP.
This study sought to provide a synopsis of the livelihoods and vulnerability issues of the
communal farmers in the context of the FTLRP in Zimbabwe. The researcher chose a typical
study site that had the characteristics of other areas in the country. The related concepts and
theories will also be outlined.
2.1.2 The Dying Zimbabwean Economy, Successive Economic Blueprints and Poverty
It is generally not in dispute that the economy of Zimbabwe has been underperforming
according to the IMF, the World Bank, as well as independent economic commentators.
Zimbabwe’s economy grew by nearly 10% per annum in the period 1980 to 1981. Zikhali
(2008) outlined that such expansion however did last. An average Gross Domestic Product
growth of only 4.3% per annum realized from 1980 to 1991.
A succession of economic reform programmes then followed. The Economic Structural
Adjustment Programme was unveiled in 1990 and the Framework for Economic Recovery
followed soon after in the period 1991 to1995. The Zimbabwe Programme for Economic and
Social Transformation (ZIMPREST) was followed in the period 1998-2000. In November
1997, there was an unbudgeted gratuity to liberation war veterans that saw the value of the
currency fall heavily (Davies, Raftopoloulos and Savage 2005). In 1998, the government
refused funds the World Bank and other partners. The economy deteriorated throughout to
the end of the 1990s.
21. 12
In February 2000, there was a referendum on a new constitution which the government lost.
This resulted in serious changes in the orientation of economic policy. The chaotic FTLRP
was accompanied by frequently changing but largely pro-inflationary policies such as the
Millennium Economic Recovery Programme (MERP) from 2001-2002, the National
Economic Recovery Programme in 2003 (NERP), the Macroeconomic Policy Framework
that from 2005-2006. Other programmes followed in 2007, 2008 with the finally Short-Term
Economic Recovery Programme running its course from February 2009 to November 2009.
These programmes were supposed to improve the economy but in reality, the situation
continued to get worse for the government (Robinson 2006). Unemployment spiralled to very
high levels and by the year 2000, the percentage of the population in formal employment had
gone down a then an all-time low of 10.9% (ZLFS 2011).
The succession of economic policies is in recognition of how the wider macro economy has
implications on livelihood and vulnerability as survival strategies in rural Zimbabwe are
premised on agriculture activities. When the wider economy is not performing, the
downstream effect is increasing levels of poverty, particularly for the marginalized.
2.1.3 The Decade of Total Chaos 1998 to 2008: Effect on Livelihoods and
Vulnerability Patterns
The economic performance of Zimbabwe since 2000 has been disastrous. Output of major
crops such as maize and tobacco collapsed when compared with the base year, 1980 (Moyo
2004; Robinson 2006). This was coupled with major de-industrialization and the consequent
migration patterns this forced. The volume of manufacturing in five years fell to between
33% to only two thirds the levels that were in existence at independence. Output also
constricted in other related sectors, such that over 2001-2005, average annual GDP and
22. 13
employment growth collapsed to negative 5.5% and negative 7.5% per annum respectively
(Fashoyin 2008).
Similar to a country at war, Zimbabwe’s GDP declined every year from 1999. At the same
time, other African countries began growing at reasonable rates of growth with a cumulative
gain elsewhere in Africa of +40% of GDP. The cumulative GDP decline in Zimbabwe
between 1998 and 2006 was at -37% (Flamini, McDonald and Schumacher, 2009). In the
SADC region, Zimbabwe fell from being second only to South Africa, to having a GDP
which placed it at tenth (The Zimbabwe Institute 2007). This 2007 report further outlined that
in 2004, only Madagascar, Swaziland, Malawi and Lesotho had smaller GDPs and these had
smaller populations.
Over the years, the country has had a succession of economic recovery programmes. These
programmes have been targeted at resuscitating a dying economy. There was a period of
growth and stability in 2009 to 2013 when disputed election results resulted in the ruling
party securing the majority of the seats. Estimates on inflation have varied in the period from
year 2000 to when it was last recorded in August 2008. However the rate was in the millions.
Robinson (2006) argued that hyperinflation that characterized the Zimbabwean economy
pushed the cost of living beyond the reach of most households, particularly among the poor.
After 2013, the country continued to grapple with deflation, whose consequences are just as
bad as inflation. The country’s currency was replaced by a multicurrency regime and the
worst affected have been the rural communities where not much economic activities are
taking place.
23. 14
Many of Zimbabwe's communal farmers have been suffered due to the serious economic
decline. Both large and small farmers could not easily secure farming inputs, neither could
they access loans for farming and transport. When finance is available, it is expensive. The
quality of roads has continued to decline. Most communal farmers do not have the capacity to
save money to purchase inputs. There are also challenges such as limits for withdrawals, even
when they sell their products. There is also a whole army of workers who have one foot in
farming and the other in some other type of employment. They are simply not very efficient
farmers. Such individuals also used to supplement their farming activities with income from
the jobs they have since lost.
The performance of the macro-economy invariably has a relationship with life in the
communal areas. The high levels of unemployment and a weak economy pointed to
increasing levels of vulnerability and an attack on the livelihoods of the communal area
inhabitants.
2.2 Livelihoods
The most critical resource for communal farmers is a regular income, especially from
paid or self employment in land based activities. Others relied on remittances whilst very few
can count on a pension (Sachikonye 2003). Other resources can potentially act as substitutes.
With the exception of a pension, none of other sources of livelihoods available could be seen
as secure. Moyo (2010), outlines that farmers increasingly face severe environmental risks in
the communal areas. Land reform does not distinguish or differentiate livelihoods.
Communal farmers live with the reality of fluctuating crop and livestock prices and have no
control over the input prices.
24. 15
Other available livelihoods sources are normally risky or border on being illegal (Moyo 2004;
Sachikonye 2003). Commodity markets have their own organization and farmers are often at
the mercy of middle men or even vulnerable to theft. Access to social welfare resources in
Zimbabwe’s rural areas is also at times dependent on the successful negotiation of patronage
relations. Most of the local paid employment was in the agricultural sector and this amplifies
the effects on poor.
Moser (1998) expounds that contemporary arguments on livelihoods rests on the shared
assumption that people follow livelihood strategies by using and disposing their assets in
ways which are determined by their particular context.
2.3 Vulnerability
The most vulnerable households in rural communal setups are normally those with no access
to a guaranteed source of income (Heijmans 2001). They are impaired in following through
on a strategy that enables them to reduce the uncertainty through constructing many
livelihoods or consolidating. Other vulnerabilities appear to have their source in
contingencies such as illness, death, or a dysfunctional family structure. However, there are
often structural origins to the poverty and insecurity questions.
Vulnerability implies the existence of a risk related to social and economic liability and the
consequent ability to cope with the resultant event which is normally in the form of a disaster.
Possession and access to resources in the form of capital, material and human assets is crucial
to achieving a sustainable livelihood or recovering fully from a disaster. The households with
access to finances, able bodied persons (willing and able to work), and the necessary tools
and equipment in a sense have the better chance of recovering quickly from a disaster. The
25. 16
poorest people are often the most vulnerable as they have generally not much choice but
locate themselves in the most disaster prone settings.
With the advent of climate change and unpredictable weather patterns, the communal farmers
in Zimbabwe and indeed most of the developing countries are said to be at risk of drought
due to lack of guaranteed access to water bodies, lack of resources to support agricultural
activities and no control of the market for their goods.
2.4.1 Caroline Moser's Asset Vulnerability Framework- The AVF
In a study of the urban poor in four urban communities in four countries namely Zambia,
Ecuador, Philippines and Hungary, Moser (1998) developed an asset vulnerability framework
that consists of tangible (labour, housing and human capital) and intangible assets (household
relations and social capital). The framework argues that the management of the above
complex asset portfolio determines household poverty and vulnerability. A thorough
understanding of this framework then assists policy makers to come up with interventions
that promote opportunities for the poor to productively use the above assets to cushion their
livelihoods. Moser hence argues against limiting poverty analysis in terms of consumption-
income measurements to include a whole range of assets available to the poor. Within this
framework, vulnerability is defined as people’s susceptibility to move into and out of poverty
situations. In line with this definition, poverty is quite a static concept in time. A further
distinction is made between two concepts of vulnerability namely sensitivity and resilience.
Sensitivity refers to the way a system responds to an external shock or event whole.
Resilience refers to the speed with which a system recovers from shock or stress. On the basis
of the case study of the 4 urban communities in the 4 countries, Moser (1998) identified key
household income raising strategies to mobilize assets in response to changing economic
circumstances to include; labour, housing, social and economic infrastructure, household
26. 17
relations and social capital. In Moser’s 1998 study, labour was used as an income raising
asset in the following ways4
;
Increasing the number of women working mainly in the formal sector
Allocate a disproportionate share of women’s time to meet increasing responsibilities
Allocate more time to obtaining services in response to the declining quality of
infrastructure
Increase reliance on child labour
Housing was used as an income raising asset through the diversification of income exploiting
home-based businesses and rent seeking. Land was also reserved to accommodate the
children of the household.
Household relations were used as an income raising asset through the support of the extended
family network and receipt of remittances.
Social capital was used as an income raising asset through the following ways;
Increase reliance on informal credit arrangements
Increase informal support networks among households
Increase community level activity
The most important implication of Moser’s approach is that it advocates for policies to be put
in place that promote opportunities and removes obstacles and ensures that the poor are able
to use their assets productively. This has often been referred to as the asset-institutions
opportunity nexus.
Although Moser’s (1998) typology was mostly developed for the urban poor, it is very
relevant to the livelihood and vulnerability question in Zimbabwe for the following reasons;
4
As adapted from Moser’s Asset Vulnerability framework of 1998
27. 18
The framework provides a platform for livelihood and vulnerability and poverty
alleviation its advocacy for policies that promote opportunities for the poor to better
manage their assets (the asset-institution-opportunity nexus).
There has admittedly been noticeable growth in asset ownership structure for some of the
beneficiaries.
2.5 Communal Farmer
The communal farmers are black indigenous Zimbabweans who benefitted from the FTLRP
who formerly resided or still reside in communal areas and practice agriculture largely for
subsistence purposes. At times, they may produce excess crops and livestock products which
they sale. Some of them were allocated land in former commercial farms during the FTLRP
through the lands ministry, local government or political affiliation (The Zimbabwe Institute
2007). They have never really graduated into fully fledged commercial farmers. Communal
farmers generally do not possess title deeds to the land under their possession.
2.6 The Communal Areas: Livelihoods and Vulnerability
Chambers and Conway (1992) outlined that livelihood systems were made up of the
capabilities, assets (made up of both material and social resources), and activities to be
carried out for a survival. Assets and other activities carried out in the household constitute
that livelihood strategy for the household. Ellis (2000) explains that livelihood strategies
constitute the income generation and other activities in the form of cultural and social
choices. Livelihoods approaches show the diverse framework of sustainable livelihoods. The
differences in livelihood assets in the form of the social, natural, financial, physical and
human capital is utilised for livelihoods. In a sustainable livelihoods framework, Scoones
(2009) outlines that the context is framed in the vulnerability context that takes into account
other issues such as seasonality, trends, and outside shocks.
28. 19
Communal rural set ups and their inhabitants make up the major population. Generally, they
are the "research site" of most social science research in Zimbabwe. Many studies have
illuminated various dimensions of complex rural economies, ecological tensions, land
conflicts, class differentiation, ethnic conflicts, and even political violence. The Rhodesian
colonial state forced many communal farmers into protected areas in an effort to cut the
social and livelihoods support for the end freedom fighters during the armed struggle. The
communal areas were then targeted as places that needed constant support from the
government to redress the disadvantage of colonial rule and underdevelopment. Resources
were channeled for education, health centers, agricultural support and research.
Rural development is also shaped by other structures that govern access to resources and how
they are exploited. There has been a history of discriminatory practices that were a function
of the patronage system and other power differentials. However, in Zimbabwe, the power
dynamics shape the interface between the state and the rural political economy. In the
communal countryside, the formal and informal institutions serve to maintain the status quo
with the majority of the population in perpetual fear.
The governing framework for the management of natural resource in the form of grazing and
farming lands and conservation efforts have not achieved much to enhance the capacity of
communal farmers to respond effectively to droughts or floods as driven by climate change.
Maize cropping year after year is still a common practice, despite the demonstrated
unsuitability for the areas with average to below average rainfall patterns.
Other relevant institutions act ways that generate or promote risk vulnerability. A selection of
the key institutions that define livelihoods in this area include those that relate to access to
29. 20
land and enforcement of property rights and contracts. Access to capital and the commodity
markets is also important in addressing the vulnerability question.
The colonial legacy invariably lies not only at the very heart of the glaring inequalities in the
means to livelihoods and but also in access to information, welfare provisioning, to law
enforcement measures and mechanisms for fair settlement of disputes. There also exist
inequalities in rural Zimbabwe in all these issues. Local government institutions worsen the
challenges that newcomers or those on the wrong side of the political divide face in gaining
access to land and other farming resources.
Importantly, in the resettlement areas, many of the residents would have come from different
places and this makes the construction of social networks a very difficult process. When
people are not very much aware of the origin of their neighbors, naturally there are high
levels of mistrust.
2.7.1 Sustainable Livelihoods and Vulnerability Analysis
There is generally a high correlation between being affected by man-made or natural disasters
and being poor. Hence any policy aimed at addressing livelihood must in essence also
consider the question of vulnerability. Any policy on land reform with the intention of
enhancing rural livelihoods must then be aimed at protecting and reinforcing livelihoods in a
manner that makes people more resilient to natural hazards. In the case of Zimbabwe, the
incessant economic difficulties impact on building resilience. Consequently, safety must
come either through:
the reinforcement of community wellness indictors such as nutrition, health, and others.
further support of the normal livelihood strategies and building resilience to the possible
impacts of hazards such as changing weather patterns due to climate change;
30. 21
or by availability of adequate social protection programmes by government and civil
society.
Cannon (2001) explains that livelihoods and social protection are also a function of the social
and political networks as developed by the people. There is the realisation that different
groups have differing levels of access to networks and sources of livelihood. The networks
may have varying degrees of cohesion and resilience to disasters. They may also engage in
rivalry and disputes, especially over aid and the recovery process (Cannon 2001). This has
been a factor in Zimbabwe with media reports mentioning the politicisation of the land
reform programme and aid initiatives by both government and civil society.
With disasters unavoidable, it is crucial to make sure that assistance with the recovery is in
line with the restoration and reinforcement of livelihoods. The processes must also strengthen
self-protection programmes that reinforce social protection through supporting the relevant
institutions. However, there are other related issues such as institutional support mechanisms,
as noted in the Hurungwe district case study whose results are detailed in Chapter 4.
In the results that follow, the study highlights the fact that people become vulnerable as a
result of processes and conditions that may be outside the control of the household or
livelihood itself. How vulnerable a household is, becomes a function of how weak or strong
the livelihoods are. There is also invariably the question of the breadth of assets that provide
the basis for their livelihood strategy.
Livelihoods and vulnerability interface with the socioeconomic and political systems that are
an insight into the power relations of any given community. Consequently, Heijmans (2001)
suggest the need to trace back from the current endowments for household livelihoods along
a causal chain back to the processes and institutions that determine the distribution of safety
31. 22
and vulnerability in society. Vulnerability is a function of the degree of exposure to risk
ranging from high levels to low levels. However, there has been some opposition to the use of
the term in this manner as there are implications since disasters, particularly in developing
economies such as Zimbabwe often result in victims with limited capacity to recover their
normal livelihoods. To that extent not being vulnerable will relate to having capacities to
cope and recover more rapidly from a disaster (Heijmans 2001).
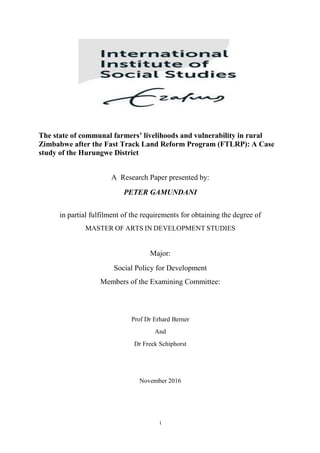
2.8 The Conceptual Framework: Sustainable Rural Livelihoods- Ian Scoones
The Sustainable Livelihood approach suggested by Scoones (1998) shifts the aim from the
preoccupation with income and consumptions patterns when addressing poverty, to patently
centering the role of assets play in the welfare of individuals and society. Focus is on policies
that can compensate for the intrinsic inequalities in the ownership of assets. There exists an
endeavour to have equal chances for asset that sustain livelihoods through policies that level
the playing field and enable access to basic amenities. Asset enhancing is an avenue that
hinges on the addition and management of household and community held property (Scoones
2009). This becomes an important aspect of sustainable livelihoods. Assets take the role of
enhancing the person’s and community livelihoods to realise sustainable livelihoods. In this
study, focus will be on the asset ownership structure of the beneficiaries of the FTLRP and
how this has a relationship with their livelihoods and also how it distances them or brings
them closer to vulnerability.
Asset ownership and building is then argued to be a key component in guaranteeing
sustainable livelihoods. Assets play an important role in enhancing a household’s economic
and social well-being. Policies hence must consequently be alive to the question of asset
accumulation by the poor and vulnerable. The consolidation of assets becomes a strategy to
32. 23
fight poverty. Moser (2005) outlines the state’s role in asset building through availing
opportunities for their accumulation.
The Zimbabwe FTLRP Zimbabwe could arguably be viewed as an example of a government
taking some steps to enable access to land as both an intrinsic and extrinsic asset for the
people. Asset ownership potentially makes the rural poor better positioned to tackle poverty.
Land reallocation becomes an important step towards reducing vulnerability among the
communal farmers. The sustainable livelihoods approach (SLA) as illustrated below seeks to
have insights into the strengths (assets or capital endowments) and how they then strive to
convert these into positive livelihood outcomes. People must have a variety of assets and this
helps in improving their economic indices. Moser (1998) outlines vulnerability as closely
related to asset ownership. Assets are an important determinant of poverty and vunerability.
With less assets one’s insecurity levels increase. Asset building must be included in issues
related to vulnerable and livelihoods particularly of the communities in marginalised areas.
Livelihoods as Scoones (1998) argues are sustained when people can recover from shocks
such as droughts. They are able to maintain their assets whilst at the same time maintain the
natural resource base.
The Sustainable Livelihoods Framework
34. 25
CHAPTER 3 METHODOLOGY
3.1 Background
In addressing the earlier outlined research questions, the researcher used a mixed methods
approach. The use of both quantitative and qualitative research techniques is important as it
allowed for detailed information in the form of asset ownership structure and quantitative
matrices to enable comparisons based on land size and structure. Observation, a cross-
sectional survey, key informant interviews and focus group discussions were used in data
collection.
The qualitative approach was major feature of the formative stages. This gave the researcher
the opportunity to gain very detailed information that could otherwise not have been obtained
through the use of a closed ended questionnaire. This research is the culmination of years of
observation as the researcher lived in the area for some time and noted transformations that
were taking place post the FTLRP in 2000. Poverty and constrained livelihoods have
characterized the study area.
It was important that the livelihoods and vulnerability perceptions be studied using
triangulation. The study had the major objective of establishing the connection between
vulnerability and livelihoods hence the mixed methods approach enabled the exploration of
the dynamics of the challenge and gaining of new insights based on the research findings
(Gerson and Horowitz 2002:199).
In exploring the links, I have deeply explored the triangular (Vulnerability – Livelihoods-
Assets- Shocks) relationships as outlined in the theoretical framework. I also intended to run
a correlation matrix as well as regression analysis to note the relationships and the
35. 26
incremental validity of asset ownership, family size and vulnerability. The regression analysis
enabled prediction of productivity based on asset ownership. Determining asset ownership
structures is important in understanding livelihoods and vulnerability.
3.2 Case Study Area
A typical case study approach was used to explore the changes in the livelihoods and
vulnerability patterns of respondents in Hurungwe district in Mashonaland West (See
appendix 4). The choice of Hurungwe was based on the fact that this area was a hotspot and
at the very heart of land reform in 2000. In addition, Hurungwe was chosen for the
researcher’s convenience, as he had worked extensively in the area and had the contacts to
assist in doing field work for a potentially volatile subject.
The data was collected in Hurungwe District (Central), Ward 18 in Mukuyu Village A1
where beneficiaries were allocated up to 10 hectare pieces of land. The former commercial
farming area is surrounded by former Tribal Trust Lands which include Magunje, Hurungwe
West, and Hurungwe East. These beneficiaries have largely retained a communal farming
lifestyle when compared with the production levels of the former commercial farmers.
3.2.1 Focus Group Discussion
Two focus group discussions were carried out at Mukuyu Primary School which was
convenient as it was a centralised location. Focus groups enabled missing gaps from the
cross-sectional survey to be better understood.
3.2.2 Survey
Data collection for the questionnaire was done at Mukuyu Township using availability
sampling strategy. This sampling strategy was used as the researcher could not get the
sampling frame with the entire population which would have enabled other sampling
36. 27
techniques to be employed. Convenience sampling after all was ethical as respondents were
not coerced and freely participated.
3.2.3 Key Informants Interviews
The researcher interviewed the Director, Crops Research Division. Department of Research
& Specialist Services in the Ministry of Agriculture in Harare at their Offices using an
interview guide. The Principal Director for Extension Services, in the Ministry of
Agriculture, Irrigation & Mechanization was also interviewed and he facilitated the
researcher's access to the study area through the local authority and the agriculture extension
services worker in Hurungwe.
The former and remaining white commercial farmers are represented by the Commercial
Farmers Union (CFU). The researcher interviewed the president of Commercial Farmers
Union of Zimbabwe at the Harare Exhibition Park offices.
The Zimbabwe Commercial Farmers union (ZCFU) was also interviewed. The interview was
carried out with the Director of ZCFU at Harare Exhibition Park. The Zimbabwe Farmers
Union (ZFU) was also interviewed with the researcher interviewing the Chief Economist of
the union.
Dr Ibbo Mandaza from the Southern African Political Economic Series (SAPES) was also
interviewed as he has written on the FTLRP.
Hurungwe Central Councillor Ward 18 was also interviewed at Mukuyu Primary School.
3.3 Instrumentation
A questionnaire was used for the survey (see appendix 1). For the key informant interviews
an interview guide was used (see appendix 2). For the focus group discussion, another
interview guide (see appendix 3) was also developed but mainly from the issues raised in the
one used with key informants.
37. 28
3.4 Sampling
Availability and purposively sampling was employed as there was no sampling map and with
this kind of research, one is likely to get meaningful responses when respondents freely take
part. For the survey, in-depth interviews and the focus group discussion, availability sampling
was also used. The sampling strategy was also ethical as it eliminated possible coercion of
respondents.
3.5 Data Analysis
The data from the cross-sectional survey using the closed ended questionnaire (Appendix 1)
was to be analysed using the Statistical Package for Social Sciences (SPSS version 22). A
correlation matrix was run and will be presented in Chapter 4. Data from the in-depth
interviews and the focus group discussions was summarised using themes as it was
qualitative in nature.
3.6 Ethical Considerations
Research on land issues is bound to be an emotive issue in Zimbabwe. It was important for
the researcher to seek authority from the Ministry of Agriculture, Irrigation and
mechanization to carry out data collection. This was necessary as security protocols require
permission to be granted before getting into the field.
For the interviews with key informants, the researcher gave an insight into the study and then
sought informed consent. The respondents were then advised that they could withdraw from
the research at any time. They could choose to answer or decline to answer any questions as
posed. They could also stop the interview at any time.
Confidentiality was also assured and their responses could not be attributed directly to them.
However, the respondents in the civic sector advised the researcher that he could even quote
38. 29
their names if he so wished. Dr Mandaza went to the extent of asking the reporter to quote
him verbatim if he so wished.
3.7 Study Limitations
The study was confined to the period before and after the FTLRP and thus is limited in the
manner it can address questions related to livelihoods and vulnerability. The period for data
collection was also quite limited and with the challenges of access, the sample size was
invariably limited. Importantly, there is increasingly a movement towards factoring issues
related to climate change particularly in building the resilience of communal farmers. The
reality is that resilience is very much related with vulnerability and livelihoods
enhancements. The research questions hence limited the extent to which the researcher could
consider issues on climate change which has become topical in discussions on vulnerability
and livelihoods particularly for the worst affected communal farmers in the third world as
was the case for the study area.
39. 30
CHAPTER 4 RESULTS ANALYSIS
4.1 Introduction
The SPSS Version 22 was used to analyze the survey questionnaire items. The descriptive
data is presented in the form of frequency tables and graphs. The quantitative analysis
constitutes the first section. The qualitative data from the key informants and the focus group
discussions makes up the latter part of this chapter.
4.2 Household Demographic Profiles
Assessing the household characteristics of the respondents isolated the primary indicators of
vulnerability and livelihood in the context of the FTLRP in the study area. Table 4.1 presents
the general profiles of the households that constituted the sample with regards to gender, age,
academic background and other demographic variables.
4.2.1 Gender of Household Head
More males (72.7%) took part in the study compared to females (27.3%). The gender
differences can be attributed to the fact that more male household heads in the African
Tradition Religion, despite there being more females in the country (52%), (ZimStats 2012).
4.2.2 Age of Respondents
73.9% of the respondents were aged between 30 to 50years of age. The age distribution is
skewed towards the economically active age group, the youth and middle adulthood. The age
findings point to the economically active taking farming as an alternative source of livelihood
to formal employment, particularly considering the fact that the formal sector is shrinking.
4.2.3 Education / Academic Qualifications
97.4% of the household heads had at most attained Ordinary Level as the highest educational
qualification. Of these, the majority (51.3%) were O-level certificate holders. Only 2.6% of
the household heads had a tertiary qualification. The sample distribution can potentially show
that the majority of the household heads did not have solid professional qualifications which
can be a challenge with regards employability outside of farming.
40. 31
4.2.4 Marital status
Regarding marital status most the majority, 89.2% of the households were married and living
together. There remainder 10.8% were either divorced or widows/widowers.
Table 1: Household Demographic Characteristics
Gender (n=46) Percentage
Male 72.7%
Female 27.3%
Marital status
Married living together 89.2%
Divorced or separated 2.7%
Widow/Widower 8.1%
Educational level
Primary level 20.5%
ZJC level 25.6%
O'Level 51.3%
Tertiary Level 2.6%
Household status
Husband 65.2%
Wife 30.4%
Sondaughter 4.3%
Age in Years
<=20 4.4%
21-30 4.4%
31-40 30.4%
41-50 43.5%
51-60 6.6%
Above 60 10.9%
Number of years living in village
<5 0.0%
6-10 19.6%
11-15 15.2%
Above 15 65.2
Number of pupils living in the HH
3.00 4.4%
4.00 8.9%
5.00 13.3%
6.00 15.6%
7.00 22.2%
8.00 13.3%
9.00 4.4%
10.00 11.1%
12.00 4.4%
15.00 2.2%
41. 32
4.3 Number of years living in village
With regards to number of years respondents had been living in the area, the majority, 65.2%
have lived in the village for more than 15 years. None had lived in the village for a period of 5
years or less. This enabled many to meet the inclusion and exclusion criteria. The researcher
needed respondents who could track their lives before and after the FTLRP.
4.4 Household Asset Endowment, Production and Resistance to External Shocks
This section sought to show the extent the link between asset ownership, productivity and
recovery from shocks.
Table 2 Household Assets Distribution
Asset Numbe
r of
assets
1 2 3 4 5 Abov
e 5
Mi
n
Max Mean Std
Plough 86.4% 13.6
%
1.00 2.00 1.136
4
.34714
Car 17.4% 2.2% 2.2% 1.00 3.00 1.300
0
.67495
Scotch
cart
97.0% 3.0% 1.00 2.00 1.030
3
.17408
Tracto
r
4.2% 1.00 1.00 1.000
0
.00000
Hoe 0.0 2.3% 14.0
%
7.0% 9.3
%
67.5% 2.00 17.0
0
6.558
1
2.8477
4
Brick
houses
11.6% 18.6
%
23.3
%
37.2
%
7.0
%
2.3% 1.00 6.00 3.162
8
1.2330
8
Shovel 54.3% 31.4
%
8.6% 5.7% 1.00 4.00 1.657
1
.87255
Planter 4.2% 1.00 1.00 1.000
0
.00000
Other 80.0% 20.0
%
1.00 3.00 1.400
0
.89443
86.4% of the households had a plough and one in five respondents owned a car. 4.2% had
two or more cars. All households had a scotch carts. With regards to tractors and planters,
42. 33
only 4.2% households owned these. Asset ownership was generally not remarkable. Only a
few owned critical farming assets such ploughs, planters and tractors. With land sizes of over
7 hectares allocated, more valuable assets are required for meaningful production.
Asset ownership is important in recovery from shocks as the loss of one or more assets must
still leave the household with the means to eke a decent living. The respondents were
generally vulnerable.
Table 3: Crops Grown By Household
N Min Max Mean Std
Size of land devoted to crop( Hectares)
Maize 46 .25 3.00 1.66 .73
Sorghum 2 .25 .50 .38 .18
Rapoko 1 .50 .50 .50 .
Tobacco 40 .40 3.00 1.22 .51
Cotton 0
Yield(Tonnes)
Maize 46 .50 15.00 3.68 2.63
Sorghum 1 .45 .45 .45 .
Rapoko 1 1.00 1.00 1.00 .
Tobacco 39 .20 12.00 2.20 2.18
Cotton 0
Amount sold (Tonnes)
Maize 17 1.00 12.00 3.23 2.70
Sorghum
Rapoko
Tobacco 38 .20 25.00 2.54 4.03
Cotton
Other 3 .20 .50 .33 .153
Amount of income (Dollars)
Maize 16 290.00 4080.00 1166.25 960.43
sorghum
rapoko
tobacco 37 562.00 12700.00 3803.29 3080.83
Cotton
Other 3 150.00 1000.00 650.0000 444.40972
Table 3 illustrates the types of crops grown, hectarage cultivated, amount of produce
harvested and the income derived from the farming venture. Results indicated that all
43. 34
households grew maize and a significant number (40), were into tobacco farming which is a
cash crop.
These results may indicate that maize is grown largely for consumption, as only 16 out of 46
households sold their produce compared to tobacco where 37 out of the 40 sold their tobacco.
The implications of the findings are that a significant proportion of the FTLRP beneficiaries
used farming as a survival strategy and tobacco growing was the preferred cash earning
strategy.
Table 4: Livestock Per Household
Livestoc
k
Numbe
r of
livestoc
k
1-5 6-10 11-
15
16-
20
21-
25
26-
30
Abov
e 30
Mi
n
Max Mea
n
Std
Cattle 64.3% 30.9
%
4.8% 1 14.0
0
4.62 3.04
Goats 70.4% 14.8
%
7.4% 3.7% 3.7
%
1 25 5.56 5.87
Sheep 66.7% 33.3
%
2 9 4.78 2.11
Chicken
s
15.4% 15.4
%
25.6
%
10.3
%
7.7
%
35.6
%
2 86 24.2
1
22.7
2
Donkey
s
33.3% 66.7
%
4 8 6.00 2.00
Pigs 100.0% 2 2 2.00 .
Other 50.0% 50.0
%
5 6 5.50 .707
The majority owned between one and five animals of each type as follows; cattle (64.3%),
goats (70.4%), sheep (66.7%) and pigs (100%). A significant percentage (43%) of the
households had more than 25 chickens and 66.7% owned between six to eleven donkeys.
Ownership of animals is important as it has a relationship with vulnerability and the
livelihood strategy to be employed. Selling livestock when crops failed is usually carried out.
44. 35
Sources of Farming Inputs at HH level
Table 5: Source of Crop Seeds
Source Maize Sorghu
m
Rapoko Tobacc
o
Cotton Other
Market 45.7 2.2 0 15.2 2.2
Presidential
Input scheme
56.5 0 0
Granary 2.2 0 2.2 2.2
Relatives/frien
d
2.2 0 5
Contractor 2.2 0 0 43.3 1.4 2.2
Other 27.5 2.2 0 28.3 8.7
The major sources of maize seed for the households were the open market and presidential
input scheme respectively. For tobacco farming, contractors, other sources and the open
market were the major suppliers, accounting for 43.3%, 28.3% and 15.2% in that order.
Tables 4.5 and 4.6 reveal similar trends for sources of fertilizers and chemicals.
The implications are that agriculture without subsidies can be an unviable livelihood strategy.
Table 6: Fertiliser Sources
Source Maize Sorghum Rapoko Tobacco Cotton Other
Market 46.7% 2.2% 15.2% 4.3%
Presidential Input
scheme
47.8%
Contractor 2.2% 39.1% 2.2%
Do not apply 4.3%
Other 43.5% 2.2% 32.6% 8.7%
Table 7: Farming Chemicals Sources
Source Maize Sorghum Rapoko Tobacco Cotton Other
Market 52.2% 2.2% 15.2% 4.3%
Presidential Input
scheme
13.0%
Contractor 2.2% 4.1% 2.2%
Do not apply 4.3% 28.3%
Other 43.5% 2.2% 28.3% 8.7%
The communal farmers advised that the government was only supporting the staple food
(maize) and was not doing much with regards to small grains. This has implications for
45. 36
livelihoods as the small grains were more drought resistant as climate change was becoming a
reality with more droughts being experienced since 2000. The farmers hence sourced their
own inputs, for both maize and tobacco. Contractors were found to be supporting farmers
with inputs for tobacco farming mostly, maize and cotton to some extent.
Table 8: Income Sources Per Household
Monthly N Min Max Mean Std
Farming 73.7% 40.00 500.00 212.94 119.33
Remittances 2.2% 452.0 452.00 452.00 .
Yearly N Min Max Mean Std
Farming 89.1% 200.0 10000.00 2447.00 1876.15
Piece jobs 4.4% 200.0 12000.00 6100.00 8343.86
Remittance 2.2% 450.0 450.00 54000.00 .
The major source of livelihood for the FTLRP beneficiaries on both monthly and yearly
levels was found to be farming and very few received remittances or did part time jobs.
Figure 2 Record Keeping
Figure 2 indicates that the majority, 82.6% of the FTLP beneficiaries kept records of their
farming activities while 10.9% did not do any record keeping. The remainder partially kept
records.
[VALUE]%
[VALUE]%
[VALUE]%
Yes Partially No
46. 37
Figure 3 Labour Sources at Household Level
In terms family support, 63% of the households were assisted by their children for labour.
15.2% relied on their spouse and only 4.3% relied on their parents. With regards to regular
paid staff, the majority (71.7%) of the surveyed households did not employ any labourers
while 26.1% employed temporary workers as the need arises. Most hence derived their labour
from household members.
15.2
63
4.3
17.4
0 0 00 0 0 0
26.1
2.2
71.7
0
10
20
30
40
50
60
70
80
%ofHouseHolds
Source labour
Members of household/family who help in farming
Regular paid stafff
47. 38
Figure 4. Bank Account Possession and Loan Access
A summary of the findings on whether the household head had a bank account, had obtained
a loan and was able to buy inputs are presented in figure 4.4. Results indicated that only
21.7% of the respondents had a bank account, and those with such accounts, 69.6% had
separate accounts for the farming business and their private account. Of those who had taken
loans, only 21.7% did not use that money to get inputs. Results points towards the fact that
farmers are not utilising banks to their full potential and those who borrow money are using it
for its intended purposes like purchasing inputs.
0 0 0 0 0 0 0
69.6
8.7
21.7
13
45.7
41.3
0 0 0
28.3
43.5
28.3
71.7
0 0 0
0
10
20
30
40
50
60
70
80
90
100
%ofHouseHolds
Source labour
Having a bank account Taken a loan last year Being able to buy inputs
48. 39
Table 9: Number of Paid and Unpaid Workers by Household
Number of
workers
Frequency Percentage (%)
1.00 1 2.2
2.00 3 6.5
3.00 1 2.2
4.00 1 2.2
5.00 1 2.2
6.00 2 4.3
Total 9 19.6
Do not have 37 80.4
Total 46 100.0
Table 9 supports earlier findings that very few of the farmers employed workers whether on a
temporary or full time basis. Only five people employed between 1 and 5, accounting for
11%.
Figure 5 Active Membership in Associations
The figure above illustrates that the majority 82.6% of the households did not belong to any
farming association, only 17.6% did. In terms of funding for the purposes of farming, most of
the farmers (46.9%), dependent on family members. Contractors accounted for the 17.8% of
17.4
82.6
0
46.9
17.8
26.7
0
20
40
60
80
100
Yes No Commercial
bank
Family Contractors None
%ofHouseHolds
Source labour
Active membership of any farming association Sources of farming capital
49. 40
the total variance with this regards. Just above a quarter of the households, 26.7% of the
households had no support. Results point to the fact that FLRP beneficiaries do not belong to
any farming organization like the ZFU or CFU. Such organisation are sources of support in
terms of inputs and farming knowledge when need arises.
Figure 6 Sources of Farming Information
Results on the sources of information for farming reveal that 82.6% of the households relied
on the radio, followed by indigenous knowledge systems (63%), extension officers (50%) and
workshops (45.7%). Eco-farm also plays a part in 34.8% of the households, while only 6.5%
on television with this regards. Results imply that the FTLP beneficiaries have varied sources
of information at their disposal. However a point of concern is the limited number who views
television as a source of information.
Figure 7 Corruption Perception
82.6
63
50 45.7
34.8
6.5
0
20
40
60
80
100
%ofHouseholds
Sources of information
4.3
95.7
10.9
89.1
0
50
100
150
Yes No Yes No
%ofHouseholds
Response
Pay any bribe to acquire land or transport your produce
50. 41
Figure 7 Above indicates the prevalence and perception of corruption. The results reveal that
only 4.3% of the resettled farmers have paid bribes to government officials for land
acquisition or to have their produce transported. In terms of threats of eviction, a significant
number 10.9% had received treats. Indications are that corruption could be rampant on the
farms.
Figure 8: Agreement with FTLRP Statements
Figure 8 indicates that nearly all beneficiaries of the FTLRP were thankful for the
programme. The FTLRP had enabled them to start farming, expand their farming activities,
upgrade farming equipment, provide gainful work to family members and even employ
additional workers
95.6 93.5
88.9
95.7
84.8
0
10
20
30
40
50
60
70
80
90
100
Could not
have started
farming
Could not
have
expanded
farming
activities
Could not
have
upgraded
farming
equipment
Could not
have provided
gainful work
to family
members
Could not
have
employed
additional
workers
%ofHouseholds
Axis Title
Fully agree Partly agree Disagree NA
51. 42
Household Coping Strategies at Household Level
Figure 9 Coping Strategies Adopted for Food in Relation to Shocks
Figure 9 shows the major livelihood strategies adopted to sustain family income requirements
and meet food requirements in the event of a disaster, such as crop failure. With this regards
most households, 76.6% depend on livestock as a source of family income while 53.3%
resort to buying and 24.4% on food for work in the event that crops fail. Results point to the
fact that livestock was a major source of livelihood for the respondents.
Figure 10 Remittances Received
53.3
15.6
24.4
75.6
4.4
11.1
2.2
6.7
0 20 40 60 80 100
Buying
Barter trade
Food for work
Borrow
Other
Sale Livestock
Barter trade
Paid labour
Borrow
Other
% of Households
Sourcelabour
Sustain family income needs in case of poor harvests
Meet food requirements in case of crop failure
[VALUE]%
[VALUE]%
Yes No
52. 43
The majority, 65.9% received help from outside communities (Figure 10). All respondents
received training from AGRITEX and GMB (33.3%). GMB facilitates the provision of inputs
and food. NGOs are helping with farmer training and provision of food (table 13).
Table 10: Institutions Supporting Livelihoods Strategies
Institution Form of support
Education/Training Input supplies Food supplies Other
AGRITEX 31(100.0%) 0(0.0%) 0(0.0%) 0(0.0%)
GMB 1(33.3%) 1(33.3%) 1(33.3%) 0(0.0%)
OTHER GVT 1(2.0%) 26(51.0%) 24(47.0%) 0(0.0%)
NGO 1 1(50.0%) 0(0.0%) 1(50.0%) 0(0.0%)
NGO 2 0(0.0%) 0(0.0%) 1(100.0%) 0(0.0%)
53. 44
4.5 TEST STATISTICS ANALYSIS OF THE CROSS-SECTIONAL SURVEY
DATA
4.5.1 The Relationship between Number of people in a Household, Assets Endowment
and Production
Number
of people
in
household
Production farm
asset
Income
per
year
Production Pearson
Correlation
.543
Sig. (2-
tailed)
.036
N 42 43
farm asset Pearson
Correlation
.286 .350*
Sig. (2-
tailed)
.066 .021
N 42 43 43
Income per
year
Pearson
Correlation
.315 .331*
Sig. (2-
tailed)
.047 .000 .033
N 41 42 42 42
Support from
outside
Pearson
Correlation
.110 -.109 -.129 -.086
Sig. (2-
tailed)
.495 .491 .415 .595
N 41 42 42 41
Table above shows the relationship between household composition, household asset
endowment and income as indicators of productivity among the beneficiaries of the FTLRP.
Results indicated that a positive and statistically significant relationship existed between the
number of people in a household and productivity (r=0.543, p=0.036). Income was also
positively related with farm asset ownership (r=0.33, p=0.047). The implication of the
finding could be that households with more members tended to produce more whilst owning
a higher number of farm implements had a positive relationship with productivity.
54. 45
Table 11: Gender Differences on Assets and Productivity
Asset Endowment
gender N Mean Std.
Deviation
farm asset
Male 30 13.7667 5.31545
female 13 9.6923 3.22451
Livestock reared
Male 30 31.8333 2.26635
female 13 19.8462 2.43627
Total land size
Male 30 5.9667 .41384
female 13 6.0769 .27735
Income per year
Male 29 4615.8621 54.88605
female 13 2196.9231 17.30110
Support from outside
Male 30 1.3333 .47946
female 12 1.2500 .45227
The above table 4.6 shows the distribution of the sample in terms of asset endowment
by gender. In terms of farm assets, males had generally more assets (mean=13.77,
Std=5.13) than females (mean-9.69, Std=3.22). This has implications for livelihoods.
4.5.2 Plot Sizes
However, in terms of plot sizes, no notable difference was realized females
(mean=6.1Ha, Std=0.28Ha) compared to males (mean=5.96, Std=0.41).
4.5.3 Income Levels
On the average males (mean=$4615, Std=54.88) were getting more income than
females (mean=US$2196.92, Std=US$17.30). Outside remittances were very few.
55. 46
Table 12 Independent Samples Test (Asset Endowment and Gender)
Levene's
Test for
Equality of
Variances
t-test for Equality of Means
F Sig. T df Sig.
(2-
tailed)
Mean
Difference
Std. Error
Difference
95% Confidence
Interval of the
Difference
Lower Upper
farm
asset
Equal
variances
assumed
1.13 .29 2.55 41 .014 4.07 1.59 .85640 7.29231
Equal
variances
not
assumed
3.087 36.155 .004 4.07 1.31970 1.39829 6.75043
livestock
reared
Equal
variances
assumed
1.66 .20 1.418 41 .164 11.987 8.45320 -5.08440 29.05876
Equal
variances
not
assumed
1.589 30.214 .122 11.98718 7.54374 -3.41461 27.38897
Total
land size
Equal
variances
assumed
.009 .92 -.876 41 .386 -.11026 .12585 -.36442 .14391
Equal
variances
not
assumed
-1.02 33.443 .314 -.11026 .10782 -.32952 .10900
Income
per year
Equal
variances
assumed
4.606 .038 1.56 40 .126 2418.93 1548.21655 -
710.12337
5548.00136
Equal
variances
not
assumed
2.17 40 .036 2418.9 1114.97049 160.87420 4677.00379
Support
from
outside
Equal
variances
assumed
1.269 .267 .517 40 .608 .08333 .16127 -.24260 .40927
Equal
variances
.530 21.468 .601 .08333 .15719 -.24313 .40979
56. 47
Productivity and Gender
Table 4.8: Influence of Gender, marital status, educational level and
number of Household members on Production
Model
Model R R Square Adjusted R
Square
Std. Error of the
Estimate
1 .504a
.263 .514 .40916
a. Predictors: (Constant), number of people in household, marital status,
education level, gender
The number of people in a household, marital status, educational level and gender were
related to productivity (r=0.504) and 26.3% of the differences in productivity are explained
by variations in these predictors.
The ANOVA table below shows that productivity could be predicted by the listed predictors.
A model can be drawn (F(4)=3.460, p=0.029) measured at p<0.05. The Model and ANOVA
tables show the regression model and how the predictors could determine productivity. This
has policy implications particularly in affirmative action programmes that could be mooted.
ANOVAa
Model Sum of
Squares
Df Mean
Square
F Sig.
, 1
Regression .978 4 .244 3.460 .029b
Residual 5.022 30 .167
Total 6.000 34
a. Dependent Variable: Production
b. Predictors: (Constant), number of people in household, marital status,
education level, gender
57. 48
Coefficientsa
Model Unstandardized
Coefficients
Standardized
Coefficients
t Sig.
B Std. Error Beta
1
(Constant) 5.085 .523 9.725 .000
Gender .184 .162 .211 1.132 .266
Marital status .064 .087 .137 .731 .471
Education level .039 .085 .085 .462 .648
Number in household .064 .030 .387 2.150 .040
a. Dependent Variable: total land size
The coefficients table illustrates the incremental validity of number of people in a household,
plus education level and marital status.
58. 49
CHAPTER 5 SUMMARY OF THE INTERVIEWS AND FOCUS GROUP
DISCUSSIONS
5.1 Introduction
This chapter summarises the perceptions of the observations, key informant interviews and
focus group discussions. The analysis is in response to the research question, objectives and
study questions. The results are targeted at illuminating the research topic, research objectives
and research questions as outlined in Chapter 1. The study sought to provide a rapid appraisal
on the impact of the FTLRP on livelihoods and vulnerability dimensions. There was also
intent to inform the policy and academic debate on the issues. Importantly, communal
farmers are generally not affluent and need assistance from government and non-
governmental organisations. Such support must be informed by evidence based approaches.
5.1.1 VULNERABILITY PATTERNS BEFORE THE FTLRP
At the FGD held at Mukuyu village, the farmers outlined that ‘Before the FTLRP, we had no
basic farm assets such as cattle, ploughs, and harrows. This was partly due to the fact that
most of us were young and also that these implements and assets were expensive to
purchase.’
Apart from asset vulnerability before the advent of FTLRP, the farmers outlined that they did
not have sound farming skills or training. There were also very few farming education
sessions arranged for communal farmers. It was also felt that support from the extension
officers used to be very minimal.
The communal farmers supplied labour to commercial farmers for a nominal wage and or
food ration. The rations were the same and did not take cognisance of the family size. The
wages were also very low. Some discussants highlighted that due to the low wages and
59. 50
inability to raise more income they could not manage to send their children to school, as
result those children were becoming farm labourers.
Another challenge which was exacerbating their vulnerability was the congestion in the
communal areas. There was not enough land for crop production and pastures for animals. As
a result they lost a lot of livestock the long dry summer spells and in periods when there was
little rainfall. Some of the areas they inhabited were also infested with tsetse fly which also
worsened the livestock losses.
The responses from the FGD had much resonance with the outline provided by the key
informant from the Ministry of Agriculture who said that vulnerability was a factor before the
FTLRP as communal farmers did not have access to good farming land. The land availed
after independence was under willing-buyer and willing-seller arrangement. This land was
very limited and could only be afforded largely by those who had the financial resources.
Many of the communal farmers were vulnerable as they not only lacked finance but also the
requisite farming knowledge and experience.
5.1.2 LIVELIHOODS PATTERNS BEFORE THE FTLRP
In the FGD it was pointed out that in order to sustain their livelihoods before the FTLRP they;
worked in farms, either working permanently for the commercial farmers or through
providing casual labour for a very low wage during the peak farming periods. Some of the
men were working in towns and cities employed in the army, transport sector as drivers and
other civil service sectors.
However, even though they were earning part of their income from labouring in the
commercial farms, they were also involved in art and craft activities, as well as market
60. 51
gardening. These survival strategies were performed with a target to raise incomes to meet the
household requirements. Some farmers also mentioned that they survived through poaching
wildlife and selling the meat in the local communities.
Farming was the mainstay of their livelihoods although despite the fact that they were not
producing enough to sustain them to the next cropping season. They ended up borrowing from
fellow communal farmers or working in the then vibrant commercial farms where they were
paid wages and food parcels.
Cotton production was done on a small scale was one of the main activities which earned
them some income. Maize production was also another activity which helped them to produce
their own food and they sold the surplus produce to the Grain Marketing Board (GMB).
However some respondents mentioned that they were facing challenges in late payments
during that period from the GMB.
5.1.3 The Commercial Farmers’ View on Vulnerability and Livelihoods in the Context
of the FTLRP.
The commercial farmers union’s Key Informant had a different view arguing that
vulnerability among the communal farmers was due to, “Poor organization, lack of collateral
for crops/investment finance, no room for crop/grazing rotations and the irrigation schemes
had largely collapsed.”
The farmers were already under vulnerability and livelihood strategies were not making them
food secure. Before the FTLRP, the communal farmers were argued to be surviving largely
on government and donor handouts and remittances from relatives employed elsewhere. The
communal farmers also at times depended on commercial farmers as labourers during peak
season and this helped to reduce their state of vulnerability.
61. 52
5.2 Transformations in Livelihoods after the FTLRP.
The communal farmers acknowledged that their livelihoods had indeed changed after they
were allocated land courtesy of the FTLRP. They indicated that they were more satisfied with
the new assumed standards of living.
They argued that they were better off than they were before the advent of the land reform
programme. The major change they highlighted was possession of land, which had intrinsic
and extrinsic value for them and this made them chart the trajectory of their livelihoods as
they were better able to plan on land use.
On the other hand, the key informant at the Commercial Farmers Union was of the opinion
that after the FTLRP most communal farmers were sustaining livelihoods through gold
mining, sale of natural timber and gum trees from the plantations developed by the former
commercial farmers, wildlife poaching activities and remittances. The union argued that this
was seen in the depletion of the strategic grain reserves which was a rarity at the height of the
commercial farming period. It was outlined that most of the land based activities had an
adverse impact on the environment as portions allocated were too small to sustain meaningful
farming activities. The absence of tenure was also seen as a threat to livelihoods as the
farmers could be moved at any one time as the displaced white farmers held title deeds to
their farms and were awaiting compensation in some cases. Without security of tenure, there
cannot be meaningful investment into farming by the communal farmers.
The key informants at the CFU and at the Ministry of Agriculture argued that vulnerability
was also in some situations not reduced after the FTLRP as some of the new farmers
“damaged the infrastructure, the buildings, irrigation facilities, the fences which surrounded
farms and other assets. They largely failed to co-exist and make use of the infrastructure as
groups for their own benefit. The reality has been that the FTLRP did not reduce the
vulnerability of the then communal farmers.”
62. 53
5.2.1 Asset Structure: Better homes
Through land acquired, they had managed to raise enough incomes to put up decent houses.
They had also equipped their homes with modern furniture including radios, televisions and
other gadgets they previously could only dream of.
5.2.2 Access to Information and Education
Education is a very crucial variable in livelihood and vulnerability. The farmers could now
access the latest information on weather patterns and crops to grow through the information
and education programmes as obtained from the media.
The communal farmers also outlined that they were now in a position to pay for their
children’s edu9cation.
5.3 Asset Ownership Structure, External Shocks and Livelihoods after the FTLRP.
In the FGD, the respondents outlined that within their group, there were now:
“Proud owners of tractors, motor bikes, scotch carts, irrigation equipment, cell phones and
cars. We also could only dream of owning a cell phone but now it is strange for anyone not to
have their own handset.”
The farmers outlined that they had also managed to organise themselves into groups and had
managed to raise the funds required for the electrification of their homes.
5.3.1 Related Developments: Electrification of homes and the potential for other
diversified incomes
Access to electricity had spawned other economic related activities such as welding at the
homesteads. Welding had then become a major source of funds. Income diversification is
crucial to recovery from external shocks. Welding does not depend on rains as farming
activities do so sustained livelihoods can potentially be achieved.
5.4 Related Support Services: Access to Social Welfare Services
The farmers also pointed out that they now had better access to health services as hospitals
and clinics where being put up with the assistance of the rural district councils. Grinding mills
63. 54
were also more accessible as most farmers had acquired them after selling their crops. Some
shops, owned by communal farmers were also coming up. This latter pointed to diversified
livelihoods.
5.4.1 Agricultural Extension Services Support
In terms of enhancing of the farming skills and knowledge, the resettled farmers advised that
they received much support from extension officers in their respective areas. They also
attended workshops and agricultural shows in the province and in Harare, the capital city.
The respondents commended the FTLRP as having played a major role in transforming their
livelihoods. They were convinced that the land reform programme had indeed raised them
from dire poverty.
5.5 Better Environmental Preservation Through Decongestion of Rural Areas
With the advent of the FTLRP, they were now better positioned to increase the sizes of their
cattle herds as they had moved from congested zones. With bigger grazing fields available,
they could consider cattle breeding, which they could not do in their former areas. A larger
herd size enabled sustained livelihoods as some of the cattle could be sold when crops failed.
5.6 Livelihoods and Vulnerability in the era of Climate Change and its Shocking
Effects
The farmers at the FGD acknowledged that climate change was a reality and was significantly
affecting their major source of livelihood, which was land based economic activities.
They outlined that:
“Farming was now threatened by climatic changes as each rainfall patterns had become
erratic. In 2015, we planted in October but that crop was affected by a long drought spell that
became only better after the Christmas period. We had to plant again January 2016.”
64. 55
This has implications as food security at household level was no longer guaranteed. The
harvests in some cases were no longer enough to ensure that they would have enough grains
to sustain them until at least the next cropping season.
As relying on farming could no longer make families food secure, the successive droughts and
floods at times heightened the vulnerability of some households.
There was a sense that it was not only crop production which was at stake due to the adverse
weather patterns but animal production was also at risk. There was potential to lose cattle
which are a source of wealth and a major asset as pastures were not regenerating fast enough
after sustained periods without rains.
When the crops failed there was also nothing left as fodder for cattle to graze on during the
dry spells when natural grass cover was sparse. Water was also a challenge as cattle need at
least 15 to 40 litres (Froes and Small 2001).
Farmers were at the risk of losing livestock as a result of the dry spells. In periods when crops
would have failed completely due to the adverse weather patterns, some farmers were forced
to resort to barter trade. They would exchange their livestock for maize and other cereals with
dealers who would come with grains to the area. The visits would be timed for the period
when most farmers were food insecure forcing them to change their, livestock for grain at
concessionary rates.
To address the challenges as emanating from the changing climatic conditions, the farmers
pointed that they were actively making use of irrigation facilities and buying more irrigation
equipment, for those fields that had water bodies nearby. They did this in order not to rely on
natural rain fed crop production which was the risk of the adverse weather patterns.