
Recommended
Recommended
More Related Content
Similar to Custos da Corrupção na União Europeia
Similar to Custos da Corrupção na União Europeia (20)
More from Paulo Dâmaso
More from Paulo Dâmaso (20)
Recently uploaded
Recently uploaded (20)
Custos da Corrupção na União Europeia
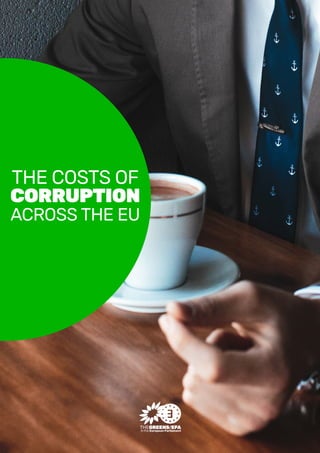
- 1. THE COSTS OF CORRUPTION ACROSS THE EU
- 2. CREDITS The Greens/EFA Group would like to thank the following persons for their work on this report: Pam Bartlett Quintanilla Patrick Cummins-Tripodi Awenig Marié Elisa Mussio Design and Layout: Jean Kutten
- 3. CONTENTS Summary ................................................................... 2 Recommendations .................................................. 5 The cost of corruption in Austria ......................... 6 The cost of corruption in Belgium ....................... 8 The cost of corruption in Bulgaria ....................... 10 The cost of corruption in Croatia ......................... 12 The cost of corruption in Cyprus ......................... 14 The cost of corruption in Czech Republic .......... 16 The cost of corruption in Denmark ...................... 18 The cost of corruption in Estonia ......................... 20 The cost of corruption in Finland ......................... 22 The cost of corruption in France .......................... 24 The cost of corruption in Germany ...................... 26 The cost of corruption in Greece .......................... 28 The cost of corruption in Hungary ....................... 30 The cost of corruption in Ireland .......................... 32 The cost of corruption in Italy ............................... 34 The cost of corruption in Latvia ............................ 36 The cost of corruption in Lithuania ........................ 38 The cost of corruption in Luxembourg ................ 40 The cost of corruption in Malta ............................. 42 The cost of corruption in The Netherlands ......... 44 The cost of corruption in Poland ........................... 46 The cost of corruption in Portugal ........................ 48 The cost of corruption in Romania ....................... 50 The cost of corruption in Slovakia ......................... 52 The cost of corruption in Slovenia ........................ 54 The cost of corruption in Spain .............................. 56 The cost of corruption in Sweden ......................... 58 The cost of corruption in United Kingdom .......... 60 Sources ....................................................................... 62
- 4. Corruption and abuse of power are not new phenomena in Europe, but the lack of ambition from the EU institutions to address corruption is now arguably emboldening some governments, propped up in some cases by EU funds, to increase their attacks on the rule of law or to consolidate their autocratic regimes. The headlines across Europe are increasingly full of corruption scandals - sometimes involving EU funds - embroiling politicians from across the political spectrum. Recent high-profile corruption cases have toppled the centre-right Rajoy government in Spain or triggered votes of non-confi- dence in Babiš’ liberal-led Czech Republic. The latest estimates regarding the cost of corruption across the EU put the loss to GDP as a result somewhere between €179 billion and €950 billion each year. However, corruption and its costs are often hard to grasp for the ordinary citizen, who still suffers the consequences of a lack of investment in es- sential public services, an unfair business environment and an abusive and reckless elite. Using the the most recent data and studies available, this document com- pares the costs of corruption to public investment in education, health- care, childcare and housing, elderly care, or policing and fire services. The aim is to raise public awareness about the cost of corruption across the EU by giving tangible examples of what this could mean for the average person, and to call for a substantial increase in the fight against corruption by the European Union institutions. WE HAVE ESTIMATED THAT THE HIT TO GDP, AS A RESULT OF CORRUPTION ACROSS THE EU, IS AROUND € 904 BILLION EVERY SINGLE YEAR (*) . This includes the indirect effects of corruption, such as loss in tax revenues and decreased foreign investment. (*) “The Cost of Non-Europe in the area of Organised Crime and Corruption”: http://www.europarl.europa.eu/RegData/etudes/STUD/2016/579319/EPRS_STU%282016%29579319_EN.pdf 2
- 5. To put that figure into a global context: it could end world hunger (annual cost: €229 billion); provide basic education to all children in 46 low and middle-income countries (annual cost: €22 billion), help eliminate malaria (annual cost: €4 billion); provide universal safe water and sanitation (annual cost: €129 billion); expand healthcare to gradually provide universal care to all in low and middle-income countries (annual cost: €115 billion); make the necessary yearly investment required to give everyone access to electricity by 2030 (annual cost: €45 billion); and then there would still be around €360 billion left. € 904 bn Hit to GDP across the EU 3
- 6. At a national level, the damage done by corruption to the GDP of EU Mem- ber States ranges from 15% in Romania (€38.6 billion) to 0.76% in the Netherlands (still adding up however to over €4.4 billion). Italy breaks the record in absolute terms, losing €236.8 billion each year to corruption. France comes second, losing €120.2 billion each year to corruption, whilst Germany takes a hit to GDP of over €104 billion every single year. At a more personal level, if we imagine that this money could be even- ly distributed among the more than 510 million people living in Europe in 2016, each person would get on average €1772 per year. In some countries the figures are much higher, meaning that, if the mon- ey lost to corruption in Cyprus and in the Czech Republic were distributed evenly, each person could receive 2500€ every year, a figure which rises up to €3,168 per person in Greece or even €3,903 in Italy. Even in coun- tries with relatively low levels of corruption such as Finland or Denmark, each citizen could annually receive €727 or €782 respectively. In half of EU Member States*, more than 80% of people think that cor- ruption is widespread in their country. However, most Europeans who are exposed to corruption do not report it, with only around a fifth of these people taking the decision to alert the authorities. Across Europe, people do not believe that government efforts to combat corruption are effective, particularly when it comes to tackling high-level corruption cases. The only institutions that the majority (60%) of Europe- ans trust when it comes to reporting corruption are the police, and the EU institutions lag far behind, achieving a paltry 4% trust rate. It is therefore urgent to take the fight against corruption all across Europe seriously. There is not a single country in which European citizens do not suffer the perverse effects of a corrupt political and economic elite. The fight against corruption requires action on many fronts, ranging from put- ting in place preventative measures to strong sanctions for corruption offences, but the results for the economy and for the citizens mean that it is more than worth it. * Bulgaria, Czech Republic, Croatia, Cyprus, Greece, Hungary, Italy, Latvia, Lithuania, Romania, Portugal, Slovakia, Slovenia and Spain. 4
- 7. Recommendations on the fight against Corruption in Europe To address corruption across Europe, particularly in the spending of EU funds, we call for: Annual review of anti-corruption practices in the EU Member States and country-specific recommendations on how to better prevent and address cor- ruption. The establishment of an anti-corruption index so that countries with higher corruption risks are subjected to more effective and recurrent controls when they spend EU funds. Whistleblower Protection should be enacted throughout the EU institutions, including the possibility for anonymous reporting. Measures for EU staff to blow the whistle should also be improved. Increasing OLAF’s capacity to investigate fraud of the EU budget and ensur- ing that there are real consequences in countries where OLAF recommenda- tions are not adequately complied with. In countries with deficiencies in the rule of law, the management of EU funds should not be entrusted to the national authorities but rather be controlled by the relevant EU Commission department. Strengthening of the EPPO to guarantee its independence and to include within its remit all cross-border corruption cases. There should also be a spe- cific focus on ensuring that high-level corruption cases in individual Member States are adequately dealt with. Regular independent oversight of the anti-corruption measures implement- ed by the European Commission, Parliament and Council as well as key institu- tions such as the European Central Bank and the European Investment Bank. Increased transparency over the allocation of EU funds, including on how projects are selected, the way projects are implemented, on how EU money is spent (including by elected Members), and around how EU funding is con- trolled. More EU funding should be granted to investigative journalists and to NGOs that focus on exercising a watchdog function when it comes to the spending of EU funds. Investigative journalists who are threatened for their reporting on corruption should be protected as a matter of urgency, and there should be close EU oversight including Europol cooperation in key investigations relating to the safety of journalists. 5
- 8. 6 THE COST OF CORRUPTION IN AUSTRIA THE IMPACT OF CORRUPTION ON SOCIAL POLICIES The €10.4 billion annually lost to corruption in Austria is also more than double the budget for the unemployed (around €5 billion). This figure is roughly a third of the country’s entire annual healthcare budget (€35 billion) and more than 20% of the total amount spent on the elderly (almost €46 billion each year). The €10.4 billion lost to corruption in Austria is more than 4 times bigger than the entire annual policing budget (over €2.4 billion); or, more than 17 times the size of the budget for the fire service (€608 million). If the money lost to corruption in Austria were to be entirely invested into the hous- ing budget, it could be dramatically increased and multiplied more than 26 times (from €398 million). The €10.4 billion lost because of corruption in Austria is bigger than the whole budget for family and children (€8.1 billion), and is more than one and a half times the sickness and disability budget (€6.7 billion). Austria loses almost 60% of the entire amount spent on education to corruption ev- ery year (€17.8 billion). A hit to GDP over €10.4 billion is lost each year in Austria due to corruption. That’s almost 4% of GDP. Double the unemployment budget
- 9. 7 – Austria – THE CONTEXT FOR INDIVIDUALS The amount of money lost to corruption in Austria is enough to give over 365,000 people in the country (more than 4% of the population) the average annual Austrian wage (€28,524 net in 2015. Austria’s unemployment rate was 4.9% in April 2018). How does receiving €1,201 each year for free sound? Well, that is how much each person would get if the money lost to corruption were distributed amongst everyone in Austria. If Austria could spend the money it loses to corruption each year, it could buy over 10.4 billion bottles of beer, or 1,201 beers for each person in the country each year. Not that we would recommend drinking that much, as that is more than three bottles of beer a day. It could also be used to purchase more than 1.9 billion loaves of bread (223 1 kg loaves for each person each year), and more than 2.1 billion bottles of red wine, which is 249 for each person each year (you could start your own wine cellar with that). The money lost to corruption in Austria is also enough to buy 304 Big Macs for every Aus- trian each year, but we would not recommend eating almost a Big Mac a day. In total that would purchase over 2.6 billion Big Macs, which is quite a lot. PERCEPTIONS OF CORRUPTION IN AUSTRIA A 2017 Eurostat survey found that 26% of respondents in Austria believed that the level of corruption had worsened in the preceding 3 years, while 41% believed the level had remained the same. 22% believe the level of corruption had decreased. Indeed, 50% believe corruption is widespread in the country; and 50% believe corruption is part of the business culture of the country. Loss to GDP €10.4 billion 4%
- 10. XX8 THE COST OF CORRUPTION IN BELGIUM THE IMPACT OF CORRUPTION ON SOCIAL POLICIES This €21 billion annually lost to corruption in Belgium is almost 3 times the budget for the unemployed (around €7.8 billion). This figure is half the country’s healthcare budget (almost €43 billion) and more than half of what is spent on the elderly (around €38.5 billion). The money lost to corruption is 5 times bigger than the entire annual policing budget (around €4.3 billion); or, over 30 times the size of the budget for the fire service (€713 million). It is more than 30 times the housing budget (€713 million), and more than double the entire budget spent for families and children (€9.48 billion). The money lost to corruption in Belgium is almost 1.5 times the sickness and disability budget (almost €15 billion). Belgium loses more than 80% of the entire amount spent on education to corrup- tion (€25.8 billion). A hit to GDP of over €21 billion is lost each year in Belgium due to corruption. That’s around 6% of GDP. 7% of the population could get the average wage
- 11. 9 – Belgium – THE CONTEXT FOR INDIVIDUALS The amount of money lost to corruption in Belgium is enough to give around 806,000 peo- ple in the country (over 7% of the population) the average Belgian wage (€26,954 net per year in 2015; Belgium’s unemployment rate was 6.3% in April 2018). How does receiving €1,920 each year for free sound? Well, that is how much each person would get if the money lost to corruption were distributed among everyone in Belgium. If Belgium could spend the money it loses to corruption each year, it could buy over 12.5 billion bottles of beer, or 1,110 beers for each person in the country, every single year. Although Belgium is famous for its beer, we would not recommend drinking that much, as it’s more than three bottles of beer a day. It could also be used to purchase over 7.8 billion loaves of bread (691 for each person each year). This sum would also buy 486 Big Macs for every Belgian each year, but we would not recommend eating almost two Big Macs a day. In total, Belgium could purchase almost 5.5 billion Big Macs, which is quite a lot. PERCEPTIONS OF CORRUPTION IN BELGIUM A 2017 Eurostat survey found that 40% of respondents in Belgium believed that the level of corruption had worsened in the preceding 3 years, while 43% believed the level had remained the same. Only 13% believed the level of corruption had decreased. Indeed, 65% believe corruption is widespread in the country; and 63% believe corruption is part of the business culture of the country. 70% of respondents deem corruption unacceptable. Loss to GDP €21 billion 6%
- 12. XX10 THE COST OF CORRUPTION IN BULGARIA THE IMPACT OF CORRUPTION ON SOCIAL POLICIES The amount of money lost to corruption in Bulgaria is 1.8 times the entire social expenditure budget for the whole country, which is €6.1 billion. Breaking this down further, the €11 billion lost to corruption in Bulgaria is more than 360 times bigger than the whole budget for the unemployed (around €31 million). This figure is three times bigger than the national healthcare budget (almost €3.7 billion) and 2.4 times spending on the elderly (almost €4.5 billion). This figure is more than 20 times the size of the policing budget (around €518 mil- lion); or, over 76 times the size of the budget for the fire service (€145 million). The €11 billion lost to corruption in Bulgaria is more than 460 times the housing budget (€24 million). It is almost 10 times the size of the entire budget for family and children (€1.1 billion), and a whopping 110 times the national sickness and disabil- ity budget (almost €101 million). Bulgaria loses over 6 times the entire amount spent on education to corruption (€1.8 billion). A hit to GDP of over €11 billion is lost each year in Bulgaria due to corruption. That’s 14% of GDP. Triple the healthcare budget
- 13. 11 – Bulgaria – THE CONTEXT FOR INDIVIDUALS The amount of money annually lost to corruption in Bulgaria is enough to give around 2.5 million people in the country (more than a third of the population) the average Bulgarian wage (€4,334 net per year in 2015; Bulgaria’s unemployment rate was 5.1% in April 2018). How does receiving €1,561 each year for free sound? Well, that is how much each person would get if the money lost to corruption were distributed among everyone in Bulgaria. If Bulgaria could spend the money it loses to corruption each year, it could buy over 10.5 billion bottles of beer, or 1,472 beers for each person in the country, every single year. We would not recommend drinking that much, as it’s more than four bottles of beer a day. Each person could also receive 1,345 bottles of wine per year, which is well over three bot- tles a day. Turning to food items, the money lost to corruption in Bulgaria could be used to purchase over 15 billion 1kg loaves of bread (2198 for each person each year, over 6 kilos of bread a day). PERCEPTIONS OF CORRUPTION IN BULGARIA A 2017 Eurostat survey found that 48% of respondents in Bulgaria believed that the lev- el of corruption had worsened in the preceding 3 years, while 27% believed the level had remained the same. Only 4% believed the level of corruption had decreased. Indeed, 83% believe corruption is widespread in the country; and 76% believe corrup- tion is part of the business culture of the country. Loss to GDP €11 billion 14%
- 14. XX12 THE COST OF CORRUPTION IN CROATIA THE IMPACT OF CORRUPTION ON SOCIAL POLICIES This €8.5 billion is also more than 38 times bigger than the budget for the unem- ployed (around €220 million). This figure is more than 2.5 times bigger than the country’s entire annual health- care budget (over €3.2 billion) and it is more than double the spending on the elderly (almost €4 billion). The €8.5 billion lost to corruption in Croatia is more than 13 times bigger than the size of the whole policing budget (€648.5 million). It is almost 100 times the size of the budget for the fire service (€85 million). The money lost to corruption in Croatia is basically 1090 times bigger than the gov- ernment’s housing budget (€7.8 million). It is also more than 10 times larger than the entire budget for family and children (€822 million), and around 9 times the sickness and disability budget (around €939 million). A hit to GDP of over €8.5 billion is lost each year in Croatia due to corruption. That’s over 13.5% of GDP. 1090 times bigger than the housing budget
- 15. 13 – Croatia – THE CONTEXT FOR INDIVIDUALS This figure is enough to give around 961.510 people in the country (almost 23% of the population) the average annual Croatian wage (€8,842 net in 2015; Croatia’s unemployment rate was 9.1% in April 2018). How does receiving €2.029 each year for free sound? Well, that is how much each person would get if the money lost to corruption were distributed amongst everyone in Croatia. If Croatia could spend the money it loses to corruption each year, it could buy over 5 billion 1L bottles of beer, or 1.215 beers for each person in the country each year. We wouldn’t recommend drinking that much, as it’s more than 3 litres of beer a day. The money lost to corruption in Croatia could also be used to purchase over 5 billion 1kg loaves of bread, around 1276 for each person each year, which is almost 3.5 kilos of bread per day! PERCEPTIONS OF CORRUPTION IN CROATIA A 2017 Eurostat survey found that 58% of respondents in Croatia believed that the level of corruption had worsened in the preceding 3 years, while 33% believed the level had remained the same. Only 6% believed the level of corruption had de- creased. Indeed, a whopping 95% believe corruption is widespread in the country; and 75% believe corruption is part of the business culture of the country. Loss to GDP €8.5 billion 13.5%
- 16. XX14 THE COST OF CORRUPTION IN CYPRUS THE IMPACT OF CORRUPTION ON SOCIAL POLICIES The €2 billion lost to corruption in Cyprus is over 15 times the budget for the un- employed (around €139 million). This figure is around 1.8 times the country’s healthcare budget (almost €1.2 bil- lion) and more than 1.9 times the government spending on the elderly (almost €1.1 billion). The amount of money lost to corruption is more than 8 times bigger than the entire annual policing budget (€243 million); or, over 82 times bigger than the size of the budget for the fire service (€26 million). The €2 billion lost to corruption in Cyprus is 3.5 times bigger than the entire gov- ernment budget for family and children (€568 million), and more than 21 times larger than the sickness and disability budget (€99 million). Cyprus loses double the amount spent on education to corruption (nearly €1.08 billion). A hit to GDP of over €2 billion is lost each year in Cyprus due to corruption. That’s over 8% of GDP. 21 times the sickness & disability budget
- 17. 15 – Cyprus – THE CONTEXT FOR INDIVIDUALS How does receiving €2,537 each year for free sound? Well, that is how much each person would get if the money lost to corruption were distributed among everyone in Cyprus. If Cyprus could spend the money it loses to corruption each year, it could buy over 676 million 1L bottles of beer, or 798 litres of beers for each person in the country each year. We wouldn’t recommend drinking that much, as it’s over 2 bottles of beer a day. It could also be used to purchase almost 1.3 billion 1 kg loaves of bread. This is 1,450 for each person each year, nearly 4 kilos of bread a day! The €2 billion lost to corruption in Cyprus would be enough to purchase more than 464 million bottles of wine, which would mean each person in Cyprus could receive 548 bottles of wine every year. That’s around one and half bottles of wine a day - not recommendable for your liver. This sum would also buy 642 Big Macs for every Cypriot each year, but we would not rec- ommend eating almost two Big Macs a day. In total, one could purchase over 544 million Big Macs, which is quite a lot. PERCEPTIONS OF CORRUPTION IN CYPRUS A 2017 Eurostat survey found that 68% of respondents in Cyprus believed that the level of corruption had worsened in the preceding 3 years, while 17% believed the level had remained the same. Only 10% believed the level of corruption had decreased. Indeed, an incredible 94% believe corruption is widespread in the country; and 93% be- lieve corruption is part of the business culture of the country. Loss to GDP €2 billion 8%
- 18. XX16 THE COST OF CORRUPTION IN CZECH REPUBLIC THE IMPACT OF CORRUPTION ON SOCIAL POLICIES The €26.7 billion lost to corruption in the Czech Republic is almost 80 times bigger than the entire annual budget for the unemployed (around €337 million). This figure is more than double the country’s healthcare budget (€12.2 billion) and also more than double the amount of money spent on the elderly (around €13.1 billion). The money lost to corruption is more than 17 times the size of the entire annual policing budget (around €1.5 billion); or, over 62 times the size of the budget for the fire service (€430 million). This amount is almost 60 times bigger than the entire government budget spent on housing (€452 million), and over 14 times bigger than the whole annual budget for family and children (over €1.8 billion). The money lost to corruption in the Czech Republic is also 7 times bigger than the annual sickness and disability budget (around €3.7 billion). The Czech Republic loses more than 4 times the amount of money spent on educa- tion to corruption (€6 billion). A hit to GDP of over €26.7 billion is lost each year in the Czech Republic due to corruption. That’s more than 12% of GDP. 80 times bigger than the annual budget for the unemployed
- 19. 17 – Czech Republic – THE CONTEXT FOR INDIVIDUALS The €26.7 billion lost to corruption in the Czech Republic is enough to give almost 3 million people in the country (over 28% of the population) the average annual Czech wage (€8,941 net in 2015; the Czech Republic’s unemployment rate was 2.2% in April 2018). How does receiving €2,534 each year for free sound? Well, that is how much each person would get if the money lost to corruption were to be distributed amongst everybody in the Czech Re- public. If the Czech Republic could spend the money it loses to corruption each year, it could buy al- most 18 billion bottles of beer, or 1,700 beers for each person in the country each year. Al- though the Czechs are famous for their beer, we wouldn’t recommend drinking that much, as it’s more than four 1L bottles of beer a day. If you prefer wine, each person in the Czech Republic could get 1,236 bottles for free a year, over 3 bottles a day. The money lost to corruption in the Czech Republic could also be used to purchase over 31 billion loaves of bread (3,016 for each person each year, which is more than eight 1kg loaves of bread every single day). The €26.7 billion lost to corruption in the Czech Republic would also buy 815 Big Macs for each person each year, but we would not recommend eating more than two Big Macs a day. In total, the Czech Republic could purchase over 8.5 billion Big Macs, which is quite a lot. PERCEPTIONS OF CORRUPTION IN CZECH REPUBLIC A 2017 Eurostat survey found that 36% of respondents in the Czech Republic believed that the level of corruption had worsened in the preceding 3 years, while 49% believed the level had remained the same. Only 9% believed the level of corruption had decreased. 84% believe corruption is widespread in the country; and 77% believe corruption is part of the business culture of the country. Loss to GDP €26.7 billion 12%
- 20. XX18 THE COST OF CORRUPTION IN DENMARK THE IMPACT OF CORRUPTION ON SOCIAL POLICIES The €4 billion lost each year to corruption in Denmark is about 20% of the country’s healthcare budget (€28 billion) and almost 20% of spending on the elderly (around €23 billion). This figure is almost 3 times the size of the policing budget (€1.5 billion); or, almost 23 times the size of the budget for the fire service (€194 million). The money lost to corruption in Denmark is more than twice the size of the hous- ing budget (€1.9 billion), over a third of the budget for family and children (€12.5 billion), and again more than a third of the sickness and disability budget (almost €12.8 billion). This €4 billion is also around 65% of the budget for the unemployed (around €6.8 billion). A hit to GDP of over €4 billion is lost each year in Denmark due to corruption. That’s around 2% of GDP. Triple the size of the policing budget
- 21. 19 – Denmark – THE CONTEXT FOR INDIVIDUALS The €4 billion lost each year to corruption in Denmark is enough to give around 128,000 people in the country (around 2% of the population) the average annual Danish wage (€34,878 net in 2015; Denmark’s unemployment rate was 5.2% in April 2018). How does receiving €782 each year for free sound? Well, that is how much each person would get if the money lost to corruption were distributed amongst every- one in Denmark. The €4 billion sum would also buy 194 Big Macs for each Danish citizen each year, but we would not recommend eating that many in a year. In total, one could purchase over 1.1 billion Big Macs, which is quite a lot. PERCEPTIONS OF CORRUPTION IN DENMARK A 2017 Eurostat survey found that 36% of respondents in Denmark believed that the level of corruption had worsened in the preceding 3 years, while 51% believed the level had remained the same. Only 5% believed the level of corruption had decreased. Loss to GDP €4 billion 2%
- 22. XX20 THE COST OF CORRUPTION IN ESTONIA THE IMPACT OF CORRUPTION ON SOCIAL POLICIES The €1.6 billion lost to corruption in Estonia is around 6.5 times bigger than the entire annual budget for the unemployed (€246 million). This figure is 1.2 times bigger than the annual healthcare budget (almost €1.3 billion) and more than the entire amount spent to look after the elderly (over €1.5 billion). This figure is almost 8 times the size of the policing budget (€207 million) and more than 30 times the size of the budget for the fire service (€52 million). The €1.6 billion lost to corruption in Estonia is more than 320 times the housing budget (estimated at €5 million), more than triple the budget for family and chil- dren (€528 million), and over 3.5 times the sickness and disability budget (€465 million). Estonia loses almost 1.8 times the entire amount it spends on education because of corruption (€916 million). A hit to GDP of over €1.6 billion is lost each year in Estonia due to corruption. That’s around 8.2% of GDP More than triple the budget for family and children
- 23. 21 – Estonia – THE CONTEXT FOR INDIVIDUALS The amount of money lost to corruption in Estonia is enough to give around 153,598 people in the country (over 11% of the population) the average annual Estonian wage (€10,638 net in 2015; Estonia’s unemployment rate was 5.6% in April 2018). How does receiving €1,242 each year for free sound? Well, that is how much each person would get if the money lost to corruption were distributed between everyone in Estonia. If Estonia could spend the money it loses to corruption each year, then it could purchase over 413 million Big Macs, or 314 Big Macs for each person in Estonia every year, although we would not recommend eating almost a Big Mac a day. PERCEPTIONS OF CORRUPTION IN ESTONIA A 2017 Eurostat survey found that 23% of respondents in Estonia believed that the level of corruption had worsened in the preceding 3 years, while 35% believed the level had remained the same. Only 14% believed the level of corruption had decreased. Indeed, 67% believe corruption is widespread in the country; and 48% believe cor- ruption is part of the business culture of the country. Loss to GDP €1.6 billion 8.2%
- 24. XX22 THE COST OF CORRUPTION IN FINLAND THE IMPACT OF CORRUPTION ON SOCIAL POLICIES The over €3.9 billion annually lost to corruption in Finland is more than 70% of the entire annual budget for the unemployed (around €5.5 billion). This figure adds up to 20% of the country’s healthcare budget (€19.7 billion) and 13% of spending on the elderly (around €29.5 billion). The money lost to corruption in Finland is about 3.4 times the size of the policing budget (€1.16 billion); or, over 6 times the size of the budget for the fire service (€594 million). The €3.9 billion lost in Finland as a result of corruption is almost 3.7 times the en- tire annual housing budget (over €1 billion). This figure is also around 60% of the entire annual budget for family and children (over €6.8 billion), and more than half of the sickness and disability budget (almost €7.4 billion). Almost one third of the figure spent on education is lost to corruption in Finland (€13.9 billion). A hit to GDP of over €3.9 billion is lost each year in Finland due to corruption. That’s around 2.5% of GDP. Enough to give 133,000 people the average annual Finnish wage
- 25. 23 – Finland – THE CONTEXT FOR INDIVIDUALS The amount of money lost to corruption in Finland is enough to give around 133,000 people in the country (over 2.4% of the population) the average annual Finnish wage (€29,981 net in 2015; Finland’s unemployment rate was 8.1% in April 2018). How does receiving €727 each year for free sound? Well, that is how much each person would get if the money lost to corruption were to be distributed among everybody in Finland. If Finland could spend the money it loses to corruption each year, it could purchase over 1 billion 1kg loaves of bread, which is 187 kilos of bread for each person each year, which is almost half a kilo of bread per person per day. This sum would also buy 184 Big Macs for each Finnish individual each year, but we would not recommend eating that many Big Macs (that’s one every other day!). With the money lost to corruption in Finland, more than 1 billion Big Macs in total could be bought every year. PERCEPTIONS OF CORRUPTION IN FINLAND A 2017 Eurostat survey found that 29% of respondents in Finland believed that the level of corruption had worsened in the preceding 3 years, while 50% believed the level had remained the same. Only 11% believed the level of corruption had decreased. Only 21% believe corruption is widespread in the country; and 28% that corruption is part of the business culture of the country. 84% of respondents deem corruption unac- ceptable. Loss to GDP €3.9 billion 2.5%
- 26. XX24 THE COST OF CORRUPTION IN FRANCE THE IMPACT OF CORRUPTION ON SOCIAL POLICIES The €120 billion annually lost to corruption in France is around 2.7 times the bud- get for the unemployed (around €44 billion). This money lost to corruption in France is around half the country’s healthcare budget (over €241 billion) and around 40% of the amount spent by the govern- ment to look after the elderly (almost €302 billion). This figure is almost 6 times the size of the entire policing budget (almost €21 bil- lion); or, 20 times the size of the budget for the fire service (€6 billion). The €120 billion lost annually to corruption in France is more than 5.5 times the full housing budget (€21.5 billion), more than double the size of the budget for family and children (€53 billion), and almost twice the size of the sickness and disability budget (around €61.7 billion). The amount of money that France loses because of corruption is the same as its entire education budget (€118.4 billion). A hit to GDP of over €120 billion is lost each year in France due to corruption. That’s over 6% of GDP. The same as the entire education budget
- 27. 25 – France – THE CONTEXT FOR INDIVIDUALS The €120 billion annually lost to corruption in France is enough to give nearly 4.5 mil- lion people in the country (over 6.7% of the population) the average annual French wage (€26,775 net in 2015; France’s unemployment rate was 9.2% in April 2018). How does receiving €1,801 each year for free sound? Well, that is how much each person would get if the money lost to corruption were distributed amongst everyone in France. If France could spend the money it loses to corruption each year, it could buy over 30.4 billion Big Macs, which is 456 per person each year (more than we’d recommend eating in a year). Turning to wine, over 38 billion bottles could be purchased with the amount of money lost to corruption each year, which is 579 bottles of wine per person, or more than 1.5 bottles of wine per day! PERCEPTIONS OF CORRUPTION IN FRANCE A 2017 Eurostat survey found that 42% of respondents in France believed that the level of corruption had worsened in the preceding 3 years, while 40% believed the level had remained the same. Only 4% believed the level of corruption had decreased. Indeed, 67% believe corruption is widespread in the country; and 58% believe corruption is part of the business culture of the country. 78% of respondents deem corruption unacceptable. Loss to GDP €120 billion 6%
- 28. XX26 THE COST OF CORRUPTION IN GERMANY THE IMPACT OF CORRUPTION ON SOCIAL POLICIES The €104 billion lost to corruption every year in German is twice the size of the entire annual budget for the unemployed (almost €52 billion). This figure is almost a third of the country’s healthcare budget (€338 billion) and more than a third of spending on the elderly (€290 billion). The amount of money lost to corruption in Germany is more than 4 times bigger than the size of the entire annual policing budget (almost €24 billion). Plus it is almost 14 times the size of the entire budget for the fire service (€7.5 billion). The money lost to corruption in Germany is a whopping 10 times the size of the housing budget (€10 billion). Double the amount of money spent on family and children (€52 billion) is lost to corruption in Germany. With the money lost to corruption in Germany, we could double the entire yearly sickness and disability budget (currently €101 billion). Germany loses more than 75% of the figure spent on education to corruption (€135 billion). A hit to GDP of over €104 billion is lost each year in Germany due to corruption. That’s around 4% of GDP. Twice the size of the annual budget for the unemployed
- 29. 27 – Germany – THE CONTEXT FOR INDIVIDUALS The €104 billion lost to corruption in Germany is enough to give more than 3.7 million people in the country the average annual German wage (€28,268 net in 2015). This is around 4.5 % of the population (Germany’s unemployment rate was 3.4% in April 2018). How does receiving €1,276 each year for free sound? Well, that is how much each person would get if the money lost to corruption were distributed among everyone in Germany. If Germany could spend the money it loses to corruption each year, it could buy over 64 billion 1L bottles of beer, or 778 litres of beer for each person in the country each year, which is more than 2 bottles of beer a day. This sum would also buy more than 26.5 billion Big Macs, which is 323 Big Macs for each German citizen each year, though we would of course not recommend eating a Big Mac almost every single day. PERCEPTIONS OF CORRUPTION IN GERMANY A 2017 Eurostat survey found that 36% of respondents in Germany believed that the level of corruption had worsened in the preceding 3 years, while 36% believed the level had remained the same. Only 6% believe the level of corruption had decreased. Indeed, 51% believe corruption is widespread in the country; and 50% believe corrup- tion is part of the business culture of the country. Loss to GDP €104 billion 4%
- 30. XX28 THE COST OF CORRUPTION IN GREECE THE IMPACT OF CORRUPTION ON SOCIAL POLICIES The €34 billion annually lost to corruption in Greece is also 40 times the budget for the unemployed (€853 million). This figure is more than double the country’s healthcare budget (€14.7 billion) and bigger than the amount of government spending on the elderly (€27.8 billion). This figure is over 13 times the size of the policing budget (almost €2.5 billion); or, over 66 times the size of the budget for the fire service (€510 million). The €34 billion annually lost to corruption in Greece is over 1000 times the housing budget (€33 million), almost 31 times the budget for family and children (€1.1 bil- lion), and around 13 times the sickness and disability budget (almost €2.6 billion). Indeed, the €34 billion lost to corruption in Greece is almost the entire budget for social expenditure (€35.9 billion). A hit to GDP of over €34 billion is lost each year in Greece due to corruption. That’s almost 14% of GDP. 96% of respondents believe corruption is widespread in the country
- 31. 29 – Greece – THE CONTEXT FOR INDIVIDUALS The €34 billion annually lost to corruption in Greece is enough to give around 2.2 million people in the country (almost 21% of the population) the average annual Greek wage (€15,234 net in 2015; Greece’s unemployment rate was 20.8% in April 2018). How does receiving €3,168 each year for free sound? Well, that is how much each person would get if the money lost to corruption were distributed among Greek individuals. If Greece could spend the money it loses to corruption each year, it could buy over 8.6 billion Big Macs, or 802 for each person in the country each year, al- though we wouldn’t recommend eating that many. PERCEPTIONS OF CORRUPTION IN GREECE A 2017 Eurostat survey found that 40% of respondents in Greece believed that the level of corruption had worsened in the preceding 3 years, while 42% be- lieved the level had remained the same. Only 13% believed the level of corruption had decreased. Indeed, an incredible 96% believe corruption is widespread in the country; and 84% believe corruption is part of the business culture of the country. Loss to GDP €34 billion 14%
- 32. THE COST OF CORRUPTION IN HUNGARY THE IMPACT OF CORRUPTION ON SOCIAL POLICIES The €20 billion annually lost to corruption in Hungary is almost 59 times the size of the entire budget for the unemployed (€341 million). This amount is 2.5 times the country’s annual healthcare budget (€7.9 billion) and al- most 2.5 times the amount spent by the government on the elderly (over €8.1 billion). This €20 billion is over 14 times the size of the police budget (€1.4 billion); or, more than 71 times the size of the budget for the fire service (€281 million). The money lost to corruption in Hungary is more than 107 times bigger than the entire housing budget (€186 million) and it is almost 9.5 times the budget for family and chil- dren (€2.1 billion). This €20 billion is also around 6.5 times greater than the sickness and disability budget (over €3.1 billion). The amount of money lost to corruption in Hungary is almost 5 times the amount of mon- ey the government spends on education (over €4 billion). Indeed, the money lost to corruption in Hungary is more than the entire social expendi- ture budget (€16.3 billion). THE CONTEXT FOR INDIVIDUALS The €20 billion lost to corruption in Hungary is enough to give around 2.9 million peo- ple in the country (over 30% of the population) the average annual Hungarian wage (€6,702 net in 2015; Hungary’s unemployment rate was 3.7% in April 2018). How does receiving €2,044 each year for free sound? Well, that is how much each person would get if the money lost to corruption were distributed equally amongst everyone in Hungary. If Hungary could spend the money it loses to corruption each year, it could buy over 16.3 billion 1L bottles of beer, which is the same as buying 1,662 beers for each person in the country each year. We wouldn’t recommend drinking that much, as it’s more than 4.5 litres of beer a day. A hit to GDP of €20 billion is lost each year in Hungary due to corruption. That’s over 11% of GDP. 30
- 33. THE CONTEXT FOR INDIVIDUALS (continuation) The money lost to corruption in Hungary could also be used to purchase over 22 billion loaves of bread (2,322 for each person each year, or over 6 loaves each day). And if you wanted to start your own wine cellar, you could, as it could purchase over 27 billion bottles of red wine, which would be 2,762 bottles of wine for each person each year - or more than 7.5 bottles a day, which we really would not recommend drinking. This sum would also buy over 7 billion Big Macs, which is 730 Big Macs for every person in Hungary every year - not exactly a healthy diet. PERCEPTIONS OF CORRUPTION IN HUNGARY A 2017 Eurostat survey found that 58% of respondents in Hungary believed that the level of corruption had worsened in the preceding 3 years, while 33% believed the level had remained the same. Only 4% believed the level of corruption had decreased. Indeed, 86% believe corruption is widespread in the country; and 76% believe corrup- tion is part of the business culture of the country. – Hungary – 2.9 million people could get the average annual wage 31 Loss to GDP €20 billion 11%
- 34. XX32 THE COST OF CORRUPTION IN IRELAND THE IMPACT OF CORRUPTION ON SOCIAL POLICIES The €5.4 billion lost to corruption in Ireland is also around 1.5 times the budget for the unemployed (around €3.4 billion). The amount of money lost to corruption is almost 30% of Ireland’s healthcare bud- get (€19.8 billion) and more than half the amount spent on the elderly (over €9.6 billion). This figure is over 3 times the size of the policing budget (over €1.6 billion). It is also a staggering 28 times the size of the budget for the fire service (€196 million). In light of the housing crisis in Ireland, it is incredible to think that the amount of money lost to corruption in Ireland is more than 2.5 times the entire housing bud- get (€2 billion). The €5.4 billion lost to corruption is roughly 1.4 times the budget for family and children (€3.8 billion), and bigger than the entire sickness and disability budget (almost €5.1 billion). Ireland loses more than half the amount the government spends on education to corruption (€9.5 billion). Around 20% of the amount spent to cover the entire social expenditure budget (€27 billion) is lost because of corruption in Ireland. A hit to GDP of over €5.4 billion is lost each year in Ireland due to corruption. That’s around 4% of GDP. 2.5 times the entire housing budget
- 35. 33 – Ireland – THE CONTEXT FOR INDIVIDUALS This figure is enough to give over 196,000 people in the country (over 4% of the population) the average annual Irish wage (€27,906 net in 2015; Ireland’s unem- ployment rate was 5.9% in April 2018). How does receiving €1,159 each year for free sound? Well, that is how much each person would get if the money lost to corruption were distributed among every person in Ireland. If Ireland could spend the money it loses to corruption each year, they could buy over 1.3 billion Big Macs, or 293 for each person in the country per year (not something we would recommend however)! PERCEPTIONS OF CORRUPTION IN IRELAND A 2017 Eurostat survey found that 68% of people in Ireland believe corruption is widespread in the country; and 65% believe corruption is part of the busi- ness culture of the country. Loss to GDP €5.4 billion 4%
- 36. XX34 THE COST OF CORRUPTION IN ITALY THE IMPACT OF CORRUPTION ON SOCIAL POLICIES The €237 billion annually lost to corruption in Italy is 12 times bigger than the whole budget for the unemployed (around €19.7 billion). This figure is 1.6 times the size of the country’s healthcare budget (€148 billion) and more than the entire budget spent to look after the elderly (€227 billion). The money lost to corruption in Italy is more than 12 times bigger than the entire an- nual policing budget (€19.4 billion), and almost 77 times the size of the budget for the fire service (€3 billion). It is astoundingly 337 times bigger than what the government spends on housing (€701 million). With the money lost to corruption every year, Italy could more than triple the govern- ment spending on education (education budget €66 billion), and it would still have €39 billion left over. THE CONTEXT FOR INDIVIDUALS The €237 billion lost each year in Italy due to corruption is enough to give over 11.2 million people in the country (or over 18% of the population) the average Italian wage (€21,114 net per year in 2015. Italy’s April 2018 unemployment rate was 11.2%.) If the amount of money lost to corruption were to be distributed evenly between every- one in Italy, each person would receive €3,903 every single year! If Italy could spend the money it loses to corruption each year, it could buy over 133 billion 1L bottles of beer, or 2,193 beers for each person in the country. Not that we’d recommend drinking that much, but that’s more than 6 litres of beer a day. A hit to GDP of almost €237 billion is lost each year in Italy due to corruption. That’s around 13% of GDP. Each person could receive € 3,903 every year
- 37. 35 – Italy – THE CONTEXT FOR INDIVIDUALS (continuation) Would you like 2,380 bottles of wine for free each year? Well that’s how much wine could be bought with the money Italy loses to corruption. At least 6.5 bottles of wine a day! You could also purchase 1,360 loaves of bread (weighing 1 kilo each) for every person in Italy each year, which is well over three kilos of bread per person per day. Way more than one could ever need as part of a balanced diet. This sum would also buy 988 Big Mac’s for every Italian each year, which would be more than two a day (we definitely don’t recom- mend eating that many!). PERCEPTIONS OF CORRUPTION IN ITALY A 2017 Eurostat survey found that 55% of respondents in Italy believed that the level of corruption had worsened in the preceding 3 years, while 30% believed the level had remained the same. Only 4% believe corruption had decreased. Indeed, 89% of people believe corruption is widespread in the country; and 84% be- lieve corruption is part of the business culture of the country. In a sign of the desire for change however, 79% of respondents deem corruption unacceptable. Loss to GDP €237 billion 13%
- 38. XX36 THE COST OF CORRUPTION IN LATVIA THE IMPACT OF CORRUPTION ON SOCIAL POLICIES The €3.4 billion annually lost to corruption in Latvia is more than 26 times bigger than the budget for the unemployed (around €132 million). This figure is about two and half times the country’s healthcare budget (around €1.3 billion) and almost double spending on the elderly (almost €1.8 billion). The money lost to corruption in Latvia is almost 12 times the size of the entire policing budget (€292 million); or, over 63 times the size of the budget for the fire service (€55 million). The €3.4 billion annually lost to corruption in Latvia is about 125 times the govern- ment’s housing budget (€28 million), around 11 and a half times the budget for family and children (€303 million). It is also more than 6 times the sickness and disability budget (almost €548 million). The amount of money lost to corruption in Latvia is more than two and half times the size of the entire education budget (€1.2 billion). A hit to GDP of over €3.4 billion is lost each year in Latvia due to corruption. That’s around 13% of GDP. 125 times the housing budget
- 39. 37 – Latvia – THE CONTEXT FOR INDIVIDUALS The €3.4 billion annually lost to corruption in Latvia is enough to give over 512,000 people in the country (over 26% of the population) the average annual Latvian wage (€6,815 net in 2015; Latvia’s unemployment rate was 7.4% in April 2018). How does receiving €1,773 each year for free sound? Well, that is how much each person would get if the money lost to corruption were distributed amongst everyone in Latvia. If Latvia could spend the money it loses to corruption each year, it could buy over 883 mil- lion Big Macs, or 449 per person each year, which is more than one burger a day, though we wouldn’t recommend eating that many Big Macs in a year. PERCEPTIONS OF CORRUPTION IN LATVIA A 2017 Eurostat survey found that 32% of respondents in Latvia believed that the level of corruption had worsened in the preceding 3 years, while 43% believed the level had remained the same. Only 14% believed the level of corruption had decreased. Indeed, 84% believe corruption is widespread in the country; and 52% believe corruption is part of the business culture of the country. What’s more, 28% of respondents say they personally know someone who takes or has taken bribes. Only 34% of respondents deem corruption unacceptable. Loss to GDP €3.4 billion 13%
- 40. XX38 THE COST OF CORRUPTION IN LITHUANIA THE IMPACT OF CORRUPTION ON SOCIAL POLICIES The €4.4 billion annually lost to corruption in Lithuania is also more than 23 times the budget for the unemployed (around €193 million). This figure is around 1.8 times the country’s healthcare budget (over €2.4 billion) and almost double the amount spent on the elderly (over €2.2 billion). The amount lost to corruption in Lithuania is also more than 21 times the size of the policing budget (€213 million); or, over 52 times the size of the budget for the fire service (€85 million). It is about 224 times bigger than the entire annual housing budget (€20 million), over 11 times the budget for family and children (€393 million), and well over three times the size of the sickness and disability budget (€1.2 billion). Indeed, the amount of money lost to corruption in Lithuania is the same size as the entire social expenditure budget (€4.3 billion). Lithuania’s loss to corruption is 2.8 times the size of the full government budget for education (almost €1.6 billion). THE CONTEXT FOR INDIVIDUALS The €4.4 billion annually lost to corruption in Lithuania is enough to give around 675,000 people in the country (over 23% of the population) the average annual Lithu- anian wage (€6,652 net in 2015; Lithuania’s unemployment rate was 6.9% in April 2018). How does receiving €1,555 each year for free sound? Well, that is how much each person would get if the money lost to corruption were to be distributed amongst everyone in Lithuania. A hit to GDP of over €4.4 billion is lost each year in Lithuania due to corruption. That’s over 11% of GDP. 34% of respondents know someone who has taken a bribe
- 41. 39 – Lithuania – THE CONTEXT FOR INDIVIDUALS (continuation) If Lithuania could spend the money it loses to corruption each year, it could buy over 3.1 billion 1L bottles of beer, or 1,095 beers for each person in the country each year. We wouldn’t recommend drinking that much, as it’s 3 litres of beer a day. The money lost to corruption in Lithuania is also enough to purchase over 2.7 billion 1kg loaves of bread (966 for each person each year or more than two and a half kilos a day). If you fancy starting your own wine cellar, then the 957 million bottles of red wine that could be purchased would give each Lithuanian individual 332 bottles each year. This sum would also buy over 1 billion Big Macs, which is 394 Big Macs for every Lithu- anian each year, but we would not recommend eating this much - it’s more than one Big Mac every day. PERCEPTIONS OF CORRUPTION IN LITHUANIA A 2017 Eurostat survey found that 32% of respondents in Lithuania believed that the level of corruption had worsened in the preceding 3 years, while 42% believed the level had remained the same. 20% believed the level of corruption had decreased. 93% believe corruption is widespread in the country; and 67% believe corruption is part of the business culture of the country. 34% of respondents say they personally know someone who takes or has taken a bribe. Loss to GDP €4.4 billion 11%
- 42. XX40 THE COST OF CORRUPTION IN LUXEMBOURG THE IMPACT OF CORRUPTION ON SOCIAL POLICIES The €687 million annually lost to corruption in Luxembourg is around 1.2 times the entire budget for the unemployed (around €570 million). This figure is around a fifth of the country’s healthcare budget (almost €3.1 bil- lion) and around 12% of the total spending on the elderly (almost €5.7 billion). This €687 million is about 2.75 times the size of the policing budget (almost €250 million); or, over 11.5 times the size of the budget for the fire service (€60 million). It is almost 24 times the housing budget (€29 million), around a third of the budget for family and children (€1.9 billion), and around 70% of the entire annual sickness and disability budget (almost €963 million). Luxembourg loses almost a third of the figure spent on education to corruption (€2 billion). A hit to GDP of over €687 million is lost each year in Luxembourg due to corruption. That’s around 2% of GDP. 17,800 people could receive the average annual wage
- 43. 41 – Luxembourg – THE CONTEXT FOR INDIVIDUALS The amount lost to corruption in Luxembourg is enough to give around 17,800 people in the country (more than 3% of the population) the average annual Luxembourgish wage (€38,631 net in 2015; Luxembourg’s unemployment rate was 5.3% in April 2018). How does receiving €1,193 each year for free sound? Well, that is how much each person would get if the money lost to corruption were to be distributed amongst everyone in Luxembourg. If Luxembourg could spend the money it loses to corruption each year, it could buy over 267 million 1L bottles of beer, or 464 beers for each person in the country. We wouldn’t recom- mend drinking that much, as it’s more than 1 litre of beer a day. The money lost to corruption in Luxembourg could also be used to purchase over 174 million 1kg loaves of bread (301 for each person each year). And if you fancy starting your own wine cellar, the 118 plus million bottles of red wine that could be purchased would give each Luxem- bourgish individual 205 bottles of wine every year. The sum would also buy 174 million Big Macs, although we would not recommend eating 302 Big Macs each year. PERCEPTIONS OF CORRUPTION IN LUXEMBOURG A 2017 Eurostat survey found that 23% of respondents in Luxembourg believed that the level of corruption had worsened in the preceding 3 years, while 43% believed the level had remained the same. Only 5% believed the level of corruption had decreased. 40% believe corruption is widespread in the country; and 35% believe corruption is part of the business culture of the country. 18% of respondents personally know someone who takes or has taken bribes. 76% of respondents deem corruption unacceptable. Loss to GDP €687 million 2%
- 44. XX42 THE COST OF CORRUPTION IN MALTA THE IMPACT OF CORRUPTION ON SOCIAL POLICIES The €725 million annually lost to corruption in Malta is more than 20 times the budget for the unemployed (€36 million). It is also almost the entire budget for the elderly (€735 million). This figure is more than 10 times the size of the policing budget (€67 million). The money lost to corruption in Malta is more than 90 times the total amount spent on the fire service (€8 million). It is over 45 times bigger than the entire housing budget (€16 million), over 7 times the national budget for family and children (€102 million), and almost 7 times the entire sickness and disability budget (almost €108 million). Malta loses more money to corruption than the entire amount spent on education (total €510 million). Overall, around 65% of the size of the entire social expenditure budget (of €1.1 bil- lion) is completely lost due to corruption. THE CONTEXT FOR INDIVIDUALS The €725 million annually lost to corruption in Malta is enough to give roughly 42,900 people in the country (over 9% of the population) the average annual Mal- tese wage (€16,924 net in 2015; Malta’s unemployment rate was 3% in April 2018). How does receiving €1,671 each year for free sound? Well, that is how much each person would get if the money lost to corruption were distributed among everyone in Malta. A hit to GDP of over €725 million is lost each year in Malta due to corruption. That’s around 8.65% of GDP. Over 7 times the national budget for family and children
- 45. 43 – Malta – THE CONTEXT FOR INDIVIDUALS (continuation) If Malta could spend the money it loses to corruption each year, it could buy over 273 million 1L bottles of beer, or 631 litres of beer for each person in the country each year, which is around 1.7 litres per day. It could also be used to purchase over 345 million 1kg loaves of bread (796 for each person each year or over 2 kilos worth of bread a day). If you wanted to start your own wine cellar, the over 340 million bottles of red wine that could be purchased each year would give each Maltese individual 785 bottles a year. Although not particularly healthy, 172 million Big Macs could be purchased with this sum, which translates into 398 for each person annually, more than 1 a day. PERCEPTIONS OF CORRUPTION IN MALTA A 2017 Eurostat survey found that 54% of respondents in Malta believed that the level of corruption had worsened in the preceding 3 years, while 23% believed the level had remained the same. Only 11% believed the level of corruption had decreased. Indeed, 79% believe corruption is widespread in the country; and 66% believe cor- ruption is part of the business culture of the country. 10% of respondents personally know someone who takes or has taken bribes. 83% of respondents deem corruption unacceptable. Loss to GDP €725 million 8.65%
- 46. XX44 THE COST OF CORRUPTION IN THE NETHERLANDS THE IMPACT OF CORRUPTION ON SOCIAL POLICIES The €4.4 billion annually lost to corruption in the Netherlands is almost 40% of the total annual budget for the unemployed (around €11.2 billion). This figure is about 75% the size of the policing budget (€5.8 billion); or, over 2.7 times the size of the budget for the fire service (€1.6 billion). The money lost to corruption in the Netherlands is 1.3 times the housing budget (€3.4 billion), and around half the budget for family and children (€8.5 billion). It’s also around 10% of the entire budget for looking after the elderly (€47 billion). THE CONTEXT FOR INDIVIDUALS The €4.4 billion annually lost to corruption in the Netherlands is enough to give 126,899 people in the country (0.75 % of the population) the average annual Dutch wage (€34,826 net in 2015; the Netherland’s unemployment rate was 3.9% in April 2018). How does receiving €260 each year for free sound? Well, that is how much each person would get if the money lost to corruption were to be distributed amongst everyone in the Netherlands. If the Netherlands could spend the money it loses to corruption each year, it could buy over 2.7 million bottles of beer, or 160 beers for each person in the country each year. It could also be used to purchase over 2.7 billion loaves of bread (160 for each person each year) and more than 1.4 billion bottles of red wine (86 per person each year). This sum would also buy 66 Big Macs for each person in the Netherlands every year. A hit to GDP of over €4.4 billion is lost each year in the Netherlands due to corruption. That’s around 0.76% of GDP.
- 47. Only 7% believed the level of corruption had decreased 45 – The Netherlands – PERCEPTIONS OF CORRUPTION IN THE NETHERLANDS A 2017 Eurostat survey found that 39% of respondents in the Netherlands believed that the level of corruption had worsened in the preceding 3 years, while 48% believed the level had remained the same. Only 7% believed the level of corruption had decreased. Indeed, 44% believe corruption is widespread in the country; and 35% believe corrup- tion is part of the business culture of the country. 73% of respondents deem corruption unacceptable. Loss to GDP €4.4 billion 0.76%
- 48. XX46 THE COST OF CORRUPTION IN POLAND THE IMPACT OF CORRUPTION ON SOCIAL POLICIES The €65.7 billion annually lost to corruption in Poland is over 29 times the budget for the unemployed (around €2.3 billion). This amount is almost two and a half times the country’s healthcare budget (almost €27 billion) and one and a half times spending on the elderly (€38.9 billion). The money lost to corruption in Poland is more than 13 times bigger than the size of the entire annual policing budget (almost €4.9 billion); or, over 84 times the size of the budget for the fire service (€784 million). The €65.7 billion lost to corruption in Poland is a whopping 340 times bigger than the yearly housing budget (€193 million). It is also 6 times bigger than the amount spent by the government for families and children (€10.6 million), and about 6 times larger than the sickness and disability budget (almost €11.2 billion). Poland spends circa €20.2 billion on education, meaning the figure lost to corruption is three times as big. In total, practically double the entire social expenditure budget is lost to corruption every year. THE CONTEXT FOR INDIVIDUALS The €65.7 billion annually lost to corruption in Poland is enough to give around 7.3 million people in the country (around 19% of the population) the average annual Pol- ish wage (€8,967 net in 2015; Poland’s unemployment rate was 3.8% in April 2018). How does receiving €1,732 each year for free sound? Well, that is how much each person would get if the money lost to corruption were distributed among everyone in Poland. A hit to GDP of over €65.7 billion is lost each year in Poland due to corruption. That’s around 12.6% of GDP. 340 times bigger than the yearly housing budget
- 49. 47 – Poland – THE CONTEXT FOR INDIVIDUALS (continuation) If Poland could spend the money it loses to corruption each year, it could buy over 51 bil- lion bottles of beer, which is 1,353 beers for each person in the country each year. While Poland may be famous for its beer, we wouldn’t recommend drinking that much, as it’s al- most 4 1L bottles of beer a day. It could also be used to purchase over 62 billion 1 kg loaves of bread, which is 1,649 kilos for each person each year, or 4.5 kilos of bread a day! Should you wish to start your own wine cellar, the 15 billion bottles of wine that could be purchased would give each person in the country 391 bottles a year, which is more than a bottle a day (not recommended!). The amount of money lost to corruption in Poland would also buy 716 Big Macs for each Polish individual each year, but we would not recommend eating almost two Big Macs a day. In total, one could purchase over 27 billion Big Macs, which is really quite a lot. PERCEPTIONS OF CORRUPTION IN POLAND A 2017 Eurostat survey found that 15% of respondents in Poland believed that the level of corruption had worsened in the preceding 3 years, while 39% believed the level had remained the same. 29% believed the level of corruption had decreased. 58% of respondents believe corruption is widespread in the country; and 62% believe corruption is part of the business culture of the country. 64% of respondents deem cor- ruption unacceptable. Loss to GDP €65.7 billion 12.6%
- 50. XX48 THE COST OF CORRUPTION IN PORTUGAL THE IMPACT OF CORRUPTION ON SOCIAL POLICIES The €18.2 billion annually lost to corruption in Portugal is over 10 times the budget for the unemployed (around €1.8 billion). This figure is bigger than the country’s entire annual healthcare budget (€16.1 bil- lion) and is around 80% of the amount spent by the government each year to look after the elderly (around €22.4 billion). The money lost to corruption in Portugal every year is more than 9 times the size of the policing budget (almost €1.9 billion); or, over 72 times the size of the budget for the fire service (€251 million). The €18.2 billion annually lost to corruption in Portugal is more than 314 times bigger than the government’s housing budget (€58 million). It is also more than 9 times the budget for family and children (€1.9 billion), and over 7 times the sick- ness and disability budget (around €2.4 billion). More than double the amount spent on education in Portugal (€8.7 billion) is lost every year because of corruption. The €18.2 billion annually lost to corruption in Portugal is more than half of the entire social expenditure budget. A hit to GDP of over €18.2 billion is lost each year in Portugal due to corruption. That’s around 7.9% of GDP. 72 times the budget for the fire service
- 51. 49 – Portugal – THE CONTEXT FOR INDIVIDUALS The €18.2 billion annually lost to corruption in Portugal is enough to give around 1.5 million people in the country (over 14% of the population) the average annual Por- tuguese wage (€26,954 net in 2015; Portugal’s unemployment rate was 7.4% in April 2018). How does receiving €1,763 each year for free sound? Well, that is how much each per- son would get if the money lost to corruption were to be distributed amongst everyone in Portugal. The €18.2 billion annually lost to corruption in Portugal would also buy 446 Big Macs for each person in Portugal individual each year, but we would not recommend eating more than one Big Mac a day! PERCEPTIONS OF CORRUPTION IN PORTUGAL A 2017 Eurostat survey found that 54% of respondents in Portugal believed that the level of corruption had worsened in the preceding 3 years, while 29% believed the level had remained the same. Only 4% believed the level of corruption had decreased. Indeed, 92% believe corruption is widespread in the country; and 79% believe corrup- tion is part of the business culture of the country. 84% of respondents deem corruption unacceptable. Loss to GDP €18.2 billion 7.9%
- 52. XX50 THE COST OF CORRUPTION IN ROMANIA THE IMPACT OF CORRUPTION ON SOCIAL POLICIES This €38.6 billion annually lost to corruption in Romania is also more than 187 times bigger than the entire annual budget for the unemployed (around €206 million). This figure is almost 5 times the country’s healthcare budget (almost €7.9 billion) and more than double the amount spent on the elderly (€13.8 billion). This figure is over 21 times the size of the policing budget (€1.6 billion); or, over 86 times the size of the budget for the fire service (€713 million). It is an incredible 2,968 times the size of the housing budget (about €12 million), and around 16 times the budget for family and children (€2.2 billion). The money lost to corruption in Romania is around 20 times the sickness and disability budget (almost €1.7 billion). Romania spends €4.1 billion on education, which means the money lost to corruption is almost 9 times more than that. Indeed, the money lost to corruption is almost twice the size of total social expenditure (€19 billion). THE CONTEXT FOR INDIVIDUALS The €38.6 billion annually lost due to corruption in Romania is enough to give around over 5.4 million people in the country (around 27% of the population) the average Ro- manian wage (€7,114 net per year according to the most recent data from the Romanian institute for statistics; Romania’s unemployment rate was 4.6% in April 2018). How does receiving €1,954 each year for free sound? Well, that is how much each person would get if the money lost to corruption were to be distributed equally among everyone in Romania. If we divide the amount of money lost to corruption between all the newborn babies in a given year, each baby could receive more than €203,000! A hit to GDP of over €38.6 billion is lost each year in Romania due to corruption. That’s around 15.6% of GDP.
- 53. 68% of respondents personally affected by corruption in their daily lives 51 – Romania – THE CONTEXT FOR INDIVIDUALS (continuation) If Romania could spend the money it loses to corruption each year, it could buy more than 24 billion bottles of beer, which is 1,237 1L beers for each person in the country each year - that’s more than 3 litres of beer a day. With the money lost to corruption in Romania, over 39 billion loaves of bread could be purchased. This is 1,994 1kg loaves of bread for each person each year, or more than 5 kilos of bread per day! If Romania were to spend all the money lost to corruption on red wine, that would buy more than 15.3 billion bottles. That’s 779 bottles per person each year, which is more than 2 bottles of wine per person a day. PERCEPTIONS OF CORRUPTION IN ROMANIA Clearly, corruption is a priority for Romanians, as 68% of respondents recognise they are personally affected by corruption in their daily lives. Over the past three years, 46% of people in Romania say they think corruption has increased. 37% responded that it had stayed the same, and only 10% thought that corruption had decreased. Loss to GDP €38.6 billion 15.6%
- 54. XX52 THE COST OF CORRUPTION IN SLOVAKIA THE IMPACT OF CORRUPTION ON SOCIAL POLICIES The €11 billion annually lost to corruption in Slovakia is around 61 times bigger than the entire annual budget for the unemployed (around €178 million). This figure is more than double the country’s healthcare budget (€5.4 billion) and more than one and a half times spending on the elderly (about €6.6 billion). This figure is almost 13 times the size of the policing budget (almost €855 million); or, more than 78 times the size of the budget for the fire service (€140 million). The €11 billion annually lost to corruption in Slovakia is 10 times the budget for fam- ily and children (€1 billion), and more than 4.5 times the size of the entire annual sickness and disability budget (almost €2.3 billion). Slovakia spends €3.1 billion on education, which is 3.5 times less than the figure lost to corruption. Indeed the money lost to corruption totals about 90% of the entire annual budget for social policies. THE CONTEXT FOR INDIVIDUALS The €11 billion annually lost to corruption in Slovakia is enough to give around 1.3 million people in the country (about 25% of the population) the average annual Slova- kian wage (€8,201 net in 2015; Slovakia’s unemployment rate was 7.4% in April 2018). How does receiving €2,017 each year for free sound? Well, that is how much each person would get if the money lost to corruption were distributed among everyone in Slovakia. In monetary terms, a hit to GDP of over €11 billion is lost each year in Slovakia due to corruption. That’s around 13% of GDP. 25% of the population could get the average annual wage
- 55. 53 – Slovakia – THE CONTEXT FOR INDIVIDUALS (continuation) If Slovakia could spend the money it loses to corruption each year, it could buy over 8.3 billion bottles of beer, which is 1,528 beers for each person in the country each year. We wouldn’t recommend drinking that much, as it’s more than 4 bottles of beer a day. If it’s wine you prefer, the money lost to corruption in Slovakia could buy 965 bottles of red wine for each person each year, or more than 3 bottles of wine a day, which is more than enough to set up your own wine cellar. This sum would also buy 511 Big Macs for each Slovakian individual each year (or more than 2.7 billion Big Macs in total), but we would definitely not recommend eating more than one Big Mac per day. PERCEPTIONS OF CORRUPTION IN SLOVAKIA A 2017 Eurostat survey found that 48% of respondents in Slovakia believed that the lev- el of corruption had worsened in the preceding 3 years, while 34% believed the level had remained the same. Only 9% believed the level of corruption had decreased. As an indication of the problem, 85% believe corruption is widespread in the country; and 81% believe corruption is part of the business culture of the country. Although only 42% of respondents say they are personally affected by corruption in their daily lives, 23% of respondents say that they personally know someone who takes or has taken bribes. Loss to GDP €11 billion 13%
- 56. 54 THE COST OF CORRUPTION IN SLOVENIA THE IMPACT OF CORRUPTION ON SOCIAL POLICIES The €3.5 billion lost to corruption every year in Slovenia is around 16 times the budget for the unemployed (around €219 million). This figure is basically the same size as the country’s healthcare budget (€3.3 billion) and almost equal to spending on the elderly (almost €3.8 billion). The €3.5 billion lost to corruption in Slovenia is over 9 times the size of the entire annual policing budget (almost €374 million); it is also more than 64 times bigger than the size of the budget for the fire service (€55 million). The money lost to corruption in Slovenia is 393 times bigger than the entire housing budget (€9 million), and is more than 4.5 times the budget for family and children (€756 million). Slovenia loses 4 times more money to corruption than the entire amount spent on the sickness and disability budget (almost €925 million). Slovenia spends €1.8 billion on education, which is only half the amount of money lost to corruption. The money lost to corruption in Slovenia is around 50% of the entire social expenditure budget (around €6.7 billion). THE CONTEXT FOR INDIVIDUALS The €3.5 billion lost to corruption in Slovenia is enough to give 293,604 people in the country (about 14% of the population) the average annual Slovenian wage (€12,062 net in 2015; Slovenia’s unemployment rate was 5.2% in April 2018). How does receiving €1,716 each year for free sound? Well, that is how much each person would get if the money lost to corruption were distributed amongst everyone in Slovenia. A hit to GDP of over €3.5 billion is lost each year in Slovenia due to corruption. That’s around 8.5% of GDP. Basically the same size as the healthcare budget
- 57. – Slovenia – 55 THE CONTEXT FOR INDIVIDUALS (continuation) If Slovenians could spend the money lost to corruption each year, they could buy over 1.8 billion bottles of beer, which is 884 beers for each person every year, or at least 2 beers a day. But perhaps Slovenians are more fond of wine - this money would buy around 3.1 billion bottles of red wine each year, so every person in the country could receive 1,518 bottles of wine per year, certainly enough to start your own wine cellar or to drink over 4 bot- tles of wine a day (not recommended for your health!) Similarly, 2.1 billion 1kg loaves of bread could be purchased, which is 1034 kilos of bread per person, or almost 3 kilos of bread per day. The money lost to corruption in Slovenia could also purchase 896 million Big Macs - that’s 434 per person per year. Quite a lot! PERCEPTIONS OF CORRUPTION IN SLOVENIA A 2017 Eurostat survey found that 57% of respondents in Slovenia believed that the level of corruption had worsened in the preceding 3 years, while 32% believed the level had remained the same. Only 5% believed the level of corruption had decreased. 89% of people believe corruption is widespread in Slovenia; and 76% believe corrup- tion is part of the business culture of the country. Loss to GDP €3.5 billion 8.5%
- 58. XX56 THE COST OF CORRUPTION IN SPAIN THE IMPACT OF CORRUPTION ON SOCIAL POLICIES This €90 billion is also more than 4 times the size of the entire annual budget for the unemployed (around €19.6 billion). This figure is more than 90% of the whole healthcare budget (€98.5 billion per year) and it is equal to about 88% of spending on the elderly (around €102.5 billion). The €90 billion lost to corruption in Spain is more than 6 times bigger that the entire annual policing budget (€13.5 billion). It’s also more than 52 times the size of the bud- get for the fire service (€1.7 billion). It is almost 295 times bigger than the amount spent by the government on the hous- ing budget (€307 million), and more than 11 times the size of the entire budget for family and children (€7.9 billion). The money lost to corruption in Spain is more than 3 times the sickness and disability budget (€26.6 billion). Spain spends €43 billion on education, and more than double this amount is lost to corruption every year. Indeed the money lost to corruption is almost half of the entire annual social expenditure budget. THE CONTEXT FOR INDIVIDUALS The €90 billion lost to corruption in Spain is enough to give over 4 million people in the country (about 9% of the population) the average annual Spanish wage (€20,845 net in 2015; Spain’s unemployment rate was 15.9% in April 2018). How does receiving €1,949 each year for free sound? Well, that is how much each person would get if the money lost to corruption were distributed amongst everybody in Spain. A hit to GDP of over €90 billion is lost each year in Spain due to corruption. That’s almost 8% of GDP. More than 4 times the size of the annual budget for the unemployed
- 59. 57 – Spain – THE CONTEXT FOR INDIVIDUALS (continuation) If Spain could spend the money it loses to corruption each year, it could buy over 32 billion loaves of bread, which is 699 1 kg loaves for each person in the country each year. That’s 1.9 kilos of bread per person every day! Similarly, with this sum, 22.9 billion Big Mac’s could be purchased - that’s 493 per person each year, though we would never recommend eating more than one Big Mac a day. PERCEPTIONS OF CORRUPTION IN SPAIN A 2017 Eurostat survey found that 63% of respondents in Spain believed that the level of corruption had worsened in the preceding 3 years, while 29% believed the level had re- mained the same. Only 5% believed the level of corruption had decreased. Indeed, 94% believe corruption is widespread in the country; and 75% believe corruption is part of the business culture of the country. 10% of respondents say they personally know someone who takes or has taken bribes. 83% of respondents deem corruption unacceptable. Loss to GDP €90 billion 8%
- 60. XX58 THE COST OF CORRUPTION IN SWEDEN THE IMPACT OF CORRUPTION ON SOCIAL POLICIES The €9.4 billion lost annually to corruption in Sweden is almost 1.6 times the bud- get for the unemployed (around €6 billion). The money lost to corruption in Sweden is around 19% of the country’s healthcare budget (€49 billion) and it equals roughly 20% of spending on the elderly (€48 billion). The amount lost to corruption is almost 3.5 times the size of the policing budget (almost €2.8 billion); or, almost 10 times bigger than the entire budget for the fire service (€970 million). The €9.4 billion lost annually to corruption in Sweden is almost 7 times the size of the housing budget (€1.4 billion). It also equals around 85% of the budget for family and children (almost €11.4billion), and almost 50% of the country’s entire sickness and disability budget (€19.6 billion). The money lost to corruption in Sweden is almost one third of the €31 billion spent on education. An amount of money equivalent to 10% of the entire social expenditure budget is lost because of corruption in Sweden. A hit to GDP of over €9.4 billion is lost each year in Sweden due to corruption. That’s around 3% of GDP. 7 times the housing budget
- 61. 59 – Sweden – THE CONTEXT FOR INDIVIDUALS The €9.4 billion lost to corruption in Sweden is enough to give 279,254 people in the coun- try (about 2.8% of the population) the average annual Swedish wage (€33,920 net in 2015; Sweden’s unemployment rate was 6.2% in April 2018). How does receiving €962 each year for free sound? Well, that is how much each person would get if the money lost to corruption were distributed amongst everyone in Sweden. If Sweden could spend the money it loses to corruption each year, it could buy almost 1.9 billion Big Macs, which equals 192 per person each year, which means one Big Mac every other day (which we do not recommend eating!). PERCEPTIONS OF CORRUPTION IN SWEDEN A 2017 Eurostat survey found that 39% of respondents in Sweden believed that the level of corruption had worsened in the preceding 3 years, while 47% believed the level had re- mained the same. Only 5% believed the level of corruption had decreased. 37% believe corruption is widespread in the country; and 30% believe corruption is part of the business culture of the country. 17% of respondents personally know someone who takes or has taken bribes. 81% of respondents deem corruption unacceptable. Loss to GDP €9.4 billion 3%
- 62. XX60 THE COST OF CORRUPTION IN UNITED KINGDOM THE IMPACT OF CORRUPTION ON SOCIAL POLICIES The €41.2 billion lost every year because of corruption in the UK is more than 14 times the size of the entire annual budget for the unemployed (around €2.8 billion). This figure is equal to 16% of the country’s healthcare budget (€254 billion) and it’s around 20% of the total annual spending on the elderly (over €206 billion). The money lost to corruption in the UK each year is more than 1.7 times the size of the policing budget (around €23.8 billion); and it is more than 11 times the size of the budget for the fire service (€3.5 billion). The money lost to corruption in the UK is almost 1.4 times the housing budget (€29 billion) and almost 1.3 times the budget for family and children (€32.5 billion). It is equal to almost 70% of the sickness and disability budget (around €60.3 billion). Over 30% of the total amount spent on education is lost to corruption every year (€127.6 billion). In fact, the money lost to corruption totals more than 10% of the entire social expenditure budget (€378.5billion). A hit to GDP of over €41.2 billion is lost each year in the UK due to corruption. That’s around 2.3% of GDP 11 times the fire service budget
- 63. 61 – United Kingdom – THE CONTEXT FOR INDIVIDUALS The €41.2 billion lost each year to corruption in the UK is enough to give over 1 million people in the country (about 1.6% of the population) the average annual UK wage (€37,995 net in 2015; the UK’s unemployment rate was 4.1% in April 2018). If the money lost to corruption in the UK were distributed among everyone in the UK equal- ly, each person would get €631 every year. If the UK could spend the money it loses to corruption each year, it could buy every person 175 Big Macs, 290 1kg loaves of bread, and 76 bottles of red wine each year - more than six free bottles a month. PERCEPTIONS OF CORRUPTION IN UNITED KINGDOM A 2017 Eurostat survey found that 45% of respondents in the UK believe that the level of corruption had worsened in the preceding 3 years, while 35% believed the level had re- mained the same. Only 2% believed the level of corruption had decreased. Indeed, 55% believe corruption is widespread in the country; and 51% believe corruption is part of the business culture of the country. Loss to GDP €41.2 billion 2.3%
- 64. SOURCES Estimates on cost of corruption are based on an European Parliament commissioned study conducted by RAND on the average annual reduction in GDP due to corruption: “The Cost of Non-Europe in the area of Organised Crime and Corruption”: http://www.europarl.europa.eu/RegData/etudes/STUD/2016/579319/EPRS_ STU%282016%29579319_EN.pdf Eurostat, General government expenditure by function (COFOG): https://ec.europa.eu/eurostat/statistics-explained/index.php/Government_expenditure_by_ function_%E2%80%93_COFOG Eurostat, Annual net earnings, 2015: https://ec.europa.eu/eurostat/statistics-explained/index.php/Wages_and_labour_costs Eurostat, Unemployment statistics: https://ec.europa.eu/eurostat/statistics-explained/index.php/Unemployment_statistics “The Big Mac index”, The Economist: https://www.economist.com/news/2018/07/11/the-big-mac-index European Commission, “Detailed average prices report”, October 2015: https://ec.europa.eu/eurostat/documents/272892/272992/Consumer+Prices+Re- search+-+October+2015/badc06ab-bf87-47c9-bc8d-0ef57666dd8c Eurostat, Demographics statistics 2016: http://ec.europa.eu/eurostat/statistics-explained/images/6/6d/Demographic_bal- ance%2C_2016_%28thousands%29.png European Commission, ‘Corruption: Special Eurobarometer 470,’ TNS Opinion: http://ec.europa.eu/commfrontoffice/publicopinion/index.cfm/ResultDoc/download/Docu- mentKy/81007 The OLAF Report 2017, Eighteenth report of the European Anti-Fraud Office, 1 January to 31 December 2017: https://ec.europa.eu/anti-fraud/sites/antifraud/files/olaf_report_2017_en.pdf Report from the Commission to the Council and the European Parliament, “EU Anti Corrup- tion Report”, COM(2014) 38 final: https://ec.europa.eu/home-affairs/sites/homeaffairs/files/e-library/documents/policies/or- ganized-crime-and-human-trafficking/corruption/docs/acr_2014_en.pdf European Parliament Briefing, “Protecting the EU budget against generalised rule of law deficiencies”: http://www.europarl.europa.eu/RegData/etudes/BRIE/2018/630299/EPRS_ BRI(2018)630299_EN.pdf 62
- 66. 60 rue Wiertz / Wiertzstraat 60 1047 Brussels, BELGIUM www.greens-efa.eu contactgreens@ep.europa.eu 7th December 2018