This document provides a worksheet for problem solving using a data-driven approach. The worksheet guides the user to: 1) chart issues by type and amount to identify the highest issue, 2) brainstorm contributing causes of the selected issue, 3) conduct a root cause analysis to identify the underlying cause, and 4) record countermeasures on an action plan to address the root cause. The overall goal is to use data to identify problems, determine the root causes, and plan effective actions for improvement.
More than Just Lines on a Map: Best Practices for U.S Bike Routes
Page 6 - Management by Data - Problem Solving Worksheet Blank
1. www.AnythingLean.com
Discount code: WEBB
Management by Data - Problem Solving Worksheet 'www.RobertLWebb.com
Patrick. A. Ferguson,copyright 2010
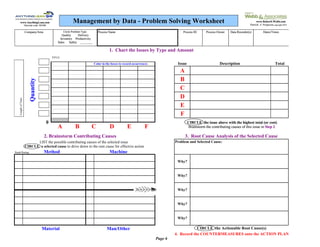
Company/Area Circle Problem Type: Process Name Process ID Process Owner Data Recorder(s) Dates/Times
Quality Delivery
Inventory Productivity
Sales Safety ________
1. Chart the Issues by Type and Amount
TITLE:
Color in the boxes to record occurrences Issue Description Total
A
B
Quantity
C
D
Length of Time:
E
F
0 CIRCLE the issue above with the highest total (or cost)
A B C D E F Brainstorm the contributing causes of this issue in Step 2.
2. Brainstorm Contributing Causes 3. Root Cause Analysis of the Selected Cause
LIST the possible contributing causes of the selected issue Problem and Selected Cause:
CIRCLE a selected cause to drive down to the root cause for effective action
Rank/Rating Method Machine
Why?
Why?
Why?
Why?
Why?
Material Man/Other CIRCLE the Actionable Root Cause(s)
4. Record the COUNTERMEASURES onto the ACTION PLAN
Page 6