ASSESSMENT OF PARTICULATE MATTER CONCENTRATION AMONG LAND USE TYPES IN OBIGBO...
frac poster3
1. We thank the Office of Research and Sponsored Programs for supporting this research, and Learning & Technology Services for printing this poster.
Effects of Wind and Precipitation on Airborne
Particulate Levels Around a Frac Sand Mine
Hannah Smith| BSB , Pang Houa Xiong- Yang | BSENPH
UNIVERSITY OF WISCONSIN- EAU CLAIRE: SAND FRACKING RESEARCH
BACKGROUND METHODS
OBJECTIVE
Frac sand mining and processing generate particulate
matter including respirable crystalline silica.
Different sources of pollution causes human health
concerns associated with frac sand mining in Wisconsin
Many cardiovascular and respiratory symptoms are
associated with the inhalation of particulate matter:
PM2.5 and PM10 levels, wind speed, wind direction and
precipitation were measured at the Chippewa Sand
mine in Bloomer, WI.
Chippewa Sands mine is located Northwest of our
equipment
Theoretically, wind direction will need to come from NW
to SE to hit our equipment
Determine correlation between met data and PM2.5
levels found.
Fig. 1: Frac sand mine in Wisconsin (fracctracker.org)
● Collect data from meteorological station at the Bloomer
site
● Use software “Weather link” to download data from field
unit to computer
● Analyze data to determine correlation of the met data
and other direct reading instruments
Compared direct reading equipment levels to met
data
Compared high PM2.5 level days to:
Wind direction
Rain rate
RESULTS
Measurements have found higher levels of PM2.5 around
plants, compared to regional levels
Wind speed and direction don’t play a role in the
movement of particulates
Precipitation seems to lower PM2.5
Monitoring for PM2.5 and silica is essential
These particles are known to cause health impact in the
long term
ACKNOWLEDGEMENTS
REFERENCES
Dr. Crispin Pierce- Environmental Public Health
Associate Professor
Office of Research and Sponsored Programs
Pierce, Crispin. “Air Quality Around Frac Sand Facilities”
19 March 2016. PowerPoint Presentation
Wisconsin Department of Natural Resources
CONCLUSION
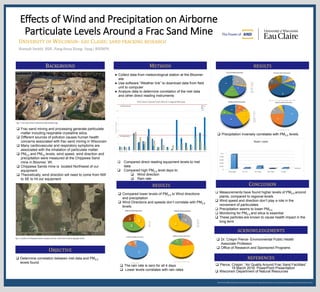
Precipitation inversely correlates with PM2.5 levels.
Compared lower levels of PM2.5 to Wind directions
and precipitation
Wind Directions and speeds don’t correlate with PM2.5
levels.
RESULTS
N
5%
NW
2%
SSW
27%
SW
61%
wnw
5%
7/23/16 Wind direction
N
NW
SSW
SW
wnw
E
3%
ESE
36%
SE
35%
SSE
26%
6/05/15 Wind direction
E
ESE
SE
SSE
W
81%
WNW
13%
WSW
6%
7/29/16 WIND Direction
W WNW WSW
ENE
2% N
21%
NW
57%
W
2%
WNW
18%
8/04/16 Wind Direction
ENE N NNW NW W WNW
The rain rate is zero for all 4 days
Lower levels correlates with rain rates
2%
24%
2%
14%
17%
41%
7/17/16 Wind Direction
E
NNW
NW
S
SW
W
WNW
NNW
11% NW
2%
S
2% SE
4%
SSE
11%
SSW
4%
SW
30%
W
8%
WNW
15%
WSW
13%
8/16/16 Wind direction
NNW NW S SE SSE SSW SW W WNW WSW
2%
13%
2%
25%
33%
8%
17%
8/28/16 Wind Direction
E
ESE
S
SE
SSE
SSW
SW
52%
21%
17%
6%
4%
9/03/16 Wind Direction
E ENE ESE NE SSE
Fig. 2: Location of Chippewa Sands company and Our instrument location (google earth)