Siliguri Escorts Service Girl ^ 9332606886, WhatsApp Anytime Siliguri
sample strategy implementation 7-S.pptx
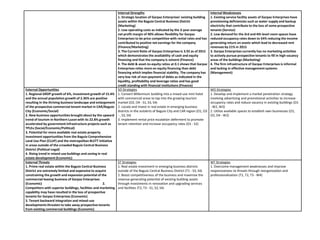
1. Internal Strengths
1. Strategic location of Garpaz Enterprises' existing building
assets within the Baguio Central Business District
(Marketing)
2. Low operating costs as indicated by the 3-year average
net profit margin of 40% allows flexibility for Garpaz
Enterprises to be price competitive with rental rates and has
contributed to positive net earnings for the company
(Finance/Marketing)
3. The Current Ratio of Garpaz Enterprises is 3.92 as of 2015
which demonstrates the availability of cash and equity
financing and that the company is solvent (Finance)
4. The debt & asset-to-equity ratios at 0.1 shows that Garpaz
Enterprises relies more on equity financing than debt
financing which implies financial stability. The company has
very low risk of non-payment of debts as indicated in the
liquidity, profitability and leverage ratios and has good
credit standing with financial institutions (Finance)
Internal Weaknesses
1. Existing service facility assets of Garpaz Enterprises have
provisioning deficiencies such as water supply and backup
electricity that contribute to the loss of some prospective
tenants (Service)
2. Low demand for the 3rd and 4th level room spaces have
reduced occupancy rates down to 54% reducing the income
generating return on assets which lead to decreased rent
revenues by 21% in 2015
3. Garpaz Enterprises currently has no marketing activities
to actively pursue prospective tenants to fill in high vacancy
areas of the buildings (Marketing)
4. The firm infrastructure of Garpaz Enterprises is informal
and lacking in effective management systems
(Management)
External Opportunities
1. Regional GRDP growth of 6%, investment growth of 15.4%
and the annual population growth of 2.36% are positive
resulting in the thriving business landscape and enlargement
of the prospective commercial tenant market in CAR/Baguio
City (Economic/Social)
2. New business opportunities brought about by the upward
trend of tourism in Northern Luzon with its 22.8% growth
accelerated by government infrastructure projects such as
TPLEx (Social/Economic/Political)
3. Potential for more available real estate property
investment opportunities from the Baguio Comprehensive
Land Use Plan (CLUP) and the metropolitan BLSTT initiative
in areas outside of the crowded Baguio Central Business
District (Political-Legal)
4. Rising trend in mixed-use buildings and zoning in real
estate development (Economic)
SO Strategies
1. Convert Millennium building into a mixed-use mini hotel
with commercial areas to tap into the growing tourism
market (O2, O4 - S1, S3, S4)
2. Locate and invest in real estate in emerging business
districts in the outskirts of Baguio City and CAR region (O1, O3
- , S3, S4)
3. Implement rental price escalation deferment to promote
tenant retention and increase occupancy rates (O1 - S2)
WO Strategies
1. Develop and implement a market penetration strategy
involving advertising and promotional activities to increase
occupancy rates and reduce vacancy in existing buildings (O1
- W2, W3)
2. Utilize available spaces to establish own businesses (O1,
O2, O4 - W2)
External Threats
1. Prime real estate within the Baguio Central Business
District are extremely limited and expensive to acquire
constraining the growth and expansion potential of the
commercial leasing business of Garpaz Enterprises
(Economic) 2.
Competitors with superior buildings, facilities and marketing
capability may have resulted in the loss of prospective
tenants for Garpaz Enterprises (Economic)
3. Tenant backward integration and mixed-use
developments threaten to take away prospective tenants
from existing commercial buildings (Economic)
ST Strategies
1. Real estate investment in emerging business districts
outside of the Baguio Central Business District (T1 - S3, S4)
2. Boost competitiveness of the business and maximize the
revenue generating potential of existing building assets
through investments in renovation and upgrading services
and facilities (T2, T3 - S1, S3, S4)
WT Strategies
1. Overcome management weaknesses and improve
responsiveness to threats through reorganization and
professionalization (T1, T2, T3 - W4)
2. SHORT TERM Strategies Duration Cost
1. Maximization of the revenue generating potential of existing fixed assets
and boosting occupancy rates of buildings through investments in
renovation and upgrading service facility provisioning.
18-24 months
(construction) P15.1M
1. Repurpose and utilize available real estate assets to establish mixed-use
facilities tapping into opportunities made available by the economic and
tourism growth in the region
3 years
(business plan, construction and
launch)
P100+M estimated
LONG TERM Strategies Duration Cost
1. Professionalization of the business management and the organizational
structure
Up to 12 months
(Short-term) P106,754
1. Market Penetration Strategy through advertising and promotions to
increase prospective tenant awareness and attraction to increase
occupancy rates in existing buildings
Up to 12 months
(Short-term)
P15,770
1. (Groundwork for long-term strategy) Maximization of the revenue
generating potential and occupancy rates of existing building assets
through investments in building renovation and upgrading services and
facilities
2-3 months
(Finalization of project plan &
negotiations with contractor)
--
1. (Groundwork for long-term strategy) Repurpose and utilize available real
estate assets to establish mixed-use facilities tapping into opportunities
made available by the economic and tourism growth in the region
2-3 months
(feasibility study)
--
3. 7-S framework
Strategy:
• Professionalization and Market Penetration Strategies
Structure:
• Starting from the top, there should be a working and functional the Board
of Directors (BoD) that hold regular board meetings with the initial
meetings should include the self-assessment and orientation to corporate
governance and strategic management.
• The BoD should be able to govern the organization by establishing broad
policies and strategic objectives, approve budgets and review and monitor
overall performance and finances.
• The present structure shall be reorganized with clearly defined positions
at the board level as illustrated in Figure 8, compliant with Article IV of the
Articles of Incorporation of Garpaz Enterprises, Inc. The President and CEO
shall be in charge of the overall business operations and report to the
board of directors. The building administrator shall perform the day-to-day
property management duties and will report to the President .
4. 7-S framework
Strategy:
• Professionalization and Market Penetration Strategies
Systems:
• The planning, policy and decision-making processes of the
board and administrator must incorporate the use of data
and analysis to supplement experience and intuition
whenever possible. BoD can use capital budgeting
techniques in long-term investment decision-making.
• Decentralize procurement and disbursement and establish
expenses cost authorization levels from the Administrator
up to BoD for approval in order to expedite tasks that need
to be acted upon at lower expense levels.
5. 7-S framework
Strategy:
• Professionalization and Market Penetration Strategies
Style:
• Open door policy for the president and administrator to
communicate with the employees in a 2-way feedback system for
operational updates, planning, coordination, and improvement of
existing processes.
Staff:
• The small size of the organization requires only minimal staffing
needs but an additional office assistant or secretary may be hired if
necessary to assist in the activities of the professionalization and
market penetration strategies.
• Bring in consulting services for accounting, finance, legal, property
management and real estate investing matters as necessary.
6. 7-S framework
Strategy:
• Professionalization and Market Penetration Strategies
Super-Ordinate Goals / Shared Values:
• The company should have a dynamic and adaptive but focused
organization with a common commitment to the improvement of the
business.
Skills:
• The Board of Directors also must be able to identify opportunities and
define objectives for the organization through group strategic thinking as
part of a formal strategic management process to define an overall
direction to Garpaz Enterprises.
• The president and administrator must develop or improve business
management, leadership, communication, critical-thinking,
financial/accounting skills and project-management skills.
• Employees should have problem solving, verbal and written
communication, adaptability, and selling skills.
7. Proposed Strategy: Professionalization of the business management and the organizational structure
Activity Cost Personnel assigned Timeframe (Month 1-12)
Board of Directors
1. Scheduling and agenda setting of Annual and
Quarterly Board Meetings
Corporate Secretary Month 1
2. Annual Board Meeting session on self-
assessment, reorganization (election of officers
and appointments) and orientation on the
responsibilities and duties of the board directors
and strategic management principles
Board Per Diem Annual Meeting Compensation
(P3,000 x 5 members)
₱ 15,000
3. Quarterly regular board meetings with strategic
planning sessions for 2015-2016
Board Per Diem Regular Meeting Compensation
(P15,000 per meeting)
₱ 60,000
4. Full documentation of notices of meetings,
minutes of meetings and board resolutions of
board meetings
Corporate Secretary
assisted by the office
secretary
Quarterly 2015-2016
Administration Office
5. Administration Office operational log book is
created and maintained daily
Secretary Month 1-12
6. Creation of a basic policies and procedures file
for the Administration office
President
/Administrator
Month 2-3
7. Administration Office Employee orientation
sessions on policies, procedures, reporting, tasks,
duties, communication protocols and meeting
scheduling
Facilitated by the
President /Proponent
Month 3-4
8. Accounting/Finance consulting services
Professional Fees (P10,200 x 3 months) ₱ 30,600
9. Implementing proper physical records
management and basic management information
systems
overtime pay (P38.46 x 15 hours x 2 employees) ₱ 1,154
10. Ongoing daily or weekly office
professionalization progress and performance
monitoring
President Month 5-12
₱ 106,754
Facilitated by the
proponent
Month 2
Facilitated by the
Chairman of the Board
Quarterly 2015-2016
President
/Administrator
/Secretary
/Admin Assistant
Month 4-5
Accountant Month 3-5
8. Financial Forecast and Financial Ratio Analysis
• In this section, a one-year financial forecast
was done to estimate the financial outcomes
of the short-term strategies to be
implemented.
– Income statement
– Balance sheet
– Financial ratios
• Assumptions
9.
10. 2016
(Projected)
2015 2014
Rent Revenue 15,103,745.92 11,708,330.17 14,886,188.00
Operating Expenses
Salaries and Wages 1,427,492.98 2,716,653.00 1,351,151.00
PHIC & SSS Premiums 103,840.26 205,941.00 100,523.00
Employee Benefits 188,951.63 658,387.00 182,915.42
Operating Supplies 541,204.32 538,562.10 509,129.18
Repairs & Maintenance 658,773.79 581,442.00 1,907,787.23
Fuel & Lubricant 280,568.49 196,226.57 263,940.25
Security Services 184,310.42 182,056.39 173,387.04
Janitorial Services 246,254.58 254,826.00 231,660.00
Other Service Fees 140,826.24 145,728.00 132,480.00
Insurance 111,627.38 101,829.12 105,011.65
Business Taxes & Licenses 585,314.48 607,890.10 550,625.10
Real Property Tax 121,656.88 117,506.34 114,446.74
Travel & Transportation
Expenses 187,660.99 44,124.00 105,984.00
Communication Expenses 131,893.55 126,346.78 124,076.72
Utility Expenses 455,358.46 459,268.56 428,371.08
Depreciation Expenses 516,671.29 362,423.00 385,700.00
Donation/Contribution 60,000.00 60,000.00 60,000.00
Miscellaneous Expenses 72,605.04 41,608.98 53,466.64
Total Operating Expenses 6,015,010.79 7,400,818.94 6,780,655.05
Operating Income 9,088,735.13 4,307,511.23 8,105,532.95
Other Income (Expenses), net 385,364.07 92,375.03 87,146.25
Earnings before Taxes 9,474,099.20 4,399,886.26 8,192,679.20
Provision for Income Tax 1,817,747.03 861,502.25 1,621,106.59
Net Income 7,656,352.17 3,538,384.01 6,571,572.61
11. 2016 (Projected) 2015 2014
ASSETS
Current Assets
Cash & Cash Equivalents 2,938,024.15 1,593,640.03 1,678,870.94
Accounts receivable 105,056.73 11,434.50 80,812.87
Supplies 3,735.38 1,350.00 3,514.00
Prepaid Insurance 89,301.91 67,886.08 84,009.32
Total Current Assets 3,136,118.17 1,674,310.61 1,847,207.13
Long-term Investments 19,268,203.55 12,042,627.22 6,891,098.07
Property, Plant and Equipment 25,316,893.41 25,833,564.70 23,964,300.00
Less: Accumulated Depreciation (1,699,794.29) (1,183,123.00) (820,700.00)
Total Property, Plant & Equipment 23,617,099.11 24,650,441.70 23,143,600.00
Total Assets 46,021,420.83 38,367,379.53 31,881,905.20
LIABILITIES AND EQUITY
Current Liabilities
Accounts payable 17,188.91 15,131.08 87,584.55
Salaries payable 59,844.73 113,193.88 56,297.96
Unearned rent 347,421.99 298,441.55 368,982.28
Total Current Liabilities 424,455.63 426,766.51 512,864.79
Non-Current Liabilities
Total Liabilities 424,455.63 426,766.51 512,864.79
Equity
Paid-up Capital 1,000,000.00 1,000,000.00 1,000,000.00
Retained Earnings 44,596,965.20 36,940,613.02 30,369,040.41
Total Equity 45,596,965.20 37,940,613.02 31,369,040.41
TOTAL LIABILITIES AND NETWORTH 46,021,420.83 38,367,379.53 31,881,905.20
12. 2016
(Projected) 2015 2014
Liquidity Ratios
Current Ratio 7.39 3.92 3.60
Profitability Ratios
Operating Margin 60% 37% 54%
Net Profit Margin 51% 30% 44%
ROA 0.17 0.09 0.21
ROE 0.17 0.09 0.21
Leverage Ratios
Debt-to-Assets 1% 1% 2%
Debt-to-Equity 0.01 0.01 0.02
Activity Ratios
Fixed Assets Turnover
Ratio 0.64 0.47 0.64
Total Assets Turnover
Ratio 0.33 0.31 0.47