
Recommended
More Related Content
Viewers also liked
Viewers also liked (20)
Similar to Cee midterm
Similar to Cee midterm (20)
Recently uploaded
Recently uploaded (20)
Cee midterm
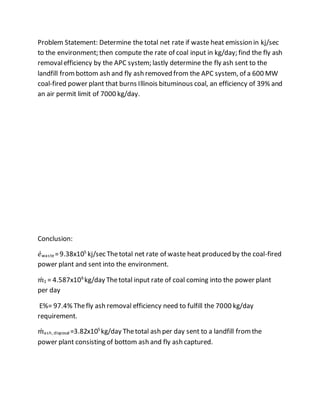
- 1. Problem Statement: Determine the total net rate if waste heat emission in kj/sec to the environment; then compute the rate of coal input in kg/day; find the fly ash removalefficiency by the APC system; lastly determine the fly ash sent to the landfill frombottom ash and fly ash removed from the APC system, of a 600 MW coal-fired power plant that burns Illinois bituminous coal, an efficiency of 39% and an air permit limit of 7000 kg/day. Conclusion: 𝑒̇waste =9.38x10⁵ kj/sec Thetotal net rate of waste heat produced by the coal-fired power plant and sent into the environment. 𝑚̇ 1 = 4.587x10⁶ kg/day Thetotal input rate of coal coming into the power plant per day E%= 97.4% Thefly ash removal efficiency need to fulfill the 7000 kg/day requirement. 𝑚̇ ash, disposal =3.82x10⁵ kg/day Thetotal ash per day sent to a landfill fromthe power plant consisting of bottom ash and fly ash captured.
- 2. Problem Statement: Determine the volumetric flow rate of each of the three exhaust stacks and combine the flow rates to a total flow rate; complete a mass balance on two chemicals IPA and MeOH to establish the quantity of each solvent lost by vaporization; find the concentration of IPA and MeOH in ppmv and g/m3 in the stack exhaust; finally compute the volumetric flow rate of IPA and MeOH through each exhaust stack, of a local microchip manufacturer. All figures can be seen on figure2. Conclusion: Q1 = 2.12x10⁴ cfmThevolumetric flow rate from stack 1 Q2 = 1.44x10⁴ cfmThevolumetric flow rate fromstack 2 Q3 = 323 cfmThe volumetric flow rate of stack 3 Qtotal =3.59x10⁴ cfm Thetotal volumetric flow rate of the entire building 𝑚̇ IPA, total =7666.1 lb/yr Themass flow rate of substanceIPA outof all the stacks 𝑚̇ IPA, 1 = 4527.1 lb/yr Themass flow rate of substanceIPA out of the firststack 𝑚̇ IPA, 2 = 3074.9 lb/yr Themass flow rate of substanceIPA outof the second stack 𝑚̇ IPA, 3 = 68.9 lb/yr The mass flow rate of substanceIPA outof the third stack 𝑚̇ MeOH, total =13632.553 lb/yr Themass flow rate of substanceMeOH out of all the stacks 𝑚̇ MeOH, 1 = 8050.42 lb/yr Themass flow rate of substanceMeOH out of the first stack 𝑚̇ MeOH, 2 = 5468.21lb/yr Themass flow rate of substanceMeOH out of the second stack 𝑚̇ MeOH, 3 = 122.66 lb/yr Themass flow rate of substanceMeOH out of the third stack
- 3. CCH3OH,1,2,3 = 8.833 ppmv =11,571.2g/m3 Theconcentration of Menthol inside the building and inside the stacks in ppmv and g/m3 CC3H7OH,1,2,3 = 2.66 ppmv = 6517 g/m3 Theconcentration of IPA insidethe building and inside the stacks in ppmv and g/m3 QMeOH, 1= 0.187 ft3 /min The total flow rate of MeOH leaving fromstack 1 QMeOH, 2 = 0.127 ft3 /min The total flow rate of MeOH leaving fromstack 2 QMeOH, 3 = 2.85x10⁻³ ft3 /min The total flow rate of MeOH leaving fromstack 3 QIPA, 1= 5.64x10⁻² ft3 /min The total flow rate of IPA leaving fromstack 1 QIPA, 2 = 3.84x10⁻² ft3 /min The total flow rate of IPA leaving from stack 2 QIPA, 3 = 8.59x10⁻⁴ ft3 /min The total flow rate of IPA leaving fromstack 3 Itis confirmed that the volumetric flow rate of the of the vaporized are small relative to the total flow rate, allowing people to work without fear of toxicant poisoning.
- 4. TDS = 363.5 mg/lThe total dissolved solids in the water samplewith a pH of 7.0 Alkalinity= 127.54 mg/las CaCO3 = 2.705 meq/l The measureof the sample’s capability to absorb hydrogen ions withoutsignificantpH change. TH = 199.29 mg/l= 3.986 meq/l Total hardness of the water sample the sumof Ca and Mg CH = 127.54 mg/l= 2.705 meq/lThe hardness of the sample associated with the carbonates NCH = 71.75 mg/l = 1.281 meq/l The hardness of the sample not associated with carbonates The solution is electrically neutral because the sumof cations and anions are nearly equal.
- 5. Problem Statement: Read chapter 4and create brief type-written study guide. 1. Introduction a. Exposureto substances can cause risk b. Risk assessmentand risk management are processes of deciding what to do 2. Perspectives on Risk a. Everything we do has risk (i.e. car trip, smoking living in a city, eating food) 3. Perception of Risk a. How risk are perceived depend benefit out weighing cost i. Attributes that lower perception – Voluntary, Known, Controlled by self ii. Attributes that elevate perception – Involuntary, Controlled by others, Exotic 4. Risk Assessment a. Hazard identification – the process of determining whether or not a particular chemical is causally linked to particular health effects, such as cancer of birth defects. b. Dose-responseassessment –the process of characterizing the relationship between the dos of an agent administered or received and the incidence of an adversehealth effect. c. Exposureassessment –involves determining the size and nature of the population that has been exposed to the toxicant under consideration and length of time and toxicant concentration to which they have been exposed. d. Risk characterization the integration of the previous threesteps. 5. Hazard Identification a. Toxins can be indentified in the body severalorgans are vulnerable to toxicants like the liver. b. Relative risk= 𝑎/(𝑎+𝑏) 𝑐/(𝑐+𝑑) Attributable risk= 𝑎 𝑎+𝑏 - 𝑐 𝑐+𝑑
- 6. Odds ratio = 𝑎𝑑 𝑏𝑐 6. Dose-ResponseAssessment a. CDI = 𝐶𝑜𝑛𝑐𝑒𝑛𝑡𝑟𝑎𝑡𝑖𝑜𝑛 ( 𝑚𝑔 𝑚3 ) x Intake rate ( m3 day ) x Exposure ( day life ) 𝐵𝑜𝑑𝑦 𝑊𝑒𝑖𝑔ℎ𝑡 ( 𝑘𝑔) 𝑥 70 ( 𝑦𝑟 𝑙𝑖𝑓𝑒 ) 𝑥 365 ( 𝑑𝑎𝑦𝑠 𝑦𝑟 ) 7. Human ExposureAssessment a. Bioconcentration i. provides the key link measuring the tendency for a substance to accumulate in fish tissue. b. Contaminant Degradation ii. Degradation may be the result of a number of process that remove pollutants from the medium which they reside. C(t)=C(0)e-kt 8. Comparative Risk Analysis a. Based on thosestrategic principles, EPA has defined six highest priority research topics: i. Drinking water disinfection ii. Particulate matter iii. Endocrinedisruptors iv. Improved ecosystemrisk assessment v. Improved health risk assessment vi. Pollution prevention and new technologies