Download as PDF, PPTX


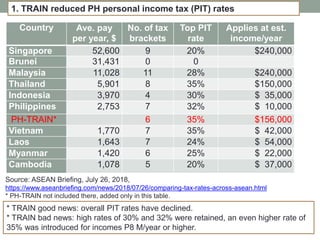
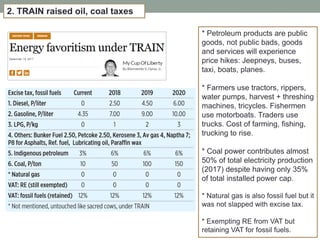
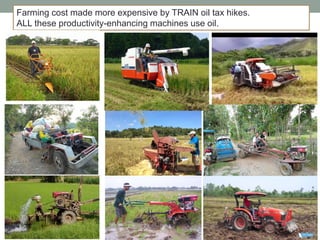
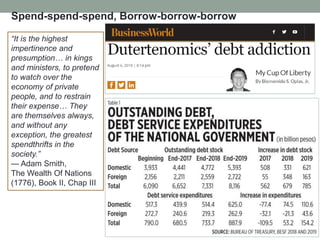
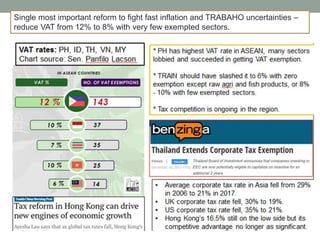
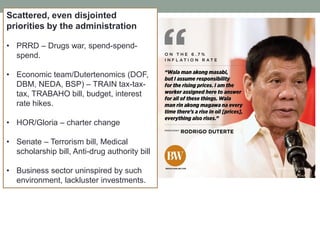
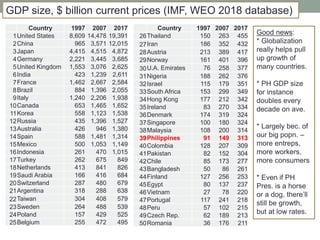


The document discusses the impact of the TRAIN law on the Philippines' economy, highlighting a reduction in personal income tax rates while simultaneously increasing taxes on oil, coal, sugary drinks, and tobacco, which has contributed to significant inflation. It details the worsening financial climate characterized by a struggling stock market, peso depreciation, and GDP growth slowdown, ultimately reflecting a divergence from the growth rates achieved under the previous administration. Additionally, it notes the government's ongoing fiscal challenges, including rising public debt and budget deficits amidst ambitious spending plans.


