1. Percent Energy Recovery Running on Varying Inclines
Bobby Brandt, Bond Burley, Andrew Lewis, Melanie Morris, and Will Shaw
Lewis & Clark College Department of Biology
ABSTRACT
MATERIALS AND METHODS
Conversion of potential and kinetic energy while running on
flat ground is well understood in the SLIP model. However,
energy exchange in the SLIP model while running up and
downhill is still relatively unknown. Our objective in this
experiment was to calculate the percent energy exchange
with a subject running on flat ground, uphill (4º slope), and
downhill (-4º slope) to see which had a higher energy
return. We attached a 3D tracking accelerometer to the back
of a runner and collected data for vertical and fore-aft
acceleration while running. From the data we calculated the
percent energy exchange through integration techniques.
We found no difference in mean percent recovery in each of
the running trials on flat ground, a 4º slope, or a -4º slope.
However, this data was nonsignificant, so any conclusions
or significance we draw are not definitive.
LITERATURE CITED
• Bigelow, Erin M R, et al. "Peak Impact Accelerations
During Track And Treadmill Running." Journal Of
Applied Biomechanics 29.5 (2013): 639-644. MEDLINE.
Web. 19 Feb. 2014.
• Lees, John, Lars Folkow, and KA Stokkan. "The
Metabolic Cost of Incline Locomotion in the Svalbard
Rock Ptarmigan (Lagopus Muta Hyperborea): The
Effects of Incline Grade and Seasonal Fluctuations in
Body Mass." Journal of Experimental Biology 216.8
(2013): 1355-363. Web of Science. Web. 18 Feb. 2014.
• Snyder, Kristine L., Rodger Kram, and Jinger S.
Gottschall. "The Role of Elastic Energy Storage and
Recovery in Downhill and Uphill Running." The Role of
Elastic Energy Storage and Recovery in Downhill and
Uphill Running 215.13 (2012): 2283-287. Web of
Science.
CONCLUSIONS
We tested the hypothesis that a subject running on flat ground,
uphill (4º slope), and downhill (-4º slope) had a higher energy
return. Snyder et al. (2012) found kinetic energy values that had
an approximate range from 40 to -30 J. This is similar to our
values of kinetic energy that had an approximate range of 50 to
0 J. Because these ranges are similar, we feel that our data are
within the realm of possibility.
While our data were inconclusive, our method of measuring
energy could be used in future experiments. An effective
experiment using the same methods might include more
runners, samples, trials, using steeper slopes, and adjustments to
material setup. Placing the accelerometer lower on the body
closer to the center of mass may be beneficial. Making any of
these changes could provide more insight percent energy
recovery of running on various slopes.
What we found:
• Percent energy recovery does not vary on different inclines.
• Our data were not statistically significant due to high p-
values (over 0.9 for each trial).
• A workable method for using an accelerometer to calculate
total energy.
We collected vertical and fore-aft acceleration by firmly attaching
an accelerometer to a runner’s back between T3 and T4. The
runner ran at near maximal speed on flat ground, on a slope of 4º,
and on a slope of -4º for five trials at each inclination.
We used a Wireless Dynamic Sensor System accelerometer
strapped to the runner’s back with a Black Diamond Vario harness.
The accelerometer was set to track the runner’s motion at a rate of
50 to 100 samples per second for a 10 second period in the
up/down and fore/aft directions. A section of 1.5 seconds was
randomly selected from the entire 10 second period (2-3 strides).
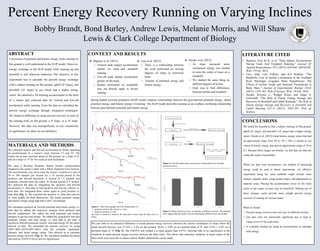
We analyzed the data by integrating the up/down and fore/aft
acceleration vs. time data to find up/down and fore/aft velocity vs.
time data. We integrated these values again to yield position vs.
time data (Fig. 1). We corrected the position vs. time and velocity
vs. time graphs for both dimensions. We found potential energy
and kinetic energy using mgh and (½)mv2
accordingly.
We calculated up/down & fore/aft potential and kinetic energy vs.
time data by adding the respective energies from up/down and
fore/aft components. We added the total potential and kinetic
energies to get the total energy. We added the ∆(up/down+fore/aft)
potential, kinetic, and total energy vs. time data to get total ∆
(up/down+fore/aft) potential, kinetic, and total energy for the entire
interval of time. We calculated the percent recovery by using
(∆PE+∆KE-∆TE)/(∆PE+∆KE) with the available ∆potential,
∆kinetic, and ∆total energy values. This allowed us to calculate
percent energy recovery (Fig. 2). We calculated standard deviation
and used an ANOVA test to test for significance.
CONTEXT AND RESULTS
Figure 1: These three graphs show the linearization of:
• up/down and fore/aft velocity vs. time
• up/down position vs. time
We used a constant to linearize the data and to ensure that the data were in
phase.
Figure 3: Mean percent recovery of running on different inclines. The standard
error suggest that the means were not statistically different from one another.
We saw little to no statistical difference in mean percent energy recovery between the various inclinations of slope where the
mean percent recovery was 27.16% ± 5.4% on flat ground, 28.6% ± 4.0% on an inclined slope of 4º, and 27.8% ± 3.8% on a
declined slope of -4º (Fig. 3). The ANOVA test yielded a p-value greater than 0.9733, showing little to no significance to the
similarity in mean percent energy recovery between the three trials. This shows that statistical similarity in mean values of the
three trials were most due to chance and no further elaborations can be made.
● Bigelow et al. (2013)
○ Vertical peak impact accelerations
similar on track and treadmill
running
○ Fore-aft peak impact acceleration
greater on the track.
○ Studies performed on treadmills
may not directly apply to terrain
running.
● Lees et al. (2013)
○ There is a relationship between
the work performed on varying
degrees of slope in terrestrial
birds.
○ Transfer of potential energy and
kinetic energy
● Snyder et al. (2012)
○ As slope increased more
mechanical energy was needed
to raise the center of mass on a
treadmill.
○ We studied the same thing on
different degrees of terrain
○ Goal was to find differences
between terrain and treadmill
Raw
Adjusted
Raw
Adjusted
Adjusted
Raw
Spring-loaded inverted pendulum (SLIP) model explains relationships between the gravitational potential energy, elastic
potential energy, and kinetic energy of running. The SLIP model describes running as an in-phase oscillating relationship
between gravitational potential and kinetic energy.
Figure 2: This flowchart shows our process of data analysis to calculate
percent recovery.