BRN Seminar 12/06/14 Introduction to Network Medicine
Nathaniel Internship Poster
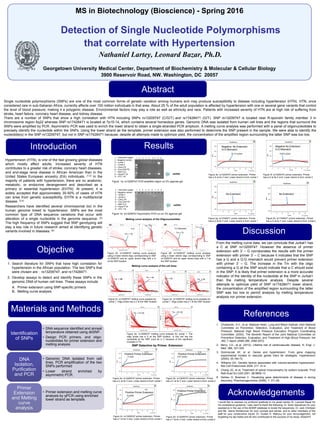
1. MS in Biotechnology (Bioscience) - Spring 2016
Detection of Single Nucleotide Polymorphisms
that correlate with Hypertension
Nathaniel Lartey, Leonard Bazar, Ph.D.
Georgetown University Medical Center, Department of Biochemistry & Molecular & Cellular Biology
3900 Reservoir Road, NW. Washington, DC 20057
Hypertension (HTN), is one of the fast growing global diseases
which mostly affect adults. Increased severity of HTN
contributes to a greater risk of stroke, coronary heart diseases,
and end-stage renal disease in African American than in the
United States European ancestry (EA) individuals. (1,2) In the
majority of patients with hypertension, there are no anatomic,
metabolic, or endocrine derangement and described as a
primary or essential hypertension (EHTN). At present, it is
widely accepted that approximately 30-50% of cases of HTN
can arise from genetic susceptibility. EHTN is a multifactorial
disease. (3,4)
Researchers have identified several chromosomal loci in the
human genome linked to hypertension. SNPs are the most
common type of DNA sequence variations that occur with
alteration of a single nucleotide in the genome sequence. (5)
The high frequency of SNPs suggest that SNP genotyping will
play a key role in future research aimed at identifying genetic
variants involved in diseases. (6)
I would like to express my profound gratitude to my great mentor Dr. Leonard Bazar for
his consistance guidance. I also want to thank the following: Dr. Sona Vasudevan for your
assistance in the use of the dbSNP database to locate the sequences, Dr. Jack Chirikjian
and Ms. Vasna Nontanovan for your counsel and advise, and to other members of the
staff for your constructive inputs. Dr. Gustav K. Mahunu for your encouragement, not
forgetting my lab mates and all who contributed to the success of my study. Shalom!!!
Introduction
Abstract
Discussion
Materials and Methods
Acknowledgements
Objective
1. Search literature for SNPs that have high correlation for
hypertension in the African population. The two SNP’s that
were chosen are : rs13209747, and rs17428471.
2. Develop assays to detect and identify these SNPs in the
genomic DNA of human cell lines. These assays include
A. Primer extension using SNP-specific primers
B. Melting curve analysis
• DNA sequence identified and anneal
temperature obtained using dbSNP.
• Design PCR primers, and oligo-
nucleotides for primer extension and
melting analysis
Identification
of SNPs
• Genomic DNA isolated from cell
lines, PCR amplification of the two
SNPs performed
• Lower strand enriched by
asymmetric PCR.
DNA
Isolation,
Purification
and PCR
• Primer extension and melting curve
analysis by qPCR using enriched
lower strand as template.
Primer
Extension
and Melting
curve
analysis
Single nucleotide polymorphisms (SNPs) are one of the most common forms of genetic variation among humans and may produce susceptibility to disease including hypertension (HTN). HTN, once
considered rare in sub-Saharan Africa, currently affects over 100 million individuals in that area. About 25 % of the adult population is affected by hypertension with one or several gene variants that control
the level of blood pressure, making it a polygenic disease. Environmental factors may play a role as well as ethnicity and race. Patients with increased severity of HTN are at high risk of suffering from
stroke, heart failure, coronary heart disease, and kidney disease.
There are a number of SNPs that show a high correlation with HTN including SNPs rs13209747 (C/G/T) and rs17428471 (G/T). SNP rs13209747 is located near R-spondin family member 3 in
chromosome region 6q22 whereas SNP rs17428471 is located at 7p15-14, which contains several homeobox genes. Genomic DNA was isolated from human cell lines and the regions that surround the
SNPs were amplified by PCR. Asymmetric PCR was used to enrich the lower strand to obtain a single-stranded PCR amplicon. A melting curve analysis was performed with a panel of oligonucleotides to
precisely identify the nucleotide within the SNPs. Using the lower strand as the template, primer extension was also performed to determine the SNP present in the sample. We were able to identify the
nucleotide(s) in the SNP rs13209747, but not in SNP rs17428471 because, despite all attempts made to optimize yield, the concentration of the amplified region surrounding the latter SNP was too low.
1 – 1KB DNA Ladder
2 - Negative control
3 – Jurkat 1
4 – Jurkat 2
5 – Caco2 P4
6 – Coco 205 P6
7 – BAK P3O
8 – Hacat P 34
9 – HTC 116
1 2 3 4 5 6 7 8 9
dsDNA
Figure 1a: rs13209747 PCR amplified region on 2% agarose gel
1 – 1KB DNA Ladder
2 - Negative control
3 – Jurkat 1
4 – Jurkat 2
5 – Caco2 P4
6 – Coco 205 P6
7 – BAK P3O
8 – Hacat P 34
9 – HTC 116
Figure 1b: rs13209747 Asymmetric PCR run on 3% agarose gel
1 2 3 4 5 6 7 8 9
ssDNA
Tm. = 76
C:G
Tm. =76
Figure 2A: rs13209747 melting curve analysis
using a lower strand oligo corresponding to SNP
rs13209747 and an upper strand oligo with a G
at the SNP location
Tm = 73
Figure 2B: rs13209747 melting curve analysis
using a lower strand oligo corresponding to SNP
rs13209747 and an upper strand oligo with a T at
the SNP location
T:C Mismatch
Melting curve analysis of the Oligonucleotides
References
Results
SNP Detection by Primer Extension
Figure 3a: rs13209747 primer extension. Primer
has a C at its 3’ end. Lower strand is from Jurkat 1
Figure 3b: rs13209747 primer extension. Primer
has a C at its 3’ end. Lower strand is from Jurkat 2
Figure 3e: rs13209747 primer extension. Primer
has a G at its 3’ end. Lower strand is from Jurkat 1
Figure 3f: rs13209747 primer extension. Primer
has a G at its 3’ end. Lower strand is from Jurkat 2
Figure 3g: rs17428471 primer extension. Primer
has a G at its 3’ end. Lower strand is from Jurkat 1
Figure 3h: rs17428471 primer extension. Primer
has a G at its 3’ end. Lower strand is from Jurkat 2
Positive Primer Extension Positive Primer Extension
Negative. No Extension
G:G Mismatch
Negative No Extension
G:G Mismatch
No Extension No Extension
From the melting curve data, we can conclude that Jurkat1 has
a C at SNP rs13209747. However the absence of primer
extension with 3’ – G corroborates the results with the primer
extension with primer 3’ – C because it indicates that the SNP
has a G and a G:G mismatch would prevent primer extension
with primer 3’ – G. The increase in the Tm with the oligo
containing a G at the SNP would indicate that a C should exist
in the SNP. It is likely that primer extension is a more accurate
indicator of the identity of the nucleotide at the SNP in Jurkat1
than the melting temperature analysis. Despite several
attempts to optimize yield of SNP rs17428471 lower strand,
the concentration of the amplified region surrounding the latter
SNP was too low to permit analysis by melting temperature
analysis nor primer extension.
1. Chobanian, A.V., et al; National Heart, Lung and Blood Institute Joint National
Committee on Prevention, Detection, Evaluation, and Treatment of Blood
Pressure; National High Blood Pressure Education Program Coordinating
Committee. (2003). The Seventh Report of the Joint National Committee on
Prevention Detection, Evaluation, and Treatment of High Blood Pressure: the
JNC 7 report JAMA 289, 2560-2572.
2. Berry, J.D., et al. (2012). Lifetime risk of cardiovascular disease. N. Engl. J.
Med. 366, 321-329.
3. Dominiczak AF, et al. Genes and hypertension: From gene mapping
experimental models to vascular genes trans far strategies. Hypertension
(2000); 35,164-72.
4. Williams GH. Genetic factors associated with volume-sensitive hypertension.
Mol Cell Endocrineol 2004; 217: 41-4.
5. Chang JG, et al, Treatment of spinal muscularaphy by sodium butyrate. Prod
Natl Acad Sci USA 2001; 98:9808-13.
6. Delrieu O, Bowman C. Visualizing gene determinants of disease in during
discovery. Pharmacogenomics (2006); 7: 311-29.
Melting curve analysis of the cell lines
Figure 2c: rs13209747 melting curve analysis for
Jurkat 1. Oligo probe has a C at the SNP location
Figure 2e: rs13209747 melting curve analysis for Jurkat 1. The
oligo probe has a G at the SNP location. In this cell line the
nucleotide at the SNP must be a C because of the significant
increase in Tm
Figure 2d: rs13209747 melting curve analysis for
Jurkat 1. Oligo probe has a T at the SNP location
Tm. = 51.50
Tm = 73
2A 2B
Tm. = 48
Tm. = 48
Tm. = 49 Tm. = 49
Tm. = 51.50
C:G C:G
0 cycle 3.57 cycles
22.12 cycles 18.60 cycles
Positive Primer Extension
0 cycle
T:A
Positive Primer Extension
T:A
0 cycle
Figure 3c: rs13209747 primer extension. Primer
has a T at its 3’ end. Lower strand is from Jurkat 1
Figure 3d: rs13209747 primer extension. Primer
has a T at its 3’ end. Lower strand is from Jurkat 2