
Recommended
More Related Content
Similar to posterCP2015(1)
Similar to posterCP2015(1) (20)
posterCP2015(1)
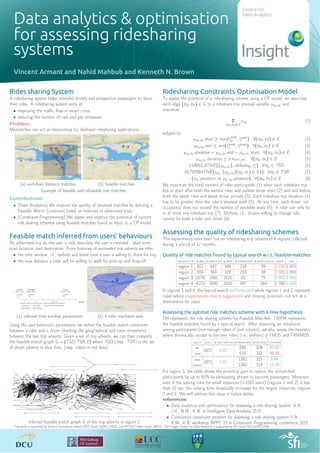
- 1. Data analytics & optimisation for assessing ridesharing systems Vincent Armant and Nahid Mahbub and Kenneth N. Brown Centre for Data Analytics Rides sharing System A ridesharing system helps intended drivers and prospective passengers to share their rides. A ridesharing system aims at: • improving the traffic flow in smart cities, • reducing the number of cars and gaz emissions. Problem: Mismatches can act as disincentive for deployed ridesharing applications. < (a) euclidean distance matches (b) feasible matches Example of feasible and infeasible ride matches Contributions: • (Data Analytics) We improve the quality of returned matches by defining a Feasible Match Constraint based on histories of advertised trips. • (Constraint Programming) We assess and improve the potential of current ride sharing schemes using feasible matches found as input to a CP model. Feasible match inferred from users’ behaviours An advertised trip by the user u only describes the user’s intended : start time, start location, and destination. From histories of successful trip adverts we infer: • the time window, i.e., earliest and latest time a user is willing to share his trip, • the max distance a rider will be willing to walk for pick-up and drop-off. time tearly u start time earliest tstart u start time intended tlatest u arrival time latest δ− start delay negative δ+ start delay positive f1(π∗ ) travel time estimation (a) inferred time window parameters (b) a rider reachable area Using the user behaviour parameters, we define the feasible match constraint between a rider and a driver checking the geographical and time consistency between the two trip adverts. Given a set of trip adverts, we can then compute the feasible match graph G = (TSD, TSR, E) where TSD (resp. TSR) is the set of driver adverts in blue dots, (resp. riders in red dots). Inferred feasible match graph G of the trip adverts in region 2 Ridesharing Constraints Optimisation Model To assess the potential of a ride-sharing scheme using a CP model, we associate each edge (tsd, tsr) ∈ G to a rideshare trip interval variable ytsd,tsr and maximize: Σ (tsd,tsr)∈E x,tsr (1) subject to: ytsd,tsr .start ≥ max(tearly d , tearly r ), ∀(tsd, tsr) ∈ E (2) ytsd,tsr .end ≤ min(tlatest d , tlatest r ), ∀(tsd, tsr) ∈ E (3) ytsd,tsr .duration = ytsd,tsr .end − ytsd,tsr .start, ∀(tsd, tsr) ∈ E (4) ytsd,tsr .duration ≥ π ∗lstart,ldest , ∀(tsd, tsr) ∈ E (5) CUMULATIVE({ytsd,tsr }, nbSeatsd, ≤), ∀tsd ∈ TSD (6) ALTERNATIVE(xtsr , {ytsd,tsr |(tsd, tsr) ∈ E}), ∀tsr ∈ TSR (7) (xtsc .presence ⇒ ytrc,tsr .presence), ∀(tsd, tsr) ∈ E (8) We maximize the total number of rider participants (1) when each rideshare trip has to start after both the earliest rider and earliest driver start (2) and end before both the latest rider and latest driver arrivals (3). Each rideshare trip duration (4) has to be greater than the rider’s shortest path (5). At any time, each driver’ car occupancy does not exceed the number of available seats (6). A rider can only be in at most one rideshare trip (7). Shifters, i.e., drivers willing to change role, cannot be both a rider and driver (8). Assessing the quality of ridesharing schemes The experiments have been run on ridesharing trip adverts of 4 regions collected during a period of 12 months. Quality of ride matches found by typical search w.r.t. feasible-matches Typical search T45 # edges # feasible found # feasible # unfeasible found # feasible not found precision recall region 1 802 647 588 214 59 0.733 0.909 region 2 559 364 326 233 38 0.583 0.896 region 3 1678 1691 1616 62 75 0.963 0.956 region 4 4223 3590 3326 897 264 0.788 0.926 In regions 3 and 4, the typical search performs well while regions 1 and 2 represent cases where inappropriate match suggestions and missing proposals can act as a disincentive for users. Assessing the optimal ride matches scheme with a new hypothesis FM represents the ride sharing scheme for Feasible Matches. T45FM represents the feasible matches found by a typical search. After observing an imbalance among participants (not enough riders cf 2nd column), we also assess the heuristic where drivers also accept to become riders (i.e., shifters) cf FMDS and T45FMDS. region 3 # users # riders / # drivers # matched riders matched drivers % unmatched FM 1871 0.67 656 328 47.41 T45FM 630 332 48.58 FMDS 1871 1.67 1392 321 8.44 T45FMDS 1340 316 11.49 For region 3, the table shows the potential gain to reduce the unmatched participants by up to 80% by persuading drivers to become passengers. Moreover, even if the solving time for small instances (<1000 users) (regions 1 and 2) is less than 10 sec, the solving time drastically increases for the largest instances, regions 2 and 3. We will address this issue in future works. references • Data analytics and optimisation for assessing a ride sharing system, V.A., J.H., N.M., K.B. in Intelligent Data Analysis 2015 • Cumulative constraint problem for assessing a ride sharing system V.A., N.M., K.B. workshop BPPC 15 in Constraint Programming conference 2015 This work is supported by Science Foundation Ireland (SFI) Grant 10/IN.1/I3032 and FP7 FET-Open Grant 284715. The Insight Centre for Data Analytics is supported by SFI Grant SFI/12/RC/2289.