
Recommended
Recommended
More Related Content
Similar to Possible Decision Rules to Allocate Quotas and Reservations to Ensure Equity for Nepalese Poor
Similar to Possible Decision Rules to Allocate Quotas and Reservations to Ensure Equity for Nepalese Poor (20)
Recently uploaded
Recently uploaded (20)
Possible Decision Rules to Allocate Quotas and Reservations to Ensure Equity for Nepalese Poor
- 1. 149 Economic Journal of Development Issues Vol. 17 & 18 No. 1-2 (2014) Combined Issue Possible Decision Rules to Allocate Quotas and Reservations to Ensure Equity for Nepalese Poor* Shishir Shakya** Nabraj Lama*** Abstract Government of Nepal provides quotas and reservations for women, indigenous nationalities, Madhesi, untouchables, disables and people of backward areas. These statuses are not homogenous in economic sense. We proposed few other decision trees (rules) that can predict household poverty in Nepal based on 14,907 household observations employing classification and regression tree (CART) approach. These decision rules were based on few practically answerable questions (for respondents) and can be cross checked easily by the enumerators. We modeled 5 different scenarios that respondents were likely to answer the asked questions. These decision rules were 94% to in worst-case scenario 70% accurate in out-of-sample dataset. These proposed meaningful decision rules can be helpful on policy making and implementation that relate to positively discriminate (quota and reservation) for those who lie below poverty line. Key words: Caste/Ethnicity, Nepal, poverty and equity, quotas and reservations, decision tree INTRODUCTION Nepal is a beautiful mosaic of various racial and cultural groups. It is one of the most diverse countries in the world, in terms of culture, ethnicity, religion and language. There are more than 125 caste/ethnic groups and more than 100 languages (CBS, 2012). Nepal is rich in diversity but suffers from poverty. According to World Bank (2001), “Poverty is pronounced deprivation in wellbeing”. Wellbeing is more often associated with an access to goods and services and, people are said to be better off if they have an access to resources and vice versa (Haughton & Khandker, 2009). As reported in Global Finance1 , Nepal is among the poorest 20 countries in the world with $ 1347 as GDP purchasing power parity. Poverty is chiefly viewed from geographical, political boundary and development status, like urban and rural but not from individual caste/ ethnicity basis although the importance of caste/ethnicity has been realized nationally and internationally. UNDP Nepal publishes, Nepal Human Development Reports, where poverty has been re-analyzed based on caste/ethnicity from CBS data set but * This research was completed when both authors were pursuing Masters of Arts in Economics in Patan Multiple Campus, Tribhuvan University **Mr. Shakya is Faculty of Economics, Himalayan Whitehouse International College, Graduate School of Management, Kathmandu *** Mr. Lama is Monitoring and Evaluation Officer, Heifer International Nepal, Kathmandu. 1 https://www.gfmag.com/global-data/economic-data/the-poorest-countries-in-the-world Shishir Shakya
- 2. 150 Economic Journal of Development Issues Vol. 17 & 18 No. 1-2 (2014) Combined Issue their analysis is based only on broader 11 categories. Such broader category does not represent the distinct features of all caste/ethnicities belonging to same categories, since they are not homogenous. Due to heterogeneity among the people within same caste/ ethnicity, it skeptics that the categorization of different caste/ethnicity in a broader group may not represent their respective status on actual way. Diversities of caste/ethnicity have become an important issue of intellectual, political, economic and development discourses in both international and national arenas. Internationally, International Labor Organization (ILO) convention 169 has raised the issue on rights of indigenous nationalities and as Nepal being the signatory country; it was compulsion for government of Nepal to comply with provisions of convention. As a response, some positive discrimination based on caste/ethnicity has already initiated and penetrated harder in major spare of political, economic and social life. National Foundation for Development of Indigenous Nationalities (NFIDN) Act 2002 has listed 59 caste/ethnicities as indigenous nationalities of Nepal and targeted benefits have been allocated to the groups in different forms. Similarly, some caste/ethnicities are listed as endangered and marginalized and such caste/ethnicities are given social protection allowance as well. Government of Nepal has been providing quota and reservation on categorical basis to women, indigenous nationalities, Madhesi, untouchables, disables and people of backward areas, although the statuses are not homogenous in economic sense. This paper takes an initiative to access level of poverty based on caste/ethnicity, household size, and number of mobile phone in household, per month expenditure on food, education and mobile. Answers on these strategic questions, can access the poverty status of individual family on more comprehensive, logical and practical manner. Therefore, our research objective is to predict the poverty status of household based upon these strategic questions. In addition, we argue that the government of Nepal should allocate economic upliftment scheme to households below poverty line not only based on belonging to specific caste/ethnicity, gender and other but it also should incorporate strategic questions that are discussed in the paper. METHODOLOGY Data This paper tries to perform a predictive analysis of Nepalese poverty employing the raw data of Social Inclusion Atlas – Ethnographic Profile (SIA-EP) research project conducted by Central Department of Sociology/Anthropology, Tribhuvan University. It consists of detailed Socio-economic characteristics data of 14709 households across Nepal for 98 various caste/ethnicity. Possible Decision Rules to Allocate ...
- 3. 151 Economic Journal of Development Issues Vol. 17 & 18 No. 1-2 (2014) Combined Issue The poverty is determined on the basis of poverty line indicated by Nepal Living Standard Survey (NLSS III), CBS (2011) for each development region, belt, urban and rural. The poverty line was adjusted for year 2012 based on National Consumer Price Index published by Nepal Rastra Bank (the Central Bank of Nepal). Then we define the state of poverty as categorical dependent variable. If the difference of household income and poverty line indicated by NLSS III was positive we level those household as "APL" (above poverty line) and for the negative difference we leveled as "BPL" (below poverty line). Classification and Regression Trees Classification and regression trees (CARTs) are a type of predictive modeling and recursive partitioning based on data mining algorithm (Breiman, Friedman, Olshen & Stone, 1984). It detects possible decision rules and charts decision tree that fits response variables (categorical or continuous) to given sets of explanatory variables. Decision tree generated by CART is easy to transcribe thus it is appreciated as glass box techniques. Therefore, decision trees are famous in data mining (Chen, Hsu & Chou, 2003). Unlike other statistical methods, decision trees CARTs are free from parametric and structural assumptions (Kim,1995) such as linearity, normality, and equal variance (Horner, Fireman & Wang, 2010; Oh & Kim, 2010) require little apriori knowledge or theories regarding which variables are related, how can nonlinear problems be handled , and are ideal for determining patterns, segmentations, stratifications, predictions and data reductions/screening (Atkins, Burdon & Allen,2007) and deriving models from large noisy datasets obtained from surveys (Chen, Hu & Tang, 2009). CARTs are less sensitive to outliers and extremes values as well. To generate the best classification prediction with regard to the target variable, CART filters and splits the best explanatory variables iteratively into binary sub-groups (nodes) such that the samples within each subset are more homogenous (Atkins et al.,2007). Thus, it creates decision tree. CART algorithm uses Gini index2 measure as the splitting criteria and does only binary splitting (Bozkir & Sezer, 2011). Gini index generalizes the variance impurity – the variance of a distribution associated with two classes (Brown & Myles, 2009). This is a recursive process as it repeats until a pre- defined measure of homogeneity/purity (or other measure of completion) is satisfied. It should be noted that the same predictor variable may be used a number of times at different levels of the tree (Atkins et al., 2007). 2 Gini index here is the measure of impurity of nodes and should not be interpreted as Gini co- efficient that measures the income dispersion. Shishir Shakya
- 4. 152 Economic Journal of Development Issues Vol. 17 & 18 No. 1-2 (2014) Combined Issue A complete decision tree can grow quite large and/or complex and over fits the data. Pruning and cross-validation simplifies the growth of tree and improve the stability and predictive accuracy (Kim & Upneja, 2014). An n -fold (with 103 −=n ) cross validation is a common empirical approach to optimize tree growth (Brown & Myles, 2009). It is a re-sampling technique that uses multiple random training and validating sub samples. The detailed algorithms upon which the decision tree is defined may be found in Breiman et al. (1984). RESULTS AND DISCUSSION Descriptive Statistics The research objective is to perform a predictive analysis of which household can be above or below poverty level. We want to find the best feature variable or questions on which the out-of-sample respondents are more likely to answer and surveyor can cross check. The list of variable used for models are given in Table-1. We mainly choose these variables because of high degree of associations with the poverty levels and these variables are answerable. The independent variables in our data set were a mixture of categorical and continuous variables. We performed chi-square test for the categorical variables and F - test for the continuous variables (Oh & Kim, 2010) have also implemented similar approach. Table 1: Details of Variables Used in Various Models Variable Name Descriptions M-1 M-2 M-3 M-4 M-5 caste Caste of household √* √* √* √* √* edu_cat Household head education √ √ — — — catMobile_Phone_no Number of mobile phone possession √ √ √ √ √* catsource_lh Household source of livelihood √ √ √ √ √ catTV_no Number of TV possession √ √ √ √ √ catComputer_Laptop_no Number of Laptop/Computer √ √ √ √ √ catBike_no Number of Bike possession √ √ √ √ √ own_house House ownership √ √ √ √ √ hhexppm Per month total HH expenditure √* — — — — foodpm, Per month HH food expenditure √ √* √* — — edupm, Per month HH education expenditure √ √* — — — hhsize, Size of household √* √* √* √* √* phonepm, Per month HH phone expenditure √ √ √ √* — P0 Poverty Status (either APL or BPL) √ √ √ √ √ Note: M-1, M-2, M-3, M-4 and M-5 represent model 1, 2,3,4 and 5 respectively. The variable which were feed into the model are marked with √, the variable which were dropped are marked with — and the variable which made model to gain maximum possible predictive accuracy are marked with √*. Poverty level is dependent variable and rest are independent variables. Possible Decision Rules to Allocate ...
- 5. 153 Economic Journal of Development Issues Vol. 17 & 18 No. 1-2 (2014) Combined Issue Table-A in annex shows the portion of population above and below poverty for each caste. The chi-square test for caste )01.0,2510.35( 2 <= pχ , household head education )01.0,997.16( 2 <= pχ , possessions of number of mobile phone )01.0,663.39( 2 <= pχ , TV )01.0,97.645( 2 <= pχ , laptop/computer )01.0,22.894( 2 <= pχ , bike )01.0,413.86( 2 <= pχ , household source of livelihood )01.0,626.84( 2 <= pχ , house ownership status )01.0,215.13( 2 <= pχ were found to be significantly associated with poverty status. Further we found, per month total household expenditure )01.0,1805( <= pF , food expenditure )01.0,3.970( <= pF , per education expenditure )01.0,797( <= pF , phone expenditure )01.0,6.167( <= pF and household size )01.0,7.640( <= pF significantly associated with poverty status. Decision Tree Generation Among14709household,thedatawasdividedrandomlyintotraining(70%)andtesting set (30%) using random seed3 11111 in R4 . For the training dataset 10296 households and for testing or validation 4413 households’ observations were considered respectively. Models were developed in training dataset while their predictive capabilities were checked in testing dataset. We develop five different models as five possible strategies in various cases. The list of variable included in each model/case is given in Table-1. Model-1 contains total households’ per month expenditure, but such expenditure are volatile are likely to be suppressed by respondents. Under the assumption that total household expenditure cannot be accessed easily we dropped this variable in model-2. To include the household with no education, we drop the household head education and per month education expenditure variable in model-3. Again, we dropped the food expenditure variable in model-4 but included mobile phone expenditure per month variable assuming household respondent may know their mobile phone expenditure among other expenditures. Finally, to model the worst case scenario, in model-5 we dropped all the variable related to money and included non monetary feature variables only. For each model, we implement "rpart" function of package called rpart5 in R to grow decision tree. It uses Gini index as a measure of impurity. We performed pruning and 3 Random seed initializes the pseudorandom number generator. 4 R is a language and environment for statistical computing and graphics (http://www.r-project.org/). 5 Recursive Partitioning and Regression Tress package developed by Terry M. Therneau, Beth Shishir Shakya
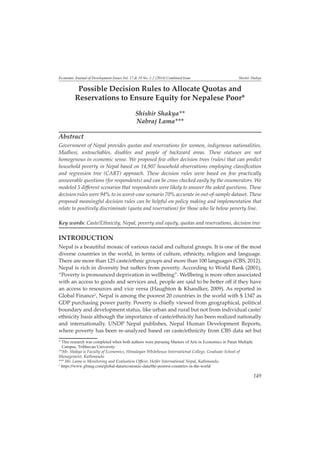
- 6. 154 Economic Journal of Development Issues Vol. 17 & 18 No. 1-2 (2014) Combined Issue 10-fold cross-validation to suppress over fitting problem, to simplify the tree and to enhance predictability. Decision Tree Results Interpretation This research only interpret the result of Model-2 (see Figure-1) while results of rest of the models are kept at Annex and left for the readers. The probability of being above poverty line is 91% for those household whose size is less than 7 and whose per month food expenditure is above 5910 Nrs. For household having more than 6 members who can spend 10458 Nrs per month in household food consumption is 85% likely to be above poverty line. But for households whose per month food expenditure is between 5910 Nrs and 10458 Nrs, educational expenditure determines the probability of being above or below poverty line. If these household spend more than 2206 Nrs per month for education, they are 78% likely to be above poverty line, while if they fail, they are only 30% likely to be above poverty line. Household less than 5 members, having per month food expenditure less than 5910 Nrs whose caste falls in "Grp-2" (see Figure-1 note) are 93% likely to be above poverty line. This caste group, if have household size less than 4 are 79% likely to be above poverty line. If the household size is exactly 4, and if they spend more than 591 Nrs in per month education then they are 75% likely or less than 591 Nrs in education then they are only 23% likely to be above poverty line. The data shows the educational expenditure is associated with poverty. Being able to pay for education have really liberated these household to be out of poverty. The household who spend in between 4100 Nrs to 5910 Nrs per month on food and size being more than 4 and who fall in "Grp-1" (see Figure-1 note) are only 63% likely to be above poverty line. Or if, their food per month spending is less than 4100 Nrs, then they are only 27% likely to be above poverty line. We consider this caste as "Grp-1". For these castes food expenditure is most crucial to be out of poverty. The household with more than 4 members whose food expenditure is less than 5910 Nrs per month, if are able to spend more than 1633 Nrs on education are 62% likely to be above of poverty line, if they spend less than 1633 Nrs, their probability to be out of poverty drastically retrench to only 16%. Atkinson and Brian Ripley (2011) was accessed by authors from http://CRAN.R-project.org/ package=rpart. Possible Decision Rules to Allocate ...
- 7. 155 Economic Journal of Development Issues Vol. 17 & 18 No. 1-2 (2014) Combined Issue Figure 1: Decision Tree of Model-2 Note: Bangali, Bantar, Barae, Bing/Binda, Chepang, Chidimar, Dewat, Dhobi, Dom, Halkhor, Kahar, Kisan, Kurmi, Kuswadiya, Lodha, Mallah, Meche, Munda, Musahar, Nuniya, Raji, Ram, Raute, Santhal/Satar, Tamang, Tatma, Thami are considered in "Grp-1". The "Grp-2" consists Badhae, Badi, Baniya, Bhediyar/Gaderi, Bhote, Bote, Brahman (Hill), Brahman (Tarai), Brahmu/ Baramu, Byangsi, Chhantal, Chhetri, Damai/Dholi, Danuwar, Darai, Dhagar/Jhagar, Dhanuk, Dhimal, Dhunia, Dura, Dusadh/Paswan/Pasi, Gaine, Gangai, gharti/Bhujel, Gurung, Hajam/ Thakur, Haluwai, Hayu, Jaine, Jirel, Kalwar, Kamar, Kami, Kayastha, Khatwe, Koche, Koiri, Kumal, Kumhar, Kunu, Lepcha, Limbu, Lohar, Magar, Majhi, Mali, Marwadi, Muslim, Newar, Nurang, Pahari, Punjabi/Sikh, Rai,Rajbansi, Rajbhar, Rajput, Sanyasi, Sarki, Sherpa, Sonar, Sudhi, Sunuwar, Tajpuriya, Teli/Chamar/harijan,Thakali, Thakuri, Tharu, Walung, Yadav, Yakkha and Yehlmo. The probability of being above poverty line is in between parenthesis. Out of Sample Predictive Accuracy We have developed five models in training data set and derived rules via decision trees. We have implemented these rules on the testing dataset and checked their predictive accuracy. The overall accuracy of models is given in Table-2. While we relaxed the Shishir Shakya
- 8. 156 Economic Journal of Development Issues Vol. 17 & 18 No. 1-2 (2014) Combined Issue monetary variables, as we proceed from model-1 to model-5, the accuracy fell. We develop a worst case scenario in model-5 where the respondents were only asked their caste, household size and number of mobile phone possession. We observed 70% overall accuracy. Sensitivity or true positive rate is the power of model to correctly identify household below poverty line cases. While, specificity or true negative rate is the power of model to correctly identify household above poverty line cases. The sensitivity is found less than specificity in all models. The positive predictive value (PPV) or precision of model is also less than the negative predictive value (NPV) model. Table 2: Predictive Accuracy of the Models Models Model-1 Model-2 Model-3 Model-4 Model-5 Reference BPL APL BPL APL BPL APL BPL APL BPL APL BPL 1726 95 1458 411 1290 434 1171 543 1172 598 APL 169 2423 437 2107 605 2084 724 1975 723 1920 Accuracy 0.9402 0.8078 0.7646 0.7129 0.7007 95% CI (0.9328, 0.947) (0.7959, 0.8194) (0.7518, 0.777) (0.6993, 0.7262) (0.6869, 0.7141) Sensitivity 0.9108 0.7694 0.6807 0.6179 0.6185 Specificity 0.9623 0.8368 0.8276 0.7844 0.7625 PPV 0.9478 0.7801 0.7483 0.6832 0.6621 NPV 0.9348 0.8282 0.775 0.7318 0.7264 Note: The predictions were made on testing dataset using decision rules derived by training dataset. CONCLUSION This paper performed a predictive analysis of Nepalese poverty. Five decision trees were generated under some practical assumptions employing randomly selected 70% of entire data. The decision rules derived from these five models were tested on remaining 30% of test data. The decision rules were found to be 94% to in worst case 70% accurate in test data. Here we incorporated few features of poverty among numerous possible. These features are readily answerable and accessible from out-of- sample respondents. We suggest, Government of Nepal to incorporate these decision rules in addition to existing system. Employing these rule can ensure more equity for those who are poor regardless of only being women, indigenous nationalities, Madhesi, untouchables, disables and people of backward areas. Acknowledgement: We are very grateful for the critical remarks made by the two anonymous referees of this Journal, which have significantly improved the depth of analysis of the paper. I also thank the Executive Editor of EDJI, Associate Professor Madhav Prasad Dahal for his encouragement. The usual disclaimer applies and views are the sole responsibility of the authors. Possible Decision Rules to Allocate ...
- 9. 157 Economic Journal of Development Issues Vol. 17 & 18 No. 1-2 (2014) Combined Issue Annex -I Table -A: Portion of Household Above and Below Poverty Line on Various Caste/ Ethnicity Caste APL BPL Caste APL BPL Caste APL BPL Lodha 0.10 0.90 Meche***** 0.48 0.52 Muslim 0.64 0.36 Chepang**** 0.12 0.88 Rajbhar 0.48 0.52 Thakuri 0.66 0.34 Raute***** 0.14 0.86 Lepcha***** 0.49 0.51 Dhimal*** 0.68 0.32 Kuswadiya***** 0.14 0.86 Bantar 0.50 0.50 Tajpuriya*** 0.70 0.30 Kisan***** 0.15 0.85 Danuwar**** 0.50 0.50 Mali 0.70 0.30 Kahar 0.18 0.82 Bangali 0.51 0.49 Gangai 0.72 0.28 Halkhor 0.21 0.79 Koche 0.51 0.49 Teli/Chamar/harijan 0.73 0.27 Chidimar 0.24 0.76 Jirel** 0.51 0.49 Damai/Dholi 0.74 0.26 Nuniya 0.25 0.75 Badi 0.52 0.48 Gurung** 0.74 0.26 Munda 0.26 0.74 Bote**** 0.54 0.46 Rai** 0.74 0.26 Dhobi 0.28 0.72 Khatwe 0.54 0.46 Kalwar 0.76 0.24 Raji***** 0.28 0.72 Bhote*** 0.55 0.45 Dhanuk**** 0.76 0.24 Mallah 0.36 0.64 Kami 0.55 0.45 Haluwai 0.76 0.24 Thami**** 0.36 0.64 Sonar 0.56 0.44 Brahman (Hill) 0.77 0.23 Hayu***** 0.38 0.62 Kumhar 0.57 0.43 Kumal*** 0.77 0.23 Dewat 0.39 0.61 Dhagar/Jhagar**** 0.58 0.42 Magar** 0.78 0.22 Kurmi 0.39 0.61 Yehlmo 0.58 0.42 Yadav 0.78 0.22 Kamar 0.40 0.60 Chhetri 0.59 0.41 Byangsi** 0.79 0.21 Santhal/Satar**** 0.40 0.60 Dura*** 0.59 0.41 Punjabi/Sikh 0.81 0.19 Tamang*** 0.40 0.60 Yakkha** 0.59 0.41 Rajput 0.81 0.19 Nurang 0.40 0.60 Badhae 0.59 0.41 Brahman (Tarai) 0.85 0.15 Bing/Binda 0.41 0.59 Bhediyar/Gaderi 0.59 0.41 Chhantal** 0.85 0.15 Musahar 0.41 0.59 Brahmu/Baramu**** 0.59 0.41 Sudhi 0.85 0.15 Dom 0.42 0.58 Darai*** 0.60 0.40 Kayastha 0.86 0.14 Barae 0.43 0.57 Tharu*** 0.60 0.40 Limbu** 0.86 0.14 Dhunia 0.43 0.57 Lohar 0.61 0.39 Baniya 0.87 0.13 Ram 0.45 0.55 Sanyasi 0.61 0.39 Newar* 0.87 0.13 Sarki 0.45 0.55 Gaine 0.61 0.39 Marwadi 0.93 0.07 Sunuwar*** 0.45 0.55 Koiri 0.61 0.39 Jaine 0.95 0.05 Hajam/Thakur 0.46 0.54 Kunu 0.62 0.38 Sherpa** 0.97 0.03 Majhi**** 0.47 0.53 Rajbansi*** 0.63 0.38 Thakali* 0.97 0.03 Tatma 0.47 0.53 gharti/Bhujel*** 0.63 0.37 Walung*** 0.98 0.02 Dusadh/Paswan/Pasi 0.47 0.53 Pahari*** 0.63 0.37 Note: APL /BPL represents portion of population above/below poverty line. Marked with *are prosperous caste, ** are benefit excluded caste, *** are marginalized caste, ****Highly marginalized caste and ***** are endangered group. (Source: NFDIN (N.D). Categorization Notice. Lalitpur: National Foundation for Development of Indigenous Nationalities (NFDIN), Government of Nepal.) Shishir Shakya
- 10. 158 Economic Journal of Development Issues Vol. 17 & 18 No. 1-2 (2014) Combined Issue Annex II Figure 2: Decision Tree of Model 1 Note: "Grp-3" referes to Badhae, Bangali, Bhote, Bing/Binda, Brahman (Hill), Brahman(Tarai), Chepang, Chhetri, Chidimar, Darai, Dom, Gaine, gharti/Bhujel, Hajam/Thakur, Halkhor, Hayu, Jirel, Kami, Kayastha, Kurmi, Meche, Munda, Ram, Sanyasi, Sonar, Sunuwar, Thami, and Yehlmo. "Grp-4" refers to Badi, Baniya, Bantar, Barae, Bhediyar/Gaderi, Bote, Brahmu/ Baramu, Byangsi, Chhantal, Damai/Dholi, Danuwar, Dewat, Dhagar/Jhagar, Dhanuk, Dhimal, Dhobi, Dhunia, Dura, Dusadh/Paswan/Pasi, Gangai,Gurung, Haluwai, Kamar, Khatwe, Kisan, Koche, Koiri, Kumal, Kumhar, Kunu, Kuswadiya, Lepcha, Limbu, Lodha, Lohar, Magar, Majhi, Mali, Mallah, Musahar, Muslim, Nuniya, Nurang, Pahari, Punjabi/Sikh, Rajbansi, Rajbhar, Raji, Rajput, Raute, Santhal/Satar, Sarki,Sudhi, Tajpuriya, Tamang, Tatma, Teli/Chamar/harijan, Thakuri, Tharu, Yadav, Yakkha. Possible Decision Rules to Allocate ...
- 11. 159 Economic Journal of Development Issues Vol. 17 & 18 No. 1-2 (2014) Combined Issue Figure 3: Decision Tree of Model 3 Grp-5 Bangali,Bantar,Barae,Bing/Binda,Chepang,Chidimar,Dewat,Dhobi,Dom,Halkhor,Kahar,Kisa n,Kurmi,Kuswadiya,Lodha,Mallah,Meche,Munda,Musahar,Nuniya,Raji,Ram,Raute,Santhal/ Satar,Tamang,Tatma,Thami Grp-6 Badhae, Badi, Baniya, Bhediyar/Gaderi, Bhote, Bote, Brahman (Hill),Brahman (Tarai), Brahmu/Baramu, Byangsi,Chhantal,Chhetri,Damai/Dholi,Danuwar,Darai,Dhagar/Jhagar,Dhanuk,Dhimal,Dhunia,Dura, Dusadh/Paswan/Pasi,Gaine,Gangai,gharti/Bhujel,Gurung,Hajam/Thakur,Haluwai,Hayu,Jaine,Jirel,Kal war,Kamar,Kami,Kayastha,Khatwe,Koche,Koiri,Kumal,Kumhar,Kunu,Lepcha,Limbu,Lohar,Magar,Ma jhi,Mali,Marwadi,Muslim,Newar,Nurang,Pahari,Punjabi/Sikh,Rai,Rajbansi,Rajbhar,Rajput,Sanyasi,Sar ki,Sherpa,Sonar,Sudhi,Sunuwar,Tajpuriya,Teli/Chamar/harijan,Thakali,Thakuri,Tharu,Walung,Yadav,Y akkha,Yehlmo Grp-7 Badhae,Bangali, Baniya, Barae, Bhote, Bing/Binda, Byangsi, Chepang, Chidimar, Darai, Dewat, Dhagar/Jhagar, Dhimal, Dhunia, Dom, gharti/Bhujel, Halkhor, Jirel, Kahar, Kalwar, Kamar, Kisan, Kurmi, Lodha, Mallah, Munda, Musahar, Nuniya, Rajbansi, Raji, Rajput, Ram, Raute, Santhal/ Satar, Sarki, Sherpa, Sonar, Sudhi, Tajpuriya, Tatma, Thami, Tharu, Yehlmo Grp-8 Badi, Bantar, Bote, Brahman (Hill),Brahman (Tarai), Brahmu/Baramu, Chhetri, Damai/Dholi, Danuw ar,Dhanuk,Dhobi,Dura,Dusadh/Paswan/Pasi,Gaine,Gangai,Gurung,Hajam/Thakur,Haluwai,Hayu,Jain e,Kayastha,Koche,Koiri,Kumal,Kumhar,Kunu,Lepcha,Lohar,Magar,Majhi,Mali,Marwadi,Meche, Musl im,Newar,Nurang,Pahari,Punjabi/Sikh,Rai,Rajbhar,Sanyasi,Sunuwar,Tamang,Teli/Chamar/harijan,Tha kali,Thakuri,Walung,Yadav,Yakkha Grp-9 Badhae,Badi,Bangali,Bantar,Barae,Bhediyar/Gaderi,Bhote,Bing/Binda,Chepang,Chidimar,Danuwar,D ewat,Dhagar/Jhagar,Dhimal,Dhobi,Dhunia,Dom,Dusadh/Paswan/Pasi,Gaine,Halkhor,Hayu,Jirel,Kah ar,Kalwar,Kamar,Khatwe,Kisan,Koche,Kumhar,Kurmi,Kuswadiya,Lodha,Lohar,Mali,Mallah,Meche, Munda,Musahar,Muslim,Nuniya,Nurang,Rai,Rajbansi,Rajbhar,Raji,Ram,Raute,Sarki,Sherpa,Tamang, Tatma,Thami,Yakkha,Yehlmo Grp-10 Baniya,Bote,Brahman (Hill),Brahman (Tarai),Brahmu/Baramu,Byangsi,Chhantal,Chhetri,Damai/Dholi ,Darai,Dhanuk,Dura,Gangai,gharti/Bhujel,Gurung,Hajam/Thakur,Haluwai,Jaine,Kami,Kayastha,Koiri, Kumal,Kunu,Lepcha,Limbu,Magar,Majhi,Marwadi,Newar,Pahari,Punjabi/Sikh,Rajput,Santhal/Satar,Sa nyasi,Sonar,Sudhi,Sunuwar,Tajpuriya,Teli/Chamar/harijan,Thakali,Thakuri,Tharu,Walung,Yadav Shishir Shakya
- 12. 160 Economic Journal of Development Issues Vol. 17 & 18 No. 1-2 (2014) Combined Issue Figure 4: Decision Tree of Model-4 Grp-11 Badi,Bangali,Bantar,Barae,Bhote,Bing/Binda,Chepang,Chidimar,Danuwar,Dewat,Dhobi,Dh unia,Dom,Dusadh/Paswan/Pasi,Hajam/Thakur,Halkhor,Hayu,Jirel,Kahar,Kamar,Khatwe,K isan,Kumhar,Kurmi,Kuswadiya,Lepcha,Lodha,Majhi,Mallah,Meche,Munda,Musahar,Nuni ya,Nurang,Rajbhar,Raji,Ram,Raute,Santhal/Satar,Sarki,Sunuwar,Tamang,Tatma,Thami,Yehl mo Grp-12 Badhae,Baniya,Bhediyar/Gaderi,Bote,Brahman (Hill),Brahman (Tarai), Brahmu/Baramu, Byangsi, Chhantal, Chhetri, Damai/Dholi, Darai,Dhagar/Jhagar, Dhanuk,Dhimal, Dura,Gaine,Gangai, Gharti/Bhujel, Gurung,Haluwai,Jaine,Kalwar,Kami,Kayastha,Koche,K oiri,Kumal,Kunu,Limbu,Lohar,Magar,Mali,Marwadi,Muslim,Newar,Pahari,Punjabi/Sikh,Ra i,Rajbansi,Rajput,Sanyasi,Sherpa,Sonar,Sudhi,Tajpuriya,Teli/Chamar/harijan,Thakali,Thaku ri,Tharu,Walung,Yadav,Yakkha Grp-13 Chepang,Chidimar,Dhobi,Halkhor,Kahar,Kisan,Kuswadiya,Lodha,Munda,Nuniya,Raji,Raute Grp-14 Badi,Bangali,Bantar,Barae,Bhote,Bing/Binda,Danuwar,Dewat,Dhunia,Dom,Dusadh/ Paswan/Pasi,Hajam/Thakur,Hayu,Jirel,Kamar,Khatwe,Kumhar,Kurmi,Lepcha,Majhi,Malla h,Meche,Musahar,Nurang,Rajbhar,Ram,Santhal/Satar,Sarki,Sunuwar,Tamang,Tatma,Thami ,Yehlmo Grp-15 Badhae,Bhediyar/Gaderi,Bote,Brahman (Hill), Brahmu/Baramu, Chhetri, Damai/Dholi, Darai ,Dhagar/Jhagar, Dhimal,Dura,Gaine,gharti/Bhujel,Gurung,Haluwai,Kalwar,Kami,K oche,Koiri,Kunu,Lohar,Mali,Marwadi,Muslim,Pahari,Rajbansi,Sanyasi,Sonar,Teli/Chamar/ harijan,Thakuri,Tharu,Yakkha Grp-16 Baniya,Brahman (Tarai), Byangsi, Chhantal, Dhanuk, Gangai, Jaine, Kayastha, Kumal, Limbu,Magar,Newar,Punjabi/Sikh,Rai,Rajput,Sherpa,Sudhi,Tajpuriya,Thakali,Walung,Yadav Possible Decision Rules to Allocate ...
- 13. 161 Economic Journal of Development Issues Vol. 17 & 18 No. 1-2 (2014) Combined Issue Figure 5: Decision Tree of Model-5 Grp-17 Badi,Bangali,Bantar,Barae,Bhote,Bing/Binda,Chepang,Chidimar,Danuwar,Dewat,Dhobi,Dhu nia,Dom,Dusadh/Paswan/Pasi,Hajam/Thakur,Halkhor,Hayu,Jirel,Kahar,Kamar,Khatwe,Kisa n,Kumhar,Kurmi,Kuswadiya,Lepcha,Lodha,Majhi,Mallah,Meche,Munda,Musahar,Nuniya,N urang,Rajbhar,Raji,Ram,Raute,Santhal/Satar,Sarki,Sunuwar,Tamang,Tatma,Thami,Yehlmo Grp-18 Badhae,Baniya,Bhediyar/Gaderi,Bote,Brahman (Hill),Brahman (Tarai),Brahmu/Baramu,Byan gsi,Chhantal,Chhetri,Damai/Dholi,Darai,Dhagar/Jhagar,Dhanuk,Dhimal,Dura,Gaine,Ganga i,gharti/Bhujel,Gurung,Haluwai,Jaine,Kalwar,Kami,Kayastha,Koche,Koiri,Kumal,Kunu,Lim bu,Lohar,Magar,Mali,Marwadi,Muslim,Newar,Pahari,Punjabi/Sikh,Rai,Rajbansi,Rajput,Sany asi,Sherpa,Sonar,Sudhi,Tajpuriya,Teli/Chamar/harijan,Thakali,Thakuri,Tharu,Walung,Yadav ,Yakkha Grp-19 Badhae,Bhediyar/Gaderi,Bote,Brahmu/Baramu,Chhetri,Darai,Dhagar/ Jhagar,Dhimal,Dura,Gaine,gharti/Bhujel,Kami,Koche,Koiri,Kunu,Lohar,Mali,Muslim,Pahari, Rajbansi,Sanyasi,Sonar,Thakuri,Tharu,Yakkha Grp-20 Baniya,Brahman (Hill),Brahman (Tarai),Byangsi,Chhantal,Damai/Dholi,Dhanuk,Gangai,Gur ung,Haluwai,Jaine,Kalwar,Kayastha,Kumal,Limbu,Magar,Marwadi,Newar,Punjabi/Sikh,Rai, Rajput,Sherpa,Sudhi,Tajpuriya,Teli/Chamar/harijan,Thakali,Walung,Yadav Grp-21 Chepang,Chidimar,Dhobi,Halkhor,Kahar,Kisan,Kuswadiya,Lodha,Munda,Nuniya,Raji,Raute Grp-22 Badi,Bangali,Bantar,Barae,Bhote,Bing/Binda,Danuwar,Dewat,Dhunia,Dom,Dusadh/Paswan/ Pasi,Hajam/Thakur,Hayu,Jirel,Kamar,Khatwe,Kumhar,Kurmi,Lepcha,Majhi,Mallah,Meche, Musahar,Nurang,Rajbhar,Ram,Santhal/Satar,Sarki,Sunuwar,Tamang,Tatma,Thami,Yehlmo Shishir Shakya
- 14. 162 Economic Journal of Development Issues Vol. 17 & 18 No. 1-2 (2014) Combined Issue References Atkins, J. P., Burdon, D., & Allen, J. H. (2007). An application of contingent valuation and decision tree analysis to water quality improvements. Marine Pollution Bulletin, 55(10-12), 591–602. doi:10.1016/j.marpolbul.2007.09.018 Bozkir, A. S., & Sezer, E. A. (2011). Predicting food demand in food courts by decision tree approaches. Procedia Computel Science, 3, 759–763. doi:10.1016/j. procs.2010.12.125 Breiman, L., Friedman, J.H., Olshen, R.A., & Stone, C.J.(1984). Classification and regression trees. Belmont, California, Wadsworth. Brown, S. D., & Myles, A. J. (2009). Decision tree modeling in classification.In S.D.Brown, R.Tauler and B.Walczak (Eds.). Comprehensive Chemometrics (541- 570).Oxford,UK:Elsevier Scientific. CBS.(2011). Nepal living standard survey 2010/11. Kathmandu: National Planning Commission Secretariat, Government of Nepal. CBS.(2012). National population and housing census 2011 (National Report) (Vol.1). Kathmandu: Government of Nepal. Chen, Y. L., Hsu, C. L., & Chou, S. C. (2003). Constructing a multi-valued and multi- labeled decision tree. Expert Systems with Applications, 25, 199–209. Chen, Y.-L., Hu, H.-W., & Tang, K. (2009). Constructing a decision tree from data with hierarchical class labels. Expert Systems with Applications, 36(3), 4838– 4847. doi:10.1016/j.eswa.2008.05.044 Haughton, J., & Khandker, S. R. (2009). Handbook on poverty and inequality. Washington, DC: The World Bank. Horner, S. B., Fireman, G. D., & Wang, E. W. (2010). The relation of student behavior, peer status, race, and gender to decisions about school discipline using CHAID decision trees and regression modeling. Journal of School Psychology, 48(2), 135–161. doi:10.1016/j.jsp.2009.12.001 Kim, H. (1995). Theory and practice of decision tree induction. The International Journal of Management Science, 23, 637–652. Kim, S. Y., & Upneja, A. (2014). Predicting restaurant financial distress using decision tree and AdaBoosted decision tree models. Economic Modelling, 36, 354–362. doi:10.1016/j.econmod.2013.10.005 NFDIN. (2002). National foundation for development of indigenous nationalities act. Nepal Government, National Foundation for Development of Indigenous Nationalities. Oh, J., & Kim, B. (2010). Prediction model for demands of the health meteorological information using a decision tree method. Asian Nursing Research, 4(3),151–62.doi:10.1016/S1976-1317(10)60015-1 World Bank. (2001). World development report 2000/2001. Washington, D.C.: Oxford University Press. Possible Decision Rules to Allocate ...