Simple regression analysis
•Download as PPTX, PDF•
0 likes•52 views

Formulas of Simple Regression Analysis

Recommended
More Related Content
Similar to Simple regression analysis
Similar to Simple regression analysis (20)
Recently uploaded
Recently uploaded (20)
Simple regression analysis
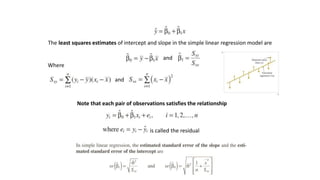
- 1. Note that each pair of observations satisfies the relationship is called the residual The least squares estimates of intercept and slope in the simple linear regression model are and Where and
- 3. is the total corrected sum of squares of y
- 4. CONFIDENCE INTERVAL ON THE MEAN RESPONSE
- 5. Oxygen Purity Confidence Interval on the Mean Response We will construct a 95% confidence interval about the mean response. The fitted model is Suppose that we are interested in predicting mean oxygen purity when x0 = 1.00 % Then 95% confidence interval for x=1.00 is given below
- 9. The statistic R2 should be used with caution because it is always possible to make R2 unity by simply adding enough terms to the model. For example, we can obtain a “perfect” fit to n data points with a polynomial of degree n − 1. In general, R2 will increase if we add a variable to the model, but this does not necessarily imply that the new model is superior to the old one. Unless the error sum of squares in the new model is reduced by an amount equal to the original error mean square, the new model will have a larger error mean square than the old one because of the loss of 1 error degree of freedom. Thus, the new model will actually be worse than the old one. The magnitude of R2 is also impacted by the dispersion of the variable x. The larger the dispersion, the larger the value of R2 will usually be. There are several misconceptions about R2 . In general, R2 does not measure the magnitude of the slope of the regression line. A large value of R2 does not imply a steep slope. Furthermore, R2 does not measure the appropriateness of the model because it can be artificially inflated by adding higher order polynomial terms in x to the model. Even if y and x are related in a nonlinear fashion, R2 will often be large. For example, R2 for the regression equation in Fig. 11-6(b) will be relatively large even though the linear approximation is poor. Finally, even though R2 is large, this does not necessarily imply that the regression model will provide accurate predictions of future observations.
- 10. The statistic R2 should be used with caution because it is always possible to make R2 unity by simply adding enough terms to the model. For example, we can obtain a “perfect” fit to n data points with a polynomial of degree n − 1. In general, R2 will increase if we add a variable to the model, but this does not necessarily imply that the new model is superior to the old one. Unless the error sum of squares in the new model is reduced by an amount equal to the original error mean square, the new model will have a larger error mean square than the old one because of the loss of 1 error degree of freedom. Thus, the new model will actually be worse than the old one. The magnitude of R2 is also impacted by the dispersion of the variable x. The larger the dispersion, the larger the value of R2 will usually be. There are several misconceptions about R2 . In general, R2 does not measure the magnitude of the slope of the regression line. A large value of R2 does not imply a steep slope. Furthermore, R2 does not measure the appropriateness of the model because it can be artificially inflated by adding higher order polynomial terms in x to the model. Even if y and x are related in a nonlinear fashion, R2 will often be large. For example, R2 for the regression equation in Fig. 11-6(b) will be relatively large even though the linear approximation is poor. Finally, even though R2 is large, this does not necessarily imply that the regression model will provide accurate predictions of future observations.