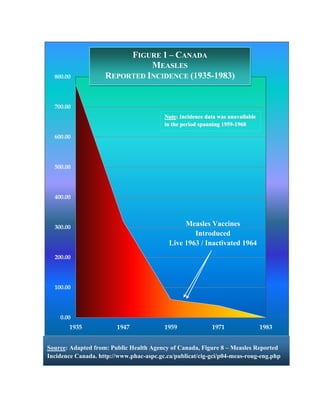
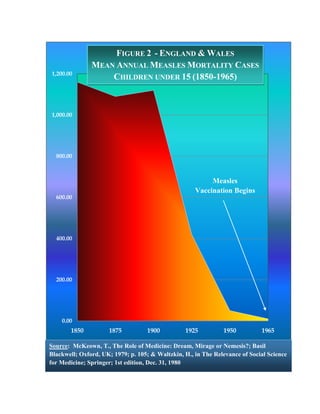
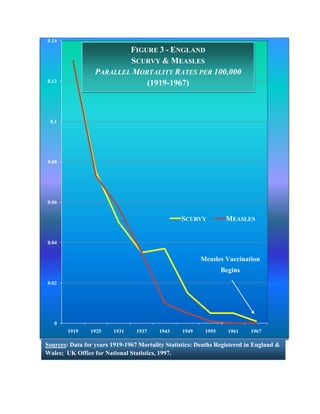
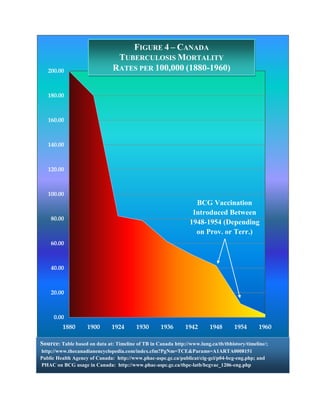
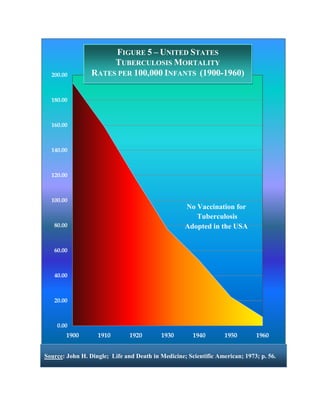
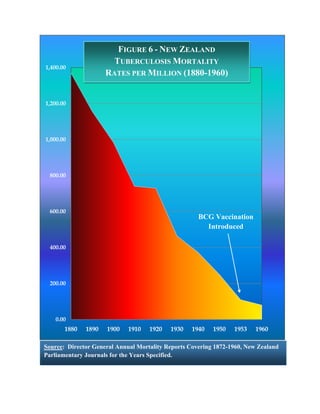
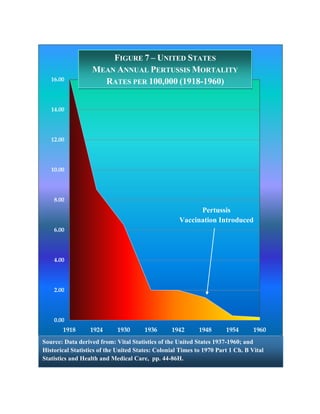
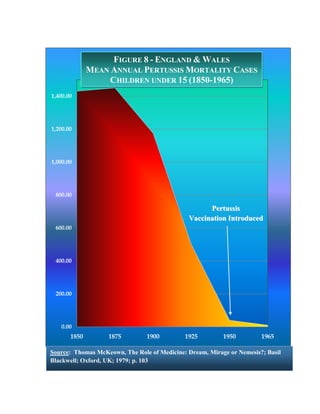
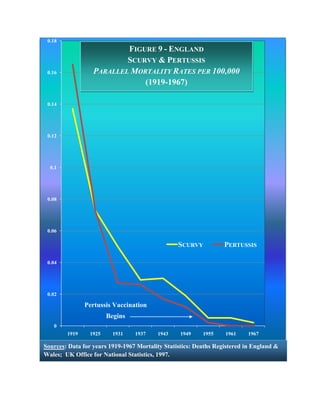
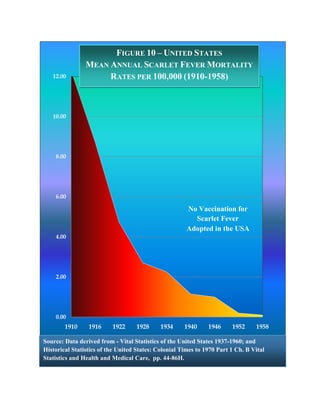
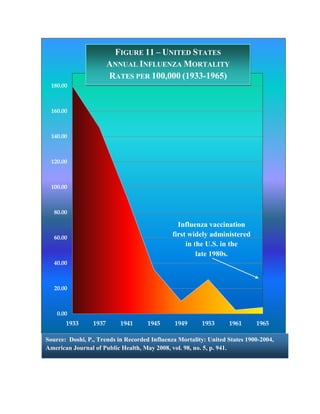
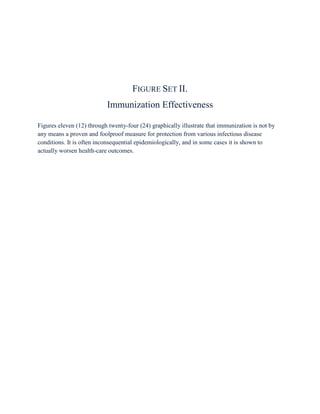
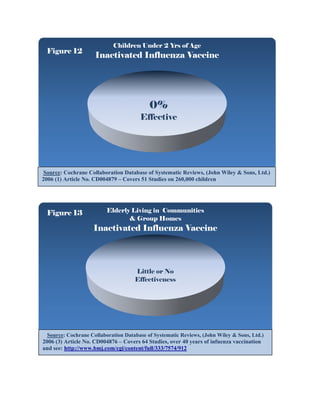
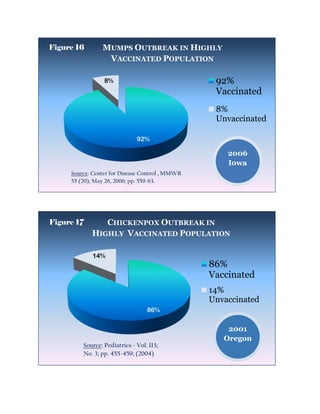
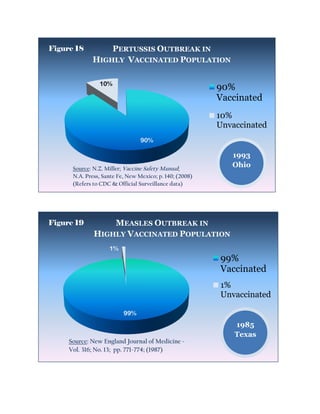
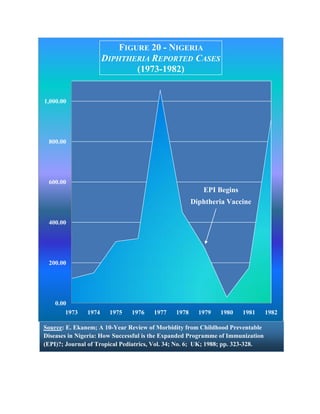
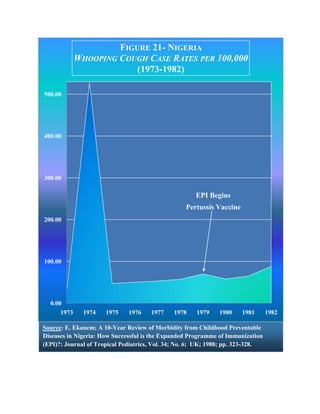
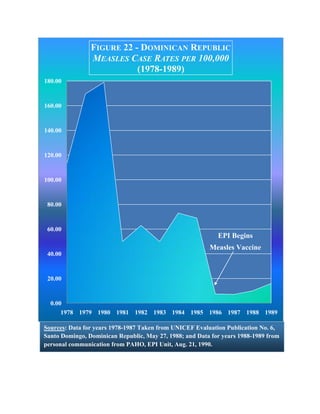
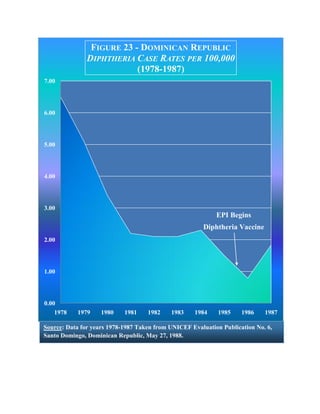
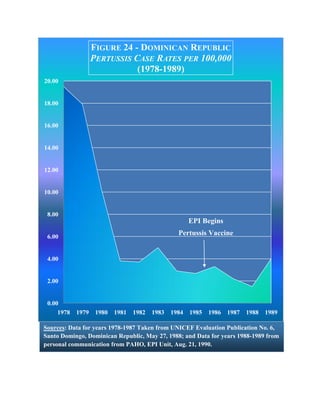
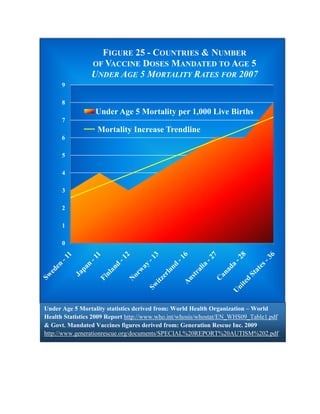
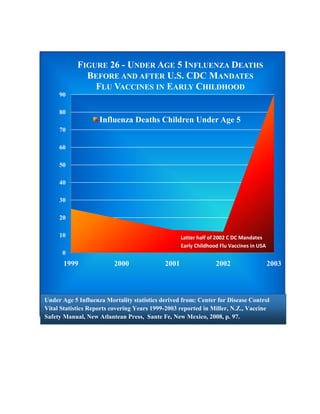
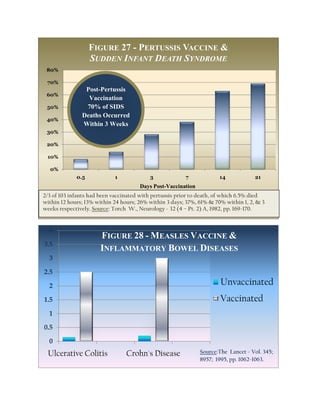
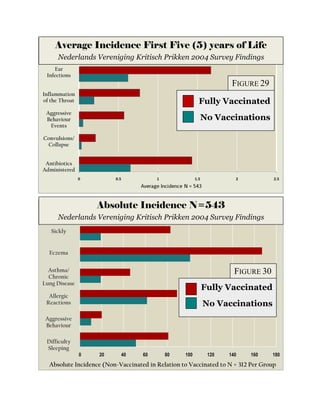
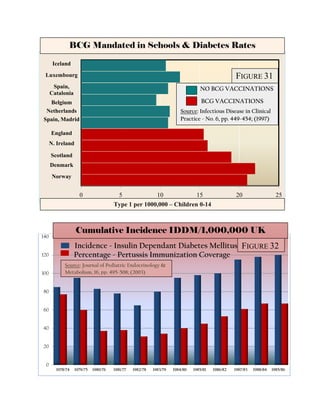
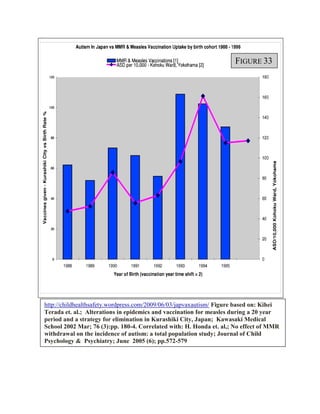
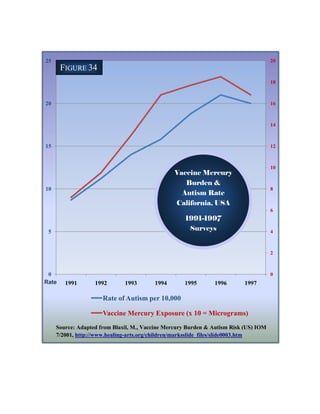
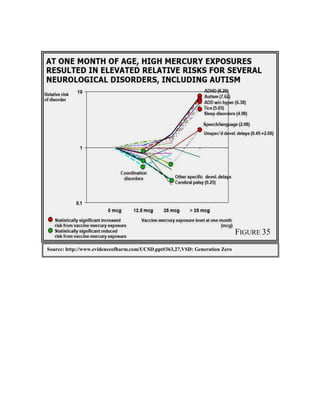
Advertisement
Immunization graphs by R Obomsawin 2009
Advertisement
Immunization graphs by R Obomsawin 2009
Advertisement
Immunization graphs by R Obomsawin 2009
Advertisement
Immunization graphs by R Obomsawin 2009
Advertisement
Immunization graphs by R Obomsawin 2009
Advertisement
Immunization graphs by R Obomsawin 2009
Advertisement
Immunization graphs by R Obomsawin 2009
Upcoming SlideShare
Exodus 20:1-3Exodus 20:1-3
Loading in ... 3
1 of 32
Advertisement

Immunization graphs by R Obomsawin 2009

  1. Immunization Graphs: Natural Infectious Disease Declines; Immunization Effectiveness; and Immunization Dangers Prepared by: Raymond Obomsawin Ph.D. December, 2009
  2. FIGURE SET I. Natural Infectious Disease Declines Preceding Public Immunization Efforts Figures one (1) through eleven (11) graphically illustrate that in North America, Europe, and the South Pacific , major declines in life-threatening infectious diseases occurred historically either without, or far in advance of public immunization efforts for specific diseases as listed. This provides irrefutable evidence that vaccines are not necessary for the effective elimination of a wide range of infectious diseases
  3. FIGURE 1 – CANADA MEASLES 800.00 REPORTED INCIDENCE (1935-1983) 700.00 Note: Incidence data was unavailable in the period spanning 1959-1968 600.00 500.00 400.00 300.00 Measles Vaccines Introduced Live 1963 / Inactivated 1964 200.00 100.00 0.00 1935 1947 1959 1971 1983 Source: Adapted from: Public Health Agency of Canada, Figure 8 – Measles Reported Incidence Canada. http://www.phac-aspc.gc.ca/publicat/cig-gci/p04-meas-roug-eng.php
  4. FIGURE 2 - ENGLAND & WALES MEAN ANNUAL MEASLES MORTALITY CASES 1,200.00 CHILDREN UNDER 15 (1850-1965) 1,000.00 800.00 Measles Vaccination Begins 600.00 400.00 200.00 0.00 1850 1875 1900 1925 1950 1965 Source: McKeown, T., The Role of Medicine: Dream, Mirage or Nemesis?; Basil Blackwell; Oxford, UK; 1979; p. 105; & Waltzkin, H., in The Relevance of Social Science for Medicine; Springer; 1st edition, Dec. 31, 1980
  5. 0.14 FIGURE 3 - ENGLAND SCURVY & MEASLES PARALLEL MORTALITY RATES PER 100,000 0.12 (1919-1967) 0.1 0.08 0.06 SCURVY MEASLES 0.04 Measles Vaccination Begins 0.02 0 1919 1925 1931 1937 1943 1949 1955 1961 1967 Sources: Data for years 1919-1967 Mortality Statistics: Deaths Registered in England & Wales; UK Office for National Statistics, 1997.
  6. FIGURE 4 – CANADA TUBERCULOSIS MORTALITY 200.00 RATES PER 100,000 (1880-1960) 180.00 160.00 140.00 120.00 100.00 BCG Vaccination Introduced Between 80.00 1948-1954 (Depending on Prov. or Terr.) 60.00 40.00 20.00 0.00 1880 1900 1924 1930 1936 1942 1948 1954 1960 Source: Table based on data at: Timeline of TB in Canada http://www.lung.ca/tb/tbhistory/timeline/; http://www.thecanadianencyclopedia.com/index.cfm?PgNm=TCE&Params=A1ARTA0008151 Public Health Agency of Canada: http://www.phac-aspc.gc.ca/publicat/cig-gci/p04-bcg-eng.php; and PHAC on BCG usage in Canada: http://www.phac-aspc.gc.ca/tbpc-latb/bcgvac_1206-eng.php
  7. FIGURE 5 – UNITED STATES TUBERCULOSIS MORTALITY 200.00 RATES PER 100,000 INFANTS (1900-1960) 180.00 160.00 140.00 120.00 100.00 No Vaccination for Tuberculosis 80.00 Adopted in the USA 60.00 40.00 20.00 0.00 1900 1910 1920 1930 1940 1950 1960 Source: John H. Dingle; Life and Death in Medicine; Scientific American; 1973; p. 56.
  8. FIGURE 6 - NEW ZEALAND TUBERCULOSIS MORTALITY 1,400.00 RATES PER MILLION (1880-1960) 1,200.00 1,000.00 800.00 600.00 BCG Vaccination Introduced 400.00 200.00 0.00 1880 1890 1900 1910 1920 1930 1940 1950 1953 1960 Source: Director General Annual Mortality Reports Covering 1872-1960, New Zealand Parliamentary Journals for the Years Specified.
  9. FIGURE 7 – UNITED STATES MEAN ANNUAL PERTUSSIS MORTALITY 16.00 RATES PER 100,000 (1918-1960) 14.00 12.00 10.00 8.00 Pertussis Vaccination Introduced 6.00 4.00 2.00 0.00 1918 1924 1930 1936 1942 1948 1954 1960 Source: Data derived from: Vital Statistics of the United States 1937-1960; and Historical Statistics of the United States: Colonial Times to 1970 Part 1 Ch. B Vital Statistics and Health and Medical Care, pp. 44-86H.
  10. FIGURE 8 - ENGLAND & WALES MEAN ANNUAL PERTUSSIS MORTALITY CASES CHILDREN UNDER 15 (1850-1965) 1,400.00 Children under 15 1,200.00 1,000.00 800.00 Pertussis Vaccination Introduced 600.00 400.00 200.00 0.00 1850 1875 1900 1925 1950 1965 Source: Thomas McKeown, The Role of Medicine: Dream, Mirage or Nemesis?; Basil Blackwell; Oxford, UK; 1979; p. 103
  11. 0.18 FIGURE 9 - ENGLAND SCURVY & PERTUSSIS 0.16 PARALLEL MORTALITY RATES PER 100,000 (1919-1967) 0.14 0.12 0.1 0.08 0.06 SCURVY PERTUSSIS 0.04 0.02 Pertussis Vaccination Begins 0 1919 1925 1931 1937 1943 1949 1955 1961 1967 Sources: Data for years 1919-1967 Mortality Statistics: Deaths Registered in England & Wales; UK Office for National Statistics, 1997.
  12. FIGURE 10 – UNITED STATES MEAN ANNUAL SCARLET FEVER MORTALITY 12.00 RATES PER 100,000 (1910-1958) 10.00 8.00 6.00 No Vaccination for Scarlet Fever Adopted in the USA 4.00 2.00 0.00 1910 1916 1922 1928 1934 1940 1946 1952 1958 Source: Data derived from - Vital Statistics of the United States 1937-1960; and Historical Statistics of the United States: Colonial Times to 1970 Part 1 Ch. B Vital Statistics and Health and Medical Care, pp. 44-86H.
  13. FIGURE 11 – UNITED STATES ANNUAL INFLUENZA MORTALITY RATES PER 100,000 (1933-1965) 180.00 160.00 140.00 120.00 100.00 80.00 Influenza vaccination 60.00 first widely administered in the U.S. in the late 1980s. 40.00 20.00 0.00 1933 1937 1941 1945 1949 1953 1961 1965 Source: Doshi, P., Trends in Recorded Influenza Mortality: United States 1900-2004, American Journal of Public Health, May 2008, vol. 98, no. 5, p. 941.
  14. FIGURE SET II. Immunization Effectiveness Figures eleven (12) through twenty-four (24) graphically illustrate that immunization is not by any means a proven and foolproof measure for protection from various infectious disease conditions. It is often inconsequential epidemiologically, and in some cases it is shown to actually worsen health-care outcomes.
  15. Children Under 2 Yrs of Age Figure 12 Inactivated Influenza Vaccine 0% Effective Source: Cochrane Collaboration Database of Systematic Reviews, (John Wiley & Sons, Ltd.) 2006 (1) Article No. CD004879 – Covers 51 Studies on 260,000 children Figure 13 Elderly Living in Communities & Group Homes Inactivated Influenza Vaccine Little or No Effectiveness Source: Cochrane Collaboration Database of Systematic Reviews, (John Wiley & Sons, Ltd.) 2006 (3) Article No. CD004876 – Covers 64 Studies, over 40 years of infuenza vaccination and see: http://www.bmj.com/cgi/content/full/333/7574/912
  16. Figure 14 BCG for Tuberculosis Note: Tuberculosis higher among two (2) dose Vaccinated versus Placebo Group 0% Effective Source: Randomised controlled trial of single BCG, repeated BCG, or combined BCG and killed Mycobacterium leprae vaccine for prevention of leprosy and tuberculosis in Malawi; The Lancet, Volume 348, Issue 9019, Pages 17 - 24, 6 July 1996 Figure 15 BCG for Tuberculosis Note: In years 0-2.5 the vaccinated had double the incidence of Tuberculosis versus Placebo Group 0% Effective Source: Double blind randomized controlled trial of BCG’s effectiveness on 250,000 subjects Tuberculosis Research Centre (ICMR), Chennai, India: Indian Journal of Medical Research, 110, August 1999, pp. 56-69.
  17. Figure 16 MUMPS OUTBREAK IN HIGHLY VACCINATED POPULATION 8% 92% Vaccinated 8% Unvaccinated 92% 2006 Iowa Source: Center for Disease Control , MMWR 55 (20); May 26, 2006; pp. 559-63. Figure 17 CHICKENPOX OUTBREAK IN HIGHLY VACCINATED POPULATION 14% 86% Vaccinated 14% Unvaccinated 86% 2001 Oregon Source: Pediatrics - Vol. 113; No. 3; pp. 455-459; (2004)
  18. Figure 18 PERTUSSIS OUTBREAK IN HIGHLY VACCINATED POPULATION 10% 90% Vaccinated 10% Unvaccinated 90% 1993 Source: N.Z. Miller; Vaccine Safety Manual; Ohio N.A. Press, Sante Fe, New Mexico; p. 140; (2008) (Refers to CDC & Official Surveillance data) Figure 19 MEASLES OUTBREAK IN HIGHLY VACCINATED POPULATION 1% 99% Vaccinated 1% Unvaccinated 99% 1985 Texas Source: New England Journal of Medicine - Vol. 316; No. 13; pp. 771-774; (1987)
  19. FIGURE 20 - NIGERIA DIPHTHERIA REPORTED CASES (1973-1982) 1,000.00 800.00 600.00 EPI Begins Diphtheria Vaccine 400.00 200.00 0.00 1973 1974 1975 1976 1977 1978 1979 1980 1981 1982 Source: E. Ekanem; A 10-Year Review of Morbidity from Childhood Preventable Diseases in Nigeria: How Successful is the Expanded Programme of Immunization (EPI)?; Journal of Tropical Pediatrics, Vol. 34; No. 6; UK; 1988; pp. 323-328.
  20. FIGURE 21- NIGERIA WHOOPING COUGH CASE RATES PER 100,000 (1973-1982) 500.00 400.00 300.00 EPI Begins Pertussis Vaccine 200.00 100.00 0.00 1973 1974 1975 1976 1977 1978 1979 1980 1981 1982 Source: E. Ekanem; A 10-Year Review of Morbidity from Childhood Preventable Diseases in Nigeria: How Successful is the Expanded Programme of Immunization (EPI)?; Journal of Tropical Pediatrics, Vol. 34; No. 6; UK; 1988; pp. 323-328.
  21. FIGURE 22 - DOMINICAN REPUBLIC MEASLES CASE RATES PER 100,000 (1978-1989) 180.00 160.00 140.00 120.00 100.00 80.00 60.00 EPI Begins Measles Vaccine 40.00 20.00 0.00 1978 1979 1980 1981 1982 1983 1984 1985 1986 1987 1988 1989 Sources: Data for years 1978-1987 Taken from UNICEF Evaluation Publication No. 6, Santo Domingo, Dominican Republic, May 27, 1988; and Data for years 1988-1989 from personal communication from PAHO, EPI Unit, Aug. 21, 1990.
  22. FIGURE 23 - DOMINICAN REPUBLIC DIPHTHERIA CASE RATES PER 100,000 (1978-1987) 7.00 6.00 5.00 4.00 3.00 EPI Begins Diphtheria Vaccine 2.00 1.00 0.00 1978 1979 1980 1981 1982 1983 1984 1985 1986 1987 Source: Data for years 1978-1987 Taken from UNICEF Evaluation Publication No. 6, Santo Domingo, Dominican Republic, May 27, 1988.
  23. FIGURE 24 - DOMINICAN REPUBLIC PERTUSSIS CASE RATES PER 100,000 (1978-1989) 20.00 18.00 16.00 14.00 12.00 10.00 8.00 EPI Begins 6.00 Pertussis Vaccine 4.00 2.00 0.00 1978 1979 1980 1981 1982 1983 1984 1985 1986 1987 1988 1989 Sources: Data for years 1978-1987 Taken from UNICEF Evaluation Publication No. 6, Santo Domingo, Dominican Republic, May 27, 1988; and Data for years 1988-1989 from personal communication from PAHO, EPI Unit, Aug. 21, 1990.
  24. FIGURE SET III. Immunization Dangers Figures twenty-five (25) through thirty five (35) graphically illustrate that increases in the number of governmental mandated vaccine doses correlates with significant increases in death rates for children under the age of five (5); and that the practice is linked to sudden infant death syndrome; various degenerative diseases, including diabetes; and appears to cause general immune system impairment in infants and children. Evidence also points to the practice of immunization as a principal factor in the recent massive increases in neurodegenerative conditions such as autism in children.
  25. FIGURE 25 - COUNTRIES & NUMBER OF VACCINE DOSES MANDATED TO AGE 5 UNDER AGE 5 MORTALITY RATES FOR 2007 9 8 Under Age 5 Mortality per 1,000 Live Births 7 Mortality Increase Trendline 6 5 4 3 2 1 0 Under Age 5 Mortality statistics derived from: World Health Organization – World Health Statistics 2009 Report http://www.who.int/whosis/whostat/EN_WHS09_Table1.pdf & Govt. Mandated Vaccines figures derived from: Generation Rescue Inc. 2009 http://www.generationrescue.org/documents/SPECIAL%20REPORT%20AUTISM%202.pdf
  26. FIGURE 26 - UNDER AGE 5 INFLUENZA DEATHS BEFORE AND AFTER U.S. CDC MANDATES FLU VACCINES IN EARLY CHILDHOOD 90 80 Influenza Deaths Children Under Age 5 70 60 50 40 30 20 10 Latter half of 2002 C DC Mandates Early Childhood Flu Vaccines in USA 0 1999 2000 2001 2002 2003 Under Age 5 Influenza Mortality statistics derived from: Center for Disease Control Vital Statistics Reports covering Years 1999-2003 reported in Miller, N.Z., Vaccine Safety Manual, New Atlantean Press, Sante Fe, New Mexico, 2008, p. 97.
  27. FIGURE 27 - PERTUSSIS VACCINE & SUDDEN INFANT DEATH SYNDROME 80% 70% Post-Pertussis 60% Vaccination 50% 70% of SIDS Deaths Occurred 40% Within 3 Weeks 30% 20% 10% 0% 0.5 1 3 7 14 21 Days Post-Vaccination 2/3 of 103 infants had been vaccinated with pertussis prior to death, of which 6.5% died within 12 hours; 13% within 24 hours; 26% within 3 days; 37%, 61% & 70% within 1, 2, & 3 weeks respectively. Source: Torch W., Neurology - 32 (4 – Pt. 2) A, 1982, pp. 169-170. 4 FIGURE 28 - MEASLES VACCINE & 3.5 INFLAMMATORY BOWEL DISEASES 3 2.5 2 Unvaccinated 1.5 Vaccinated 1 0.5 0 Ulcerative Colitis Crohn's Disease Source:The Lancet - Vol. 345; 8957; 1995, pp. 1062-1063.
  28. Average Incidence First Five (5) years of Life Fever >40° Nederlands Vereniging Kritisch Prikken 2004 Survey Findings Ear Infections FIGURE 29 Inflammation of the Throat Fully Vaccinated Aggressive Behaviour No Vaccinations Events Convulsions/ Collapse Antibiotics Administered 0 0.5 1 1.5 2 2.5 Baby Cries Absolute Incidence N=543 Nederlands Vereniging Often Kritisch Prikken 2004 Survey Findings Sickly Eczema Asthma/ FIGURE 30 Chronic Lung Disease Fully Vaccinated Allergic Reactions No Vaccinations Aggressive Behaviour Difficulty Sleeping 0 20 40 60 80 100 120 140 160 180 Absolute Incidence (Non-Vaccinated in Relation to Vaccinated to N = 312 Per Group
  29. BCG Mandated in Schools & Diabetes Rates Iceland Luxembourg FIGURE 31 Spain, NO BCG VACCINATIONS Catalonia Belgium BCG VACCINATIONS Netherlands Source: Infectious Disease in Clinical Spain, Madrid Practice - No. 6, pp. 449-454; (1997) England N. Ireland Scotland Denmark Norway 0 5 10 15 20 25 Type 1 per 1000,000 – Children 0-14 Cumulative Incidence IDDM/1,000,000 UK 140 Incidence - Insulin Dependant Diabetes Mellitus FIGURE 32 120 Percentage - Pertussis Immunization Coverage Source: Journal of Pediatric Endocrinology & 100 Metabolism, 16, pp. 495-508; (2003) 80 60 40 20 0 1978/74 1979/75 1980/76 1981/77 1982/78 1983/79 1984/80 1985/81 1986/82 1987/83 1988/84 1985/86
  30. FIGURE 33 http://childhealthsafety.wordpress.com/2009/06/03/japvaxautism/ Figure based on: Kihei Terada et. al.; Alterations in epidemics and vaccination for measles during a 20 year period and a strategy for elimination in Kurashiki City, Japan; Kawasaki Medical School 2002 Mar; 76 (3):pp. 180-4. Correlated with: H. Honda et. al,; No effect of MMR withdrawal on the incidence of autism: a total population study; Journal of Child Psychology & Psychiatry; June 2005 (6); pp.572-579
  31. 25 20 FIGURE 34 18 20 16 14 15 12 10 Vaccine Mercury Burden & 10 8 Autism Rate California, USA 6 1991-1997 5 Surveys 4 2 0 0 Rate 1991 1992 1993 1994 1995 1996 1997 Rate of Autism per 10,000 Vaccine Mercury Exposure (x 10 = Micrograms) Source: Adapted from Blaxil, M., Vaccine Mercury Burden & Autism Risk (US) IOM 7/2001, http://www.healing-arts.org/children/marksslide_files/slide0003.htm
  32. VSD: Generation Zero FIGURE 35 Source: http://www.evidenceofharm.com/UCSD.ppt#363,27,VSD: Generation Zero
Advertisement